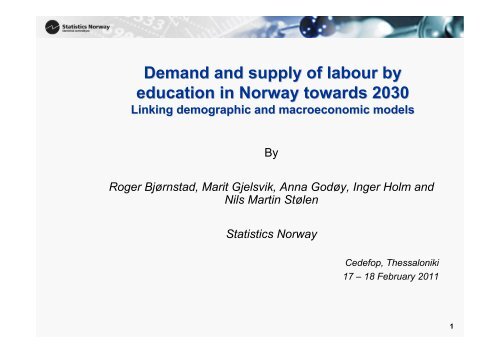
Demand and supply of labour by education in Norway towards 2030
Demand and supply of labour by education in Norway towards 2030
Demand and supply of labour by education in Norway towards 2030

You also want an ePaper? Increase the reach of your titles
YUMPU automatically turns print PDFs into web optimized ePapers that Google loves.
1<br />
<strong>Dem<strong>and</strong></strong> <strong>and</strong> <strong>supply</strong> <strong>of</strong> <strong>labour</strong> <strong>by</strong><br />
<strong>education</strong> <strong>in</strong> <strong>Norway</strong> <strong>towards</strong> <strong>2030</strong><br />
L<strong>in</strong>k<strong>in</strong>g demographic <strong>and</strong> macroeconomic models<br />
By<br />
Roger Bjørnstad, Marit Gjelsvik, Anna Godøy, Inger Holm <strong>and</strong><br />
Nils Mart<strong>in</strong> Stølen<br />
Statistics <strong>Norway</strong><br />
Cedefop, Thessaloniki<br />
17 – 18 February 2011<br />
1
Employment <strong>by</strong> level <strong>of</strong> <strong>education</strong><br />
2
Driv<strong>in</strong>g forces beh<strong>in</strong>d the development<br />
• Correspond<strong>in</strong>g development <strong>in</strong> all Western countries<br />
– Increased employment <strong>of</strong> high skilled<br />
– Reduced employment <strong>of</strong> low skilled<br />
• A major part <strong>of</strong> the development may be expla<strong>in</strong>ed <strong>by</strong> technological<br />
change<br />
– Technology has replaced low skilled, <strong>and</strong> high skilled are needed to operate<br />
technology<br />
• Stronger dem<strong>and</strong> for services because <strong>of</strong> higher <strong>in</strong>comes<br />
• International trade has caused low skilled to be replaced <strong>by</strong> import <strong>of</strong><br />
cheaper products from develop<strong>in</strong>g countries<br />
• In <strong>Norway</strong> <strong>in</strong>creased dem<strong>and</strong> for high skilled has been met <strong>by</strong> strong<br />
growth <strong>in</strong> <strong>supply</strong><br />
– Has contributed to a balanced <strong>labour</strong> market <strong>and</strong> small differences <strong>in</strong><br />
relative wages<br />
3
Need for <strong>labour</strong> market projections<br />
• Labour market projections produced <strong>by</strong> Statistics <strong>Norway</strong><br />
s<strong>in</strong>ce 1993<br />
• A plann<strong>in</strong>g tool – Projections based on certa<strong>in</strong> assumptions<br />
• May be useful for<br />
– Youths <strong>in</strong> their choice <strong>of</strong> <strong>education</strong><br />
– Authorities <strong>in</strong> plann<strong>in</strong>g <strong>education</strong>al capacity, <strong>in</strong>dustrial development<br />
<strong>and</strong> welfare reforms.<br />
• Important to avoid projected imbalances to appear<br />
4
A system <strong>of</strong> projection models <strong>in</strong> Statistics<br />
<strong>Norway</strong><br />
• BEFREG:<br />
– Projections <strong>of</strong> population <strong>by</strong> age <strong>and</strong> gender<br />
• MODAG:<br />
– Macroeconomic model with 21 <strong>in</strong>dustries<br />
– Employment <strong>in</strong> man-hours <strong>and</strong> persons, <strong>supply</strong> <strong>of</strong> <strong>labour</strong>, wages<br />
– Extended version with 5 k<strong>in</strong>ds <strong>of</strong> <strong>labour</strong> <strong>by</strong> skill<br />
– <strong>Dem<strong>and</strong></strong> further divided <strong>in</strong>to 30 k<strong>in</strong>ds <strong>of</strong> <strong>labour</strong> <strong>in</strong> a sub-model<br />
• MAKKO, HELSEMOD, LÆRERMOD:<br />
– Partial models for dem<strong>and</strong> for <strong>labour</strong> divided <strong>by</strong> <strong>education</strong> <strong>in</strong> the public<br />
sector<br />
• MOSART:<br />
– Dynamic microsimulation model project<strong>in</strong>g population <strong>and</strong> <strong>supply</strong> <strong>of</strong> <strong>labour</strong><br />
<strong>by</strong> <strong>education</strong> for given transition probabilities <strong>in</strong> the <strong>education</strong>al system <strong>and</strong><br />
the <strong>labour</strong> market<br />
5
Ma<strong>in</strong> structure <strong>of</strong> the model system<br />
6
Classification <strong>by</strong> <strong>education</strong><br />
• Chosen to diversify <strong>labour</strong> <strong>by</strong> <strong>education</strong> <strong>in</strong>stead <strong>of</strong><br />
occupation<br />
– Almost accurate <strong>in</strong>formation available from adm<strong>in</strong>istrative registers<br />
– Dist<strong>in</strong>ction between different occupations is not as evident <strong>and</strong> may<br />
change if a person moves from one <strong>in</strong>dustry to another<br />
– Education is a more precise measure <strong>of</strong> skill<br />
– Makes data organisation easier<br />
– Classification <strong>by</strong> <strong>education</strong> already established <strong>in</strong> demographic<br />
models – costly to shift<br />
• Classification <strong>by</strong> <strong>education</strong> chosen close to diversification<br />
<strong>by</strong> occupation<br />
7
Detailed level <strong>of</strong> classification <strong>and</strong><br />
correspond<strong>in</strong>g numbers <strong>of</strong> employed <strong>in</strong> 2006<br />
• 1. Primary <strong>and</strong> Lower secondary <strong>education</strong><br />
(ISCED 0-2)<br />
• 2a. Upper secondary <strong>education</strong>, general<br />
programmes (ISCED 3-4)<br />
– General programmes<br />
– Economics <strong>and</strong> adm<strong>in</strong>istration<br />
• 2b. Upper secondary <strong>education</strong>, vocational<br />
programmes (ISCED 3-4)<br />
– Electronics, mechanics, mach<strong>in</strong>ery<br />
– Build<strong>in</strong>g <strong>and</strong> construction<br />
– Science, technique <strong>and</strong> crafts<br />
– Nurs<strong>in</strong>g <strong>and</strong> caregiv<strong>in</strong>g<br />
– Other fields<br />
• 3. Tertiary <strong>education</strong>, lower degree<br />
(ISCED 5, lower degree)<br />
– Humanities <strong>and</strong> arts<br />
– Education<br />
– Social sciences<br />
– Economics <strong>and</strong> adm<strong>in</strong>istration<br />
– Eng<strong>in</strong>eer<strong>in</strong>g<br />
– Other fields <strong>of</strong> science<br />
– Nurs<strong>in</strong>g <strong>and</strong> caregiv<strong>in</strong>g<br />
– Other fields <strong>of</strong> health <strong>and</strong> social services<br />
– Other tertiary <strong>education</strong>, lower degree<br />
• 4. Tertiary <strong>education</strong>, higher degree<br />
(ISCED 5, higher degree <strong>and</strong> ISCED 6)<br />
– Humanities <strong>and</strong> arts<br />
– Education<br />
– Social sciences<br />
– Law<br />
– Economics <strong>and</strong> adm<strong>in</strong>istration<br />
– Graduate eng<strong>in</strong>eer<strong>in</strong>g<br />
– Other fields <strong>of</strong> science higher degree<br />
– Medic<strong>in</strong>e<br />
– Dental studies<br />
– Other tertiary <strong>education</strong>, higher degree<br />
• Unknown<br />
8
The macroeconomic model MODAG<br />
• Disaggregated model with 21 <strong>in</strong>dustries <strong>and</strong> <strong>in</strong>put-output cernal based<br />
on the National Accounts<br />
• Econometric equations describ<strong>in</strong>g behaviour<br />
• Man-hours, employed persons <strong>and</strong> wage rates<br />
• St<strong>and</strong>ard version homogenous <strong>labour</strong><br />
• Extended version: Labour divided <strong>in</strong> 5 categories <strong>by</strong> level <strong>of</strong> <strong>education</strong><br />
• Labour <strong>supply</strong> based on participation rates <strong>by</strong> <strong>education</strong>, gender <strong>and</strong><br />
age from LFS<br />
• Consistency: NA = LFS + foreigners work<strong>in</strong>g <strong>in</strong> Norwegian firms<br />
• Used for medium term analyses up to 20 years ahead<br />
9
Ma<strong>in</strong> assumptions beh<strong>in</strong>d the macroeconomic<br />
projections<br />
• <strong>Norway</strong> only gently hurt <strong>by</strong> the<br />
f<strong>in</strong>ancial crises<br />
• Assumptions about a rapid<br />
recovery<br />
• Back to long term trend levels <strong>in</strong> a<br />
few years<br />
• 2-2.5 yearly percent growth <strong>in</strong><br />
GDP<br />
• Total LFS unemployment rate<br />
stable at 3.1 per cent from 2016<br />
• Small decrease <strong>in</strong> average<br />
<strong>in</strong>come tax from 2011 to 2023,<br />
followed <strong>by</strong> a small <strong>in</strong>crease<br />
10
Employment <strong>by</strong> sector<br />
• An age<strong>in</strong>g population <strong>and</strong><br />
modest growth <strong>in</strong> st<strong>and</strong>ards<br />
cause a grow<strong>in</strong>g share <strong>of</strong><br />
employed <strong>in</strong> health <strong>and</strong><br />
caregiv<strong>in</strong>g services<br />
Share <strong>of</strong> total employment<br />
Manufactur<strong>in</strong>g<br />
Private services<br />
Public sector<br />
2009<br />
10.8<br />
45.7<br />
29.8<br />
2010<br />
8.6<br />
43.6<br />
36.6<br />
11
<strong>Dem<strong>and</strong></strong> for <strong>labour</strong> <strong>by</strong> <strong>education</strong>al field<br />
• Diversification <strong>of</strong> employment <strong>in</strong>to 30 <strong>education</strong>al groups <strong>by</strong><br />
field based on <strong>in</strong>formation from adm<strong>in</strong>istrative registers <strong>and</strong><br />
LFS<br />
• In private <strong>in</strong>dustries <strong>education</strong>-specific employment shares<br />
are projected <strong>by</strong> assum<strong>in</strong>g cont<strong>in</strong>u<strong>in</strong>g trends<br />
• Partial models are used to project dem<strong>and</strong> for <strong>labour</strong> <strong>by</strong><br />
<strong>education</strong> <strong>in</strong> public sectors<br />
• Assumptions about some possibilities for growth <strong>in</strong> service<br />
st<strong>and</strong>ards <strong>in</strong> the first years<br />
• Smaller possibilities for growth <strong>in</strong> st<strong>and</strong>ards as time passes<br />
because <strong>of</strong> tighter f<strong>in</strong>ancial constra<strong>in</strong>ts <strong>and</strong> a grow<strong>in</strong>g<br />
population <strong>of</strong> elderly persons<br />
12
Educations at upper secondary school level<br />
13
Tertiary level, lower degree<br />
14
Tertiary level higher degree<br />
15
Alternative assumptions about <strong>supply</strong> <strong>of</strong> <strong>labour</strong><br />
<strong>by</strong> <strong>education</strong><br />
• Extended MODAG<br />
– Labour market participation rates <strong>by</strong> age <strong>and</strong> gender l<strong>in</strong>ked to<br />
correspond<strong>in</strong>g groups <strong>of</strong> <strong>in</strong>dividuals <strong>in</strong> work<strong>in</strong>g age<br />
– Discrepancy between <strong>supply</strong> <strong>and</strong> dem<strong>and</strong> for the 5 groups <strong>of</strong><br />
<strong>education</strong> affects wage formation<br />
– Wages affect participation rates as well as dem<strong>and</strong> for <strong>labour</strong><br />
– However equilibrium mechanisms not strong enough to secure a<br />
stable path <strong>in</strong>clud<strong>in</strong>g stable unemployment →<br />
– Labour force for the 5 <strong>education</strong>al groups determ<strong>in</strong>ed from the<br />
dem<strong>and</strong> side <strong>and</strong> exogenous rates <strong>of</strong> unemployment<br />
• MOSART based on assumptions about constant<br />
propensities for <strong>education</strong> <strong>and</strong> detailed participation rates<br />
16
Project<strong>in</strong>g <strong>supply</strong> <strong>of</strong> <strong>labour</strong> <strong>by</strong> <strong>education</strong> us<strong>in</strong>g<br />
the dynamic microsimulation model MOSART<br />
• Based on data from adm<strong>in</strong>istrative registers <strong>and</strong> calibrated aga<strong>in</strong>st<br />
aggregate data <strong>and</strong> demographic projections<br />
• Simulates the further life-course <strong>of</strong> the Norwegian population<br />
• The model projects choice <strong>of</strong> <strong>education</strong>, <strong>and</strong> the level <strong>of</strong> <strong>education</strong> is<br />
important for <strong>labour</strong> force participation <strong>and</strong> retirement<br />
• Transition probabilities for<br />
– Enter<strong>in</strong>g <strong>education</strong><br />
– Choice <strong>of</strong> <strong>education</strong>al field<br />
– Rema<strong>in</strong><strong>in</strong>g <strong>in</strong> <strong>education</strong><br />
– Complet<strong>in</strong>g <strong>education</strong><br />
• 22 different <strong>education</strong>s <strong>in</strong>cluded <strong>in</strong> the model, but because <strong>of</strong> need for<br />
updat<strong>in</strong>g only able to present projections for the four ma<strong>in</strong> levels <strong>of</strong><br />
<strong>education</strong> at the moment.<br />
17
Population 16-74 <strong>by</strong> level <strong>of</strong> <strong>education</strong><br />
1000 persons<br />
1800<br />
1600<br />
1400<br />
Primary <strong>and</strong> lower secondary <strong>education</strong><br />
Upper secondary <strong>education</strong><br />
Tertiary <strong>education</strong>, lower degree<br />
Tertiary <strong>education</strong>, higher degree<br />
Unknown<br />
1200<br />
1000<br />
800<br />
600<br />
400<br />
200<br />
0<br />
1990 1995 2000 2005 2010 2015 2020 2025 <strong>2030</strong><br />
18
Compar<strong>in</strong>g projections with fixed <strong>education</strong>al<br />
propensities with what is needed<br />
19
Projected dem<strong>and</strong> for <strong>labour</strong> <strong>by</strong> level <strong>of</strong><br />
<strong>education</strong>. Percent<br />
2006 <strong>2030</strong><br />
Primary <strong>and</strong> lower secondary 21 14<br />
Upper secondary <strong>education</strong> 45 44<br />
Tertiary <strong>education</strong>, lower degree 25 33<br />
Tertiary <strong>education</strong>, higher degree 8 10<br />
20
Conclud<strong>in</strong>g remarks<br />
• Projections based on discussable assumptions must be<br />
used with precaution<br />
• But be<strong>in</strong>g aware <strong>of</strong> the assumptions the projections<br />
summarize a lot <strong>of</strong> relevant <strong>and</strong> important <strong>in</strong>formation<br />
• Compar<strong>in</strong>g projections <strong>of</strong> dem<strong>and</strong> for different k<strong>in</strong>ds <strong>of</strong><br />
<strong>labour</strong> with projections <strong>of</strong> <strong>supply</strong> for given <strong>education</strong>al<br />
propensities may give relevant <strong>in</strong>formation for authorities<br />
<strong>and</strong> youths<br />
• Projections <strong>of</strong> relevant future trends <strong>in</strong> dem<strong>and</strong> for different<br />
k<strong>in</strong>ds <strong>of</strong> <strong>education</strong> are highly relevant <strong>in</strong> themselves<br />
21