


Create successful ePaper yourself
Turn your PDF publications into a flip-book with our unique Google optimized e-Paper software.
Part 1 | Introduction - Overview<br />
TOP 100 Most Valuable Chinese Brands <strong>2015</strong><br />
OVERVIEW | Market-Driven vs. SOE Brands<br />
Market-driven brand value<br />
doubled, SOE value declined<br />
The value of market-driven<br />
brands in the <strong>BrandZ</strong> Top 100<br />
Most Valuable Chinese Brands<br />
increased 97 percent year-onyear,<br />
as <strong>China</strong> rebalanced and the<br />
government encouraged market<br />
competition.<br />
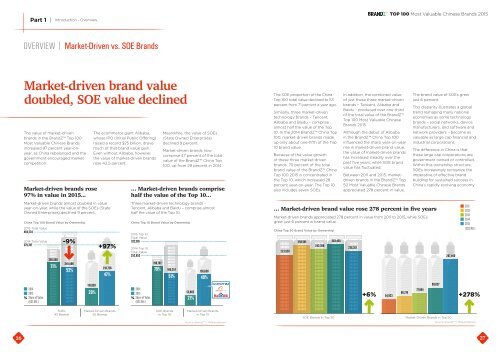
Market-driven brands rose<br />
97% in value in <strong>2015</strong>...<br />
Market-driven brands almost doubled in value<br />
year-on-year, while the value of the SOEs (State<br />
Owned Enterprises) declined 9 percent.<br />
<strong>China</strong> Top 100 Brand Value by Ownership<br />
<strong>2015</strong> Total Value<br />
464,234<br />
2014 Total Value<br />
379,787<br />
268,958<br />
71%<br />
-9%<br />
245,506<br />
53%<br />
The ecommerce giant Alibaba,<br />
whose IPO (Initial Public Offering)<br />
raised a record $25 billion, drove<br />
much of that brand value gain.<br />
Even without Alibaba, however,<br />
the value of market-driven brands<br />
rose 43.5 percent.<br />
+97%<br />
218,728<br />
47%<br />
Meanwhile, the value of SOEs<br />
(State Owned Enterprises)<br />
declined 9 percent.<br />
Market-driven brands now<br />
comprise 47 percent of the total<br />
value of the <strong>BrandZ</strong> <strong>China</strong> Top<br />
100, up from 29 percent in 2014.<br />
… Market-driven brands comprise<br />
half the value of the Top 10…<br />
Three market-driven technology brands –<br />
Tencent, Alibaba and Baidu – comprise almost<br />
half the value of the Top 10.<br />
<strong>China</strong> Top 10 Brand Value by Ownership<br />
<strong>2015</strong> Top 10<br />
Total Value<br />
322,916<br />
2014 Top 10<br />
Total Value<br />
252,653<br />
110,828<br />
2014 2014<br />
<strong>2015</strong> 29%<br />
<strong>2015</strong><br />
% Share of Value<br />
% Share of Value<br />
(US$ Mil.)<br />
(US$ Mil.)<br />
198,787<br />
79%<br />
166,257<br />
51%<br />
53,865<br />
21%<br />
156,658<br />
49%<br />
The SOE proportion of the <strong>China</strong><br />
Top 100 total value declined to 53<br />
percent from 71 percent a year ago.<br />
Similarly, three market-driven<br />
technology brands – Tencent,<br />
Alibaba and Baidu – comprise<br />
almost half the value of the Top<br />
10. In the 2014 <strong>BrandZ</strong> <strong>China</strong> Top<br />
100, market-driven brands made<br />
up only about one-fifth of the Top<br />
10 brand value.<br />
Because of the value growth<br />
of these three market-driven<br />
brands, 70 percent of the total<br />
brand value of the <strong>BrandZ</strong> <strong>China</strong><br />
Top 100 <strong>2015</strong> is concentrated in<br />
the Top 10, which increased 28<br />
percent year-on-year. The Top 10<br />
also includes seven SOEs.<br />
In addition, the combined value<br />
of just these three market-driven<br />
brands – Tencent, Alibaba and<br />
Baidu – produced over one-third<br />
of the total value of the <strong>BrandZ</strong><br />
Top 100 Most Valuable Chinese<br />
Brands <strong>2015</strong>.<br />
Although the debut of Alibaba<br />
in the <strong>BrandZ</strong> <strong>China</strong> Top 100<br />
influenced the sharp year-on-year<br />
rise in market-driven brand value,<br />
the value of market-driven brands<br />
has increased steadily over the<br />
past five years, while SOE brand<br />
value has fluctuated.<br />
Between 2011 and <strong>2015</strong>, marketdriven<br />
brands in the <strong>BrandZ</strong> Top<br />
50 Most Valuable Chinese Brands<br />
appreciated 278 percent in value.<br />
… Market-driven brand value rose 278 percent in five years<br />
Market-driven brands appreciated 278 percent in value from 2011 to <strong>2015</strong>, while SOEs<br />
grew just 6 percent in brand value.<br />
<strong>China</strong> Top 50 Brand Value by Ownership<br />
223,926<br />
258,591<br />
242,360<br />
263,435<br />
236,361<br />
The brand value of SOEs grew<br />
just 6 percent.<br />
This disparity illustrates a global<br />
trend reshaping many national<br />
economies as some technology<br />
brands – social networks, device<br />
manufacturers, and software and<br />
network providers – become as<br />
valuable as large cap financial and<br />
industrial corporations.<br />
The difference in <strong>China</strong> is that<br />
these large cap corporations are<br />
government owned or controlled.<br />
Within this ownership structure,<br />
SOEs increasingly recognize the<br />
imperative of effective brand<br />
building for sustained success in<br />
<strong>China</strong>’s rapidly evolving economy.<br />
99,027<br />
207,400<br />
2011<br />
2012<br />
2013<br />
2014<br />
<strong>2015</strong><br />
(US$ Mil.)<br />
77,864<br />
66,778<br />
+6% 54,923<br />
+278%<br />
SOEs<br />
45 Brands<br />
Market-Driven Brands<br />
55 Brands<br />
SOE Brands<br />
in Top 10<br />
Market-Driven Brands<br />
in Top 10<br />
SOE Brands in Top 50 Market-Driven Brands in Top 50<br />
Source: <strong>BrandZ</strong> / Millward Brown<br />
Source: <strong>BrandZ</strong> / Millward Brown<br />
26<br />
27