Download This Issue - Citrus Research Board
Download This Issue - Citrus Research Board
Download This Issue - Citrus Research Board

You also want an ePaper? Increase the reach of your titles
YUMPU automatically turns print PDFs into web optimized ePapers that Google loves.
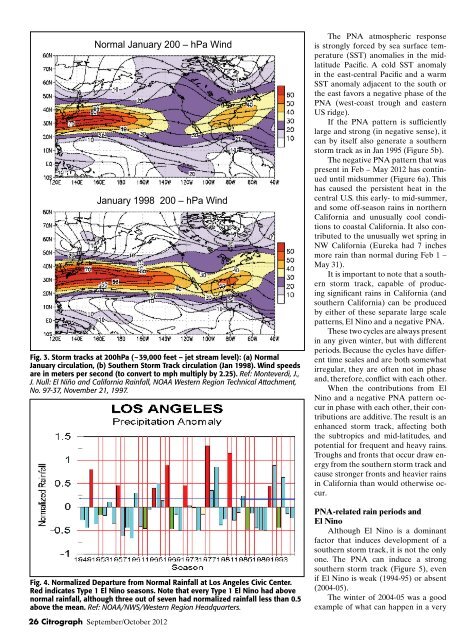
Normal January 200 – hPa Wind<br />
January 1998 200 – hPa Wind<br />
Fig. 3. Storm tracks at 200hPa (~39,000 feet – jet stream level): (a) Normal<br />
January circulation, (b) Southern Storm Track circulation (Jan 1998). Wind speeds<br />
are in meters per second (to convert to mph multiply by 2.25). Ref: Monteverdi, J.,<br />
J. Null: El Niño and California Rainfall, NOAA Western Region Technical Attachment,<br />
No. 97-37, November 21, 1997.<br />
Figure 4<br />
Fig. 4. Normalized Departure from Normal Rainfall at Los Angeles Civic Center.<br />
Red indicates Type 1 El Nino seasons. Note that every Type 1 El Nino had above<br />
normal rainfall, although three out of seven had normalized rainfall less than 0.5<br />
above the mean. Ref: NOAA/NWS/Western Region Headquarters.<br />
26 Citrograph September/October 2012<br />
The PNA atmospheric response<br />
is strongly forced by sea surface temperature<br />
(SST) anomalies in the midlatitude<br />
Pacific. A cold SST anomaly<br />
in the east-central Pacific and a warm<br />
SST anomaly adjacent to the south or<br />
the east favors a negative phase of the<br />
PNA (west-coast trough and eastern<br />
US ridge).<br />
If the PNA pattern is sufficiently<br />
large and strong (in negative sense), it<br />
can by itself also generate a southern<br />
storm track as in Jan 1995 (Figure 5b).<br />
The negative PNA pattern that was<br />
present in Feb – May 2012 has continued<br />
until midsummer (Figure 6a). <strong>This</strong><br />
has caused the persistent heat in the<br />
central U.S. this early- to mid-summer,<br />
and some off-season rains in northern<br />
California and unusually cool conditions<br />
to coastal California. It also contributed<br />
to the unusually wet spring in<br />
NW California (Eureka had 7 inches<br />
more rain than normal during Feb 1 –<br />
May 31).<br />
It is important to note that a southern<br />
storm track, capable of producing<br />
significant rains in California (and<br />
southern California) can be produced<br />
by either of these separate large scale<br />
patterns, El Nino and a negative PNA.<br />
These two cycles are always present<br />
in any given winter, but with different<br />
periods. Because the cycles have different<br />
time scales and are both somewhat<br />
irregular, they are often not in phase<br />
and, therefore, conflict with each other.<br />
When the contributions from El<br />
Nino and a negative PNA pattern occur<br />
in phase with each other, their contributions<br />
are additive. The result is an<br />
enhanced storm track, affecting both<br />
the subtropics and mid-latitudes, and<br />
potential for frequent and heavy rains.<br />
Troughs and fronts that occur draw energy<br />
from the southern storm track and<br />
cause stronger fronts and heavier rains<br />
in California than would otherwise occur.<br />
PNA-related rain periods and<br />
El Nino<br />
Although El Nino is a dominant<br />
factor that induces development of a<br />
southern storm track, it is not the only<br />
one. The PNA can induce a strong<br />
southern storm track (Figure 5), even<br />
if El Nino is weak (1994-95) or absent<br />
(2004-05).<br />
The winter of 2004-05 was a good<br />
example of what can happen in a very