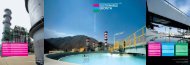
Download Annual Report 2005 (PDF) - Sembcorp
Download Annual Report 2005 (PDF) - Sembcorp
Download Annual Report 2005 (PDF) - Sembcorp

Create successful ePaper yourself
Turn your PDF publications into a flip-book with our unique Google optimized e-Paper software.
The Group incurred lower professional fees with respect<br />
to the Solitaire arbitration in <strong>2005</strong>.<br />
Cashflow and liquidity<br />
As at December 31, <strong>2005</strong>, the Group had cash and cash<br />
equivalents of S$1.2 billion as compared to S$2.1 billion<br />
as at end 2004. Cash and cash equivalents as at December<br />
2004 included S$1.3 billion received by Logistics, for the<br />
disposal of its 20% stake in KNI. In <strong>2005</strong>, S$702 million<br />
was paid to our shareholders and minority shareholders of<br />
Logistics via special interim dividends and capital reduction.<br />
Our operating cashflow has been steadily growing. In <strong>2005</strong>,<br />
cash generated from operations was S$828 million as<br />
compared to S$494 million the previous year. The increase<br />
was mainly due to better performance of our underlying<br />
businesses and better working capital management.<br />
Cash outflow from investing activities was S$99.9 million,<br />
as compared to a cash inflow of S$1.2 billion the previous<br />
year. The cash inflow in 2004 was substantially contributed<br />
by the proceeds from the divestment of Logistics’ stake in<br />
KNI of about S$1.3 billion. Cash outflow for the addition<br />
of fixed assets was S$366 million, incurred mainly with<br />
respect to the acquisition of plant and machinery as well<br />
as capital work-in-progress for the Utilities and Marine<br />
Engineering businesses.<br />
The repayment of loan and interest, together with<br />
the special interim dividends and capital reduction by<br />
SembCorp Industries and Logistics, led to a cash outflow<br />
from financing activities of S$1.6 billion.<br />
Free cashflow as at December 31, <strong>2005</strong> was S$968 million.<br />
Shareholder returns<br />
Excluding the exceptional items, Return On Equity (ROE)<br />
improved from 12.8% in 2004 to 14.2% in <strong>2005</strong>; and<br />
Earnings Per Share (EPS) increased from 12.5 cents<br />
to 15.7 cents in <strong>2005</strong>.<br />
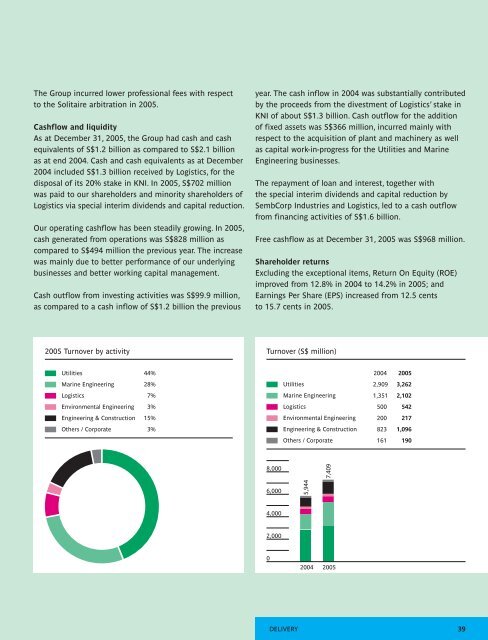
<strong>2005</strong> Turnover by activity<br />
Turnover (S$ million)<br />
Utilities 44%<br />
Marine Engineering 28%<br />
Logistics 7%<br />
Environmental Engineering 3%<br />
Engineering & Construction 15%<br />
Others / Corporate 3%<br />
Utilities<br />
Marine Engineering<br />
Logistics<br />
Environmental Engineering<br />
Engineering & Construction<br />
Others / Corporate<br />
2004 <strong>2005</strong><br />
2,909 3,262<br />
1,351 2,102<br />
500 542<br />
200 217<br />
823 1,096<br />
161 190<br />
8,000<br />
7,409<br />
6,000<br />
5,944<br />
4,000<br />
2,000<br />
0<br />
2004 <strong>2005</strong><br />
DELIVERY 39