- Page 1 and 2: SembCorp Industries Annual Report 2
- Page 3 and 4: Our Shanghai Caojing Cogeneration p
- Page 5: Performance at a glance Our Phu My
- Page 9 and 10: (Pictured) Deep Driller 1, the firs
- Page 11 and 12: 10 SEMBCORP INDUSTRIES ANNUAL REPOR
- Page 13 and 14: Chairman’s Statement 12 SEMBCORP
- Page 15 and 16: Chairman’s Statement has played a
- Page 17 and 18: CEO’s Review 16 SEMBCORP INDUSTRI
- Page 19 and 20: CEO’s Review our service offering
- Page 21 and 22: 20 SEMBCORP INDUSTRIES ANNUAL REPOR
- Page 23 and 24: Board of Directors 22 SEMBCORP INDU
- Page 25 and 26: Board of Directors Peter Seah Lim H
- Page 27 and 28: Board of Directors Name Past direct
- Page 29 and 30: Key Executives 28 SEMBCORP INDUSTRI
- Page 31 and 32: Key Executives Tang Kin Fei Group P
- Page 33 and 34: Key Executives Corporate Management
- Page 35 and 36: A pioneer of the multi-utility conc
- Page 37 and 38: 36 SEMBCORP INDUSTRIES ANNUAL REPOR
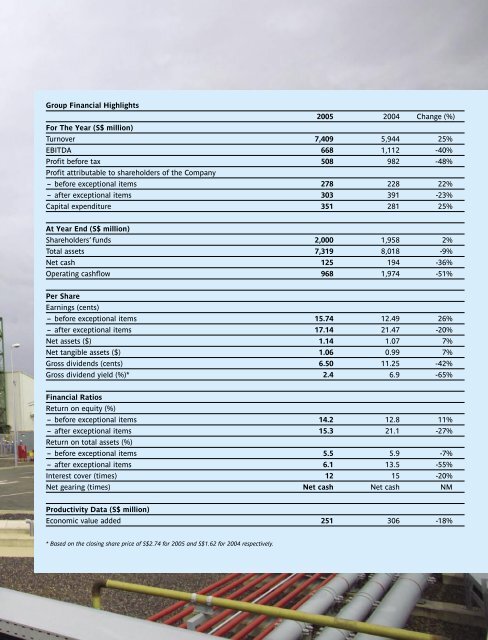
- Page 39 and 40: Group Financial Review Strong growt
- Page 41 and 42: Group Financial Review PATMI (befor
- Page 43 and 44: 42 SEMBCORP INDUSTRIES ANNUAL REPOR
- Page 45 and 46: Organisational Overview SembCorp In
- Page 47 and 48: Significant Events in 2005 JANUARY
- Page 50 and 51: Special Feature Focused on Utilitie
- Page 53 and 54: Strong Performance Special Feature
- Page 55 and 56: Strong Performance Special Feature
- Page 57:
56 SEMBCORP INDUSTRIES ANNUAL REPOR
- Page 60 and 61:
Focused on Utilities We provide one
- Page 62 and 63:
Focused on Utilities We believe tha
- Page 65:
64 SEMBCORP INDUSTRIES ANNUAL REPOR
- Page 68 and 69:
Focused on Utilities Working togeth
- Page 70 and 71:
Focused on Utilities Fundamental to
- Page 72 and 73:
Focused on Utilities Our Key Produc
- Page 74 and 75:
(Pictured) SembCorp Utilities’ Sh
- Page 76 and 77:
Value In this section Operating and
- Page 78 and 79:
(Pictured) SembCorp Cogen, our gas-
- Page 80 and 81:
As the construction of our new faci
- Page 82 and 83:
This fifth generation ultra-deepwat
- Page 84 and 85:
Contracts secured in 2005 Month Val
- Page 86 and 87:
With some of its warehouses reachin
- Page 88 and 89:
in eastern China by leasing 13,000
- Page 90 and 91:
(Pictured) SembCorp Environmental M
- Page 92 and 93:
waste paper market in China when we
- Page 94 and 95:
SembCorp Engineers and Constructors
- Page 96 and 97:
Significant contracts in orderbook
- Page 98 and 99:
Sustainability In this section - Co
- Page 100 and 101:
via audio-visual communication at B
- Page 102 and 103:
The ExCo is chaired by Mr Peter Sea
- Page 104 and 105:
Risk Committee (RC) In 2005, the RC
- Page 106 and 107:
The Board has separate and independ
- Page 108 and 109:
Internal audit Independent internal
- Page 110 and 111:
(Pictured) Shareholders voting at o
- Page 112 and 113:
SembCorp Utilities’ gas unit supp
- Page 114 and 115:
SembCorp Group’s environmental bu
- Page 116 and 117:
Certification systems in place in t
- Page 118 and 119:
Innovation and quality circles at S
- Page 120 and 121:
Health and safety During the outbre
- Page 122 and 123:
KPI 1: SembCorp Industries - Charit
- Page 124 and 125:
KPI 5: SembEnviro - Vehicle acciden
- Page 126 and 127:
(Pictured) Advanced firefighting ma
- Page 128 and 129:
The status of ERM implementation in
- Page 130 and 131:
Treasury management The Group’s f
- Page 132 and 133:
Financing & Treasury Highlights Gro
- Page 134 and 135:
Leveraging technology for greener e
- Page 136 and 137:
(Pictured) Site visit by analysts t
- Page 138 and 139:
developments in our Company. We als
- Page 140 and 141:
For the year, our shares averaged S
- Page 142 and 143:
At SembCorp, team sports help to pr
- Page 144 and 145:
Corporate headquarters reorganisati
- Page 146 and 147:
Performance In this section Statuto
- Page 148 and 149:
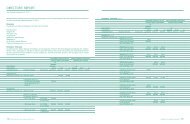
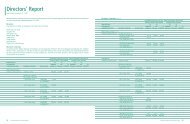
Directors’ Report Year ended Dece
- Page 150 and 151:
Directors’ Report Year ended Dece
- Page 152 and 153:
Directors’ Report Year ended Dece
- Page 154 and 155:
Directors’ Report Year ended Dece
- Page 156 and 157:
Directors’ Report Year ended Dece
- Page 158 and 159:
Directors’ Report Year ended Dece
- Page 160 and 161:
Directors’ Report Year ended Dece
- Page 162 and 163:
Directors’ Report Year ended Dece
- Page 164 and 165:
Directors’ Report Year ended Dece
- Page 166 and 167:
Directors’ Report Year ended Dece
- Page 168 and 169:
Directors’ Report Year ended Dece
- Page 170 and 171:
Report of the Auditors to the Membe
- Page 172 and 173:
Consolidated Profit and Loss Accoun
- Page 174 and 175:
Consolidated Statement of Changes i
- Page 176 and 177:
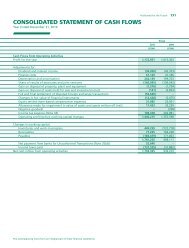
Consolidated Statement of Cash Flow
- Page 178 and 179:
Notes to the Financial Statements Y
- Page 180 and 181:
Notes to the Financial Statements Y
- Page 182 and 183:
Notes to the Financial Statements Y
- Page 184 and 185:
Notes to the Financial Statements Y
- Page 186 and 187:
Notes to the Financial Statements Y
- Page 188 and 189:
Notes to the Financial Statements Y
- Page 190 and 191:
Notes to the Financial Statements Y
- Page 192 and 193:
Notes to the Financial Statements Y
- Page 194 and 195:
Notes to the Financial Statements Y
- Page 196 and 197:
Notes to the Financial Statements Y
- Page 198 and 199:
Notes to the Financial Statements Y
- Page 200 and 201:
Notes to the Financial Statements Y
- Page 202 and 203:
Notes to the Financial Statements Y
- Page 204 and 205:
Notes to the Financial Statements Y
- Page 206 and 207:
Notes to the Financial Statements Y
- Page 208 and 209:
Notes to the Financial Statements Y
- Page 210 and 211:
Notes to the Financial Statements Y
- Page 212 and 213:
Notes to the Financial Statements Y
- Page 214 and 215:
Notes to the Financial Statements Y
- Page 216 and 217:
Notes to the Financial Statements Y
- Page 218 and 219:
Notes to the Financial Statements Y
- Page 220 and 221:
Notes to the Financial Statements Y
- Page 222 and 223:
Notes to the Financial Statements Y
- Page 224 and 225:
Notes to the Financial Statements Y
- Page 226 and 227:
Notes to the Financial Statements Y
- Page 228 and 229:
Notes to the Financial Statements Y
- Page 230 and 231:
Notes to the Financial Statements Y
- Page 232 and 233:
Notes to the Financial Statements Y
- Page 234 and 235:
Notes to the Financial Statements Y
- Page 236 and 237:
Notes to the Financial Statements Y
- Page 238 and 239:
Notes to the Financial Statements Y
- Page 240 and 241:
Notes to the Financial Statements Y
- Page 242 and 243:
Notes to the Financial Statements Y
- Page 244 and 245:
Notes to the Financial Statements Y
- Page 246 and 247:
Notes to the Financial Statements Y
- Page 248 and 249:
Notes to the Financial Statements Y
- Page 250 and 251:
Notes to the Financial Statements Y
- Page 252 and 253:
Notes to the Financial Statements Y
- Page 254 and 255:
Notes to the Financial Statements Y
- Page 256 and 257:
Notes to the Financial Statements Y
- Page 258 and 259:
Notes to the Financial Statements Y
- Page 260 and 261:
Notes to the Financial Statements Y
- Page 262 and 263:
Notes to the Financial Statements Y
- Page 264 and 265:
Notes to the Financial Statements Y
- Page 266 and 267:
Notes to the Financial Statements Y
- Page 268 and 269:
Supplementary Information Year ende
- Page 270 and 271:
EVA Statement Year ended December 3
- Page 272 and 273:
Five-Year Performance Financials Tu
- Page 274 and 275:
Five-Year Performance Productivity
- Page 276 and 277:
Five-Year Performance Value Added S
- Page 278 and 279:
Quarterly Performance Group Quarter
- Page 280 and 281:
Corporate Information Board of Dire
- Page 282 and 283:
Notice of Annual General Meeting 2.
- Page 284 and 285:
Corporate Directory SembCorp Indust
- Page 286 and 287:
Corporate Directory SembCorp (Malay
- Page 288 and 289:
Proxy Form SembCorp Industries Ltd