

ped-safety-action-plan-queens
ped-safety-action-plan-queens
ped-safety-action-plan-queens

Create successful ePaper yourself
Turn your PDF publications into a flip-book with our unique Google optimized e-Paper software.
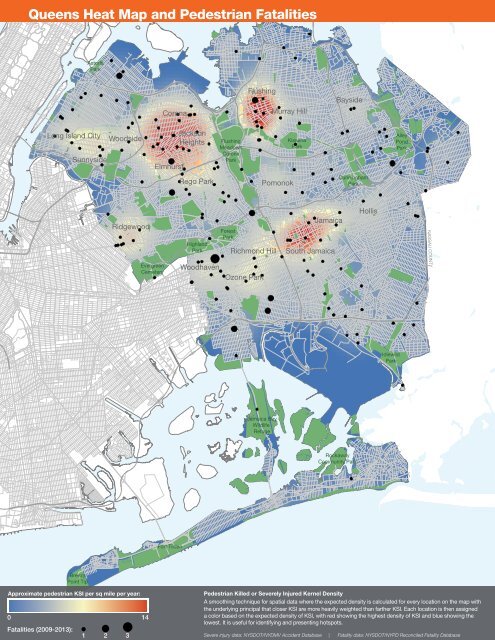
Queens Heat Map and Pedestrian Fatalities<br />
Astoria<br />
Park<br />
Corona<br />
Flushing<br />
Murray Hill<br />
Bayside<br />
Long Island City<br />
Sunnyside<br />
Woodside<br />
Elmhurst<br />
Jackson<br />
Heights<br />
Flushing<br />
Meadows<br />
Corona<br />
Park<br />
Kissena<br />
Park<br />
Alley<br />
Pond<br />
Park<br />
Rego Park<br />
Pomonok<br />
Cunningham<br />
Park<br />
Ridgewood<br />
Highland<br />
Park<br />
Forest<br />
Park<br />
Richmond Hill<br />
Jamaica<br />
South Jamaica<br />
Hollis<br />
NASSAU COUNTY<br />
Evergreen<br />
Cemetery<br />
Woodhaven<br />
Ozone Park<br />
Idlewild<br />
Park<br />
Jamaica Bay<br />
Wildlife<br />
Refuge<br />
Rockaway<br />
Community Park<br />
Fort Tilden<br />
Breezy<br />
Point Tip<br />
Approximate <strong>ped</strong>estrian KSI per sq mile per year:<br />
0 14<br />
Fatalities (2009-2013):<br />
1 2 3<br />
Pedestrian Killed or Severely Injured Kernel Density<br />
A smoothing technique for spatial data where the expected density is calculated for every location on the map with<br />
the underlying principal that closer KSI are more heavily weighted than farther KSI. Each location is then assigned<br />
a color based on the expected density of KSI, with red showing the highest density of KSI and blue showing the<br />
lowest. It is useful for identifying and presenting hotspots.<br />
Severe injury data: NYSDOT/NYDMV Accident Database | Fatality data: NYSDOT/NYPD Reconciled Fatality Database