ZINC OXIDE VARISTORS Introduction
ZINC OXIDE VARISTORS Introduction
ZINC OXIDE VARISTORS Introduction

Create successful ePaper yourself
Turn your PDF publications into a flip-book with our unique Google optimized e-Paper software.
Zinc Oxide Varistors<br />
<strong>Introduction</strong><br />
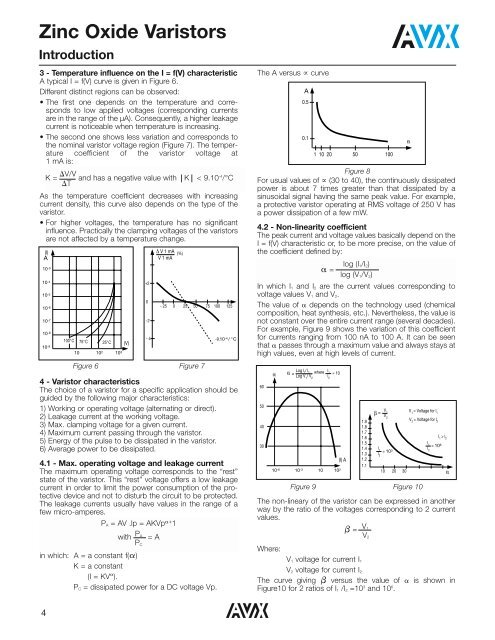
3 - Temperature influence on the I = f(V) characteristic<br />
A typical I = f(V) curve is given in Figure 6.<br />
Different distinct regions can be observed:<br />
• The first one depends on the temperature and corresponds<br />
to low applied voltages (corresponding currents<br />
are in the range of the µA). Consequently, a higher leakage<br />
current is noticeable when temperature is increasing.<br />
• The second one shows less variation and corresponds to<br />
the nominal varistor voltage region (Figure 7). The temperature<br />
coefficient of the varistor voltage at<br />
1 mA is:<br />
V/V<br />
K = and has a negative value with ⎮K⎮ < 9.10 -4 /°C<br />
T<br />
As the temperature coefficient decreases with increasing<br />
current density, this curve also depends on the type of the<br />
varistor.<br />
• For higher voltages, the temperature has no significant<br />
influence. Practically the clamping voltages of the varistors<br />
are not affected by a temperature change.<br />
(I)<br />
A<br />
10 -3<br />
10 -4<br />
10 -5<br />
10 -6<br />
10 -7<br />
10 -8<br />
10 -9<br />
100°C 75°C 25°C<br />
10 10 2 10 3<br />
(V)<br />
4 - Varistor characteristics<br />
The choice of a varistor for a specific application should be<br />
guided by the following major characteristics:<br />
1) Working or operating voltage (alternating or direct).<br />
2) Leakage current at the working voltage.<br />
3) Max. clamping voltage for a given current.<br />
4) Maximum current passing through the varistor.<br />
5) Energy of the pulse to be dissipated in the varistor.<br />
6) Average power to be dissipated.<br />
4.1 - Max. operating voltage and leakage current<br />
The maximum operating voltage corresponds to the “rest”<br />
state of the varistor. This “rest” voltage offers a low leakage<br />
current in order to limit the power consumption of the protective<br />
device and not to disturb the circuit to be protected.<br />
The leakage currents usually have values in the range of a<br />
few micro-amperes.<br />
P A = AV .lp = AKVp + 1<br />
with<br />
P A<br />
P C<br />
= A<br />
in which: A = a constant f(<br />
a )<br />
K = a constant<br />
(I = KVa).<br />
P C = dissipated power for a DC voltage Vp.<br />
+2<br />
0<br />
-2<br />
- 4<br />
(%) ∆ V 1 mA<br />
- 25 0 25 50 75 100 125<br />
V 1 mA<br />
-9.10 -4 / °C<br />
Figure 6 Figure 7<br />
The A versus ∝ curve<br />
A<br />
0.5<br />
0.1<br />
1 10 20 50 100<br />
Figure 8<br />
For usual values of ∝ (30 to 40), the continuously dissipated<br />
power is about 7 times greater than that dissipated by a<br />
sinusoidal signal having the same peak value. For example,<br />
a protective varistor operating at RMS voltage of 250 V has<br />
a power dissipation of a few mW.<br />
4.2 - Non-linearity coefficient<br />
The peak current and voltage values basically depend on the<br />
I = f(V) characteristic or, to be more precise, on the value of<br />
the coefficient defined by:<br />
In which I 1 and I 2 are the current values corresponding to<br />
voltage values V 1 and V 2.<br />
The value of depends on the technology used (chemical<br />
composition, heat synthesis, etc.). Nevertheless, the value is<br />
not constant over the entire current range (several decades).<br />
For example, Figure 9 shows the variation of this coefficient<br />
for currents ranging from 100 nA to 100 A. It can be seen<br />
that passes through a maximum value and always stays at<br />
high values, even at high levels of current.<br />
60<br />
50<br />
40<br />
30<br />
=<br />
Log l 1 / l 2<br />
=<br />
where l 1 = 10<br />
Log V 1 / V 2 l2<br />
10 -6 10 -3 10 10 2<br />
log (I 1/I 2)<br />
log (V 1/V 2)<br />
(I) A<br />
The non-lineary of the varistor can be expressed in another<br />
way by the ratio of the voltages corresponding to 2 current<br />
values.<br />
b = V1<br />
V 2<br />
Where:<br />
V 1 voltage for current I 1<br />
V 2 voltage for current I 2<br />
The curve giving versus the value of is shown in<br />
Figure10 for 2 ratios bof I 1 /I 2 =10 3 and 10 6 .<br />
1.9<br />
1.8<br />
1.7<br />
1.6<br />
1.5<br />
1.4<br />
1.3<br />
1.2<br />
1.1<br />
V<br />
= 1<br />
V 2<br />
<br />
V 1 = Voltage for l 1<br />
V 2 = Voltage for l 2<br />
l 1 > l 2<br />
l 1 = 10<br />
l 6<br />
1<br />
l2<br />
l<br />
= 10 3<br />
2<br />
10 20 30 <br />
Figure 9 Figure 10<br />
4