

Final Report of the Evaluation of the Pupil Learning Credits Pilot ...
Final Report of the Evaluation of the Pupil Learning Credits Pilot ...
Final Report of the Evaluation of the Pupil Learning Credits Pilot ...

Create successful ePaper yourself
Turn your PDF publications into a flip-book with our unique Google optimized e-Paper software.
23<br />
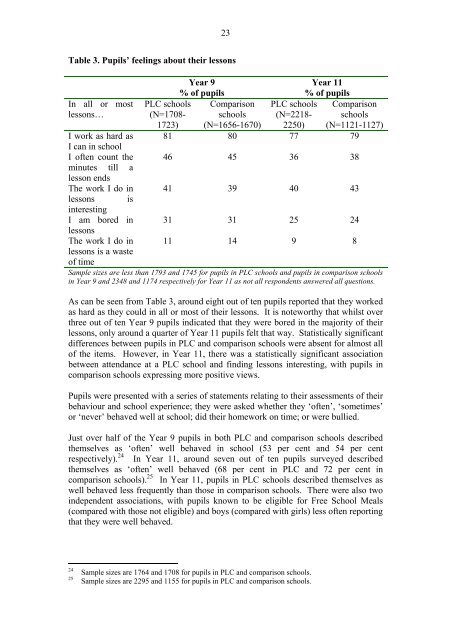
Table 3. <strong>Pupil</strong>s’ feelings about <strong>the</strong>ir lessons<br />
In all or most<br />
lessons…<br />
PLC schools<br />
(N=1708-<br />
1723)<br />
Year 9<br />
% <strong>of</strong> pupils<br />
Comparison<br />
schools<br />
(N=1656-1670)<br />
PLC schools<br />
(N=2218-<br />
2250)<br />
Year 11<br />
% <strong>of</strong> pupils<br />
Comparison<br />
schools<br />
(N=1121-1127)<br />
I work as hard as 81 80 77 79<br />
I can in school<br />
I <strong>of</strong>ten count <strong>the</strong> 46 45 36 38<br />
minutes till a<br />
lesson ends<br />
The work I do in 41 39 40 43<br />
lessons is<br />
interesting<br />
I am bored in 31 31 25 24<br />
lessons<br />
The work I do in 11 14 9 8<br />
lessons is a waste<br />
<strong>of</strong> time<br />
Sample sizes are less than 1793 and 1745 for pupils in PLC schools and pupils in comparison schools<br />
in Year 9 and 2348 and 1174 respectively for Year 11 as not all respondents answered all questions.<br />
As can be seen from Table 3, around eight out <strong>of</strong> ten pupils reported that <strong>the</strong>y worked<br />
as hard as <strong>the</strong>y could in all or most <strong>of</strong> <strong>the</strong>ir lessons. It is noteworthy that whilst over<br />
three out <strong>of</strong> ten Year 9 pupils indicated that <strong>the</strong>y were bored in <strong>the</strong> majority <strong>of</strong> <strong>the</strong>ir<br />
lessons, only around a quarter <strong>of</strong> Year 11 pupils felt that way. Statistically significant<br />
differences between pupils in PLC and comparison schools were absent for almost all<br />
<strong>of</strong> <strong>the</strong> items. However, in Year 11, <strong>the</strong>re was a statistically significant association<br />
between attendance at a PLC school and finding lessons interesting, with pupils in<br />
comparison schools expressing more positive views.<br />
<strong>Pupil</strong>s were presented with a series <strong>of</strong> statements relating to <strong>the</strong>ir assessments <strong>of</strong> <strong>the</strong>ir<br />
behaviour and school experience; <strong>the</strong>y were asked whe<strong>the</strong>r <strong>the</strong>y ‘<strong>of</strong>ten’, ‘sometimes’<br />
or ‘never’ behaved well at school; did <strong>the</strong>ir homework on time; or were bullied.<br />
Just over half <strong>of</strong> <strong>the</strong> Year 9 pupils in both PLC and comparison schools described<br />
<strong>the</strong>mselves as ‘<strong>of</strong>ten’ well behaved in school (53 per cent and 54 per cent<br />
respectively). 24 In Year 11, around seven out <strong>of</strong> ten pupils surveyed described<br />
<strong>the</strong>mselves as ‘<strong>of</strong>ten’ well behaved (68 per cent in PLC and 72 per cent in<br />
comparison schools). 25 In Year 11, pupils in PLC schools described <strong>the</strong>mselves as<br />
well behaved less frequently than those in comparison schools. There were also two<br />
independent associations, with pupils known to be eligible for Free School Meals<br />
(compared with those not eligible) and boys (compared with girls) less <strong>of</strong>ten reporting<br />
that <strong>the</strong>y were well behaved.<br />
24<br />
25<br />
Sample sizes are 1764 and 1708 for pupils in PLC and comparison schools.<br />
Sample sizes are 2295 and 1155 for pupils in PLC and comparison schools.


