START-UP OF FIRST 100 kW SYSTEM IN SHANGHAI ... - JX Crystals
START-UP OF FIRST 100 kW SYSTEM IN SHANGHAI ... - JX Crystals
START-UP OF FIRST 100 kW SYSTEM IN SHANGHAI ... - JX Crystals

You also want an ePaper? Increase the reach of your titles
YUMPU automatically turns print PDFs into web optimized ePapers that Google loves.
<strong>START</strong>-<strong>UP</strong> <strong>OF</strong> <strong>FIRST</strong> <strong>100</strong> <strong>kW</strong> <strong>SYSTEM</strong> <strong>IN</strong> <strong>SHANGHAI</strong> WITH<br />
3-SUN PV MIRROR MODULES<br />
L. Fraas 1 , J. Avery 1 , H. Huang 1 , L. Minkin 1 , R. Corio 2 , and J. Fraas 1<br />
1 <strong>JX</strong> <strong>Crystals</strong> Inc, Issaquah, WA 98027,<br />
2 Array Technologies, Albuquerque, NM<br />
ABSTRACT<br />
Thanks to funding from the Shanghai City<br />
government, Shanghai Import Export Trading Company,<br />
and Shanghai Flower Port, we have designed and<br />
fabricated in pilot production the first 3-sun 180 W (STC)<br />
mirror panels. Three of these panels were first tested in<br />
the US showing calibrated PTC ratings of 150 W. Then 24<br />
panels were installed on two 2-axis trackers at the Flower<br />
Port in Shanghai. Then 672 panels were installed on a<br />
horizontal beam tracker on a building rooftop at the Flower<br />
Port. Test results are presented here. These systems<br />
performed as expected.<br />
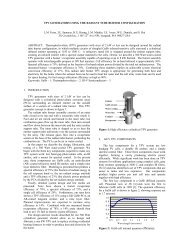
3-SUN MIRROR MODULE CONCEPT<br />
The cost of high purity silicon feedstock today is well<br />
over $50 / kg whereas the cost of aluminum is only about<br />
$2 / kg. Crystal growth adds more cost to the silicon solar<br />
cells. Therefore, substituting aluminum mirrors for single<br />
crystal cell area can dramatically reduce the cost of a<br />
module. This reasoning leads us to the 3-sun module<br />
concept shown in figure 1.<br />
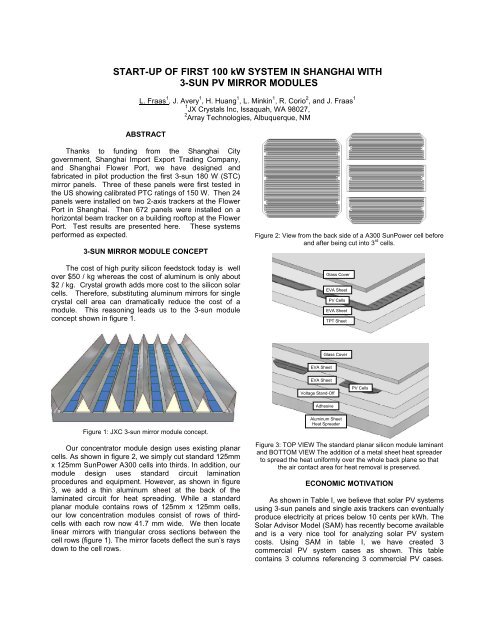
Figure 2: View from the back side of a A300 SunPower cell before<br />
and after being cut into 3 rd cells.<br />
Glass Cover<br />
EVA Sheet<br />
PV Cells<br />
EVA Sheet<br />
TPT Sheet<br />
Glass Cover<br />
EVA Sheet<br />
EVA Sheet<br />
Voltage Stand-Off<br />
PV Cells<br />
Adhesive<br />
Figure 1: <strong>JX</strong>C 3-sun mirror module concept.<br />
Our concentrator module design uses existing planar<br />
cells. As shown in figure 2, we simply cut standard 125mm<br />
x 125mm SunPower A300 cells into thirds. In addition, our<br />
module design uses standard circuit lamination<br />
procedures and equipment. However, as shown in figure<br />
3, we add a thin aluminum sheet at the back of the<br />
laminated circuit for heat spreading. While a standard<br />
planar module contains rows of 125mm x 125mm cells,<br />
our low concentration modules consist of rows of thirdcells<br />
with each row now 41.7 mm wide. We then locate<br />
linear mirrors with triangular cross sections between the<br />
cell rows (figure 1). The mirror facets deflect the sun’s rays<br />
down to the cell rows.<br />
Aluminum Sheet<br />
Heat Spreader<br />
Figure 3: TOP VIEW The standard planar silicon module laminant<br />
and BOTTOM VIEW The addition of a metal sheet heat spreader<br />
to spread the heat uniformly over the whole back plane so that<br />
the air contact area for heat removal is preserved.<br />
ECONOMIC MOTIVATION<br />
As shown in Table I, we believe that solar PV systems<br />
using 3-sun panels and single axis trackers can eventually<br />
produce electricity at prices below 10 cents per <strong>kW</strong>h. The<br />
Solar Advisor Model (SAM) has recently become available<br />
and is a very nice tool for analyzing solar PV system<br />
costs. Using SAM in table I, we have created 3<br />
commercial PV system cases as shown. This table<br />
contains 3 columns referencing 3 commercial PV cases.
The left-most column represents the SAM initial<br />
commercial baseline case for Phoenix assuming no<br />
tracking and today’s planar silicon panels. Looking at the<br />
middle column, if we simply mount panels on a low profile<br />
I-axis tracker instead of placing them fixed on the roof, the<br />
<strong>kW</strong>h / <strong>kW</strong> increases by 2409/1820=1.32 with an<br />
immediate reduction in LCOE from 16 to 12 cents per<br />
<strong>kW</strong>h. A further reduction in the LCOE can come by<br />
reducing the panel cost and increasing its efficiency. This<br />
can be done with our 3-sun mirror modules and higher<br />
efficiency silicon cells.<br />
For our 3-sun panels, we note that our intrinsic<br />
advantage is that mirrors are much cheaper than cells.<br />
Thus, if the real cost of cells is about $2.10 per W at 1<br />
sun, at 3-suns we should save about $1.40 per W. If<br />
mirrors cost $0.40 per W, we should save $1 per W over<br />
standard 1-sun panels. So, our panel cost in table 1<br />
relative to the left baseline column should then be $2.50 /<br />
W if our panel efficiency were the same. However, using<br />
SunPower 22% cells in the future should allow an increase<br />
in panel efficiency from 13.5% to 18% with a resultant<br />
reduction in panel per W cost to (13.5/18)x$2.5/W = $1.88<br />
/ W. So our assumption for the 3-sun panel cost for 2010<br />
in table 1 of $2/W is conservative. Our problem today is<br />
that we are in low volume production and we are paying<br />
retail prices for 19% efficient cells.<br />
Table I: SAM Commercial System Inputs and Results<br />
Parameter<br />
Commercial<br />
Flat Plate<br />
System 2006<br />
Commercial<br />
3-sun with<br />
carousel<br />
tracker 2007<br />
Commercial<br />
3-sun with<br />
carousel<br />
tracker 2010<br />
No Changes<br />
System Size 150 <strong>kW</strong> 150 <strong>kW</strong> 150 <strong>kW</strong><br />
Panel dimensions 1.5 m x 0.8 m 1.5 m x 0.8 m 1.5 m x 0.8 m<br />
O&M costs $6,365 / yr $6,365 / yr $6,365 / yr<br />
Evolutionary<br />
Change<br />
Inverter Cost $90,000<br />
$0.60 / W<br />
$90,000<br />
$0.60 / W<br />
$75,000<br />
$0.50 / W<br />
Installation<br />
$0.55 / W<br />
$82,500<br />
$0.55 / W<br />
$82,500<br />
$0.50 / W<br />
$75,000<br />
Changes via TIOs<br />
Panel Efficiency 13.5% 13.5% 18%<br />
# Panels Required <strong>100</strong>0 <strong>100</strong>0 750<br />
Panel Cost $525<br />
$3.50 / W<br />
$525<br />
$3.50 / W<br />
$400<br />
$2 / W<br />
Tracking<br />
BOS<br />
Indirect (32%<br />
margin over panel<br />
cost)<br />
Fixed<br />
$0.54 / W<br />
$81,000<br />
$1.10 / W<br />
$165,000<br />
1-axis<br />
$0.75 / W<br />
$112,000<br />
$1.10 / W<br />
$165,000<br />
1-axis<br />
$0.50 / W<br />
$75,000<br />
$0.64 / W<br />
$96,000<br />
Results<br />
System Cost $943.5k $975k $621k<br />
Installed Cost / W $6.29 / W $6.50 / W $4.14 / W<br />
LCOE cts/<strong>kW</strong>h 15.93 cts 12.43 cts 8.3 cts<br />
<strong>kW</strong>h / <strong>kW</strong> Phoenix 1,820 2,409 2,409<br />
<strong>SHANGHAI</strong> PROJECT HISTORY<br />
We are grateful to our Shanghai colleagues for<br />
funding this project. This project has taken place in 3<br />
phases over a 2 year period. In the 1 st phase, we<br />
designed the 3-sun panels, fabricated the first 20, and<br />
tested them under calibrated conditions. In the 2nd<br />
phase, we set up 2 post-mounted 2-axis tracking systems<br />
each with 12 of our 3-sun panels. Finally, 3 rd , we built the<br />
roof mounted <strong>100</strong> <strong>kW</strong> system. The results of these 3<br />
activities are described in the following sections.<br />
CALIBRATED PANEL MEASUREMENTS<br />
We fabricated twenty 3-sun modules in a first<br />
experimental pilot production run. Two of these first<br />
modules were then sent to Array Technologies in<br />
Albuquerque NM for outdoor testing. As shown in figure 4,<br />
these 2 modules were mounted along with a Sharp 175 W<br />
planar module on a 2-axis tracker. All three modules were<br />
tested and produced very similar amounts of power as<br />
shown in table II. Figure 5 shows the power outputs for the<br />
modules in Figure 4 throughout the day.<br />
Watts<br />
Figure 4: Two <strong>JX</strong>C 3s-180 modules and one Sharp 175 W<br />
module on 2-axis tracker in Albuquerque NM.<br />
Table Ii: Test results for modules shown in figure 4.<br />
3-Sun # 10 3-Sun # 7 Sharp 175<br />
Voc 44.51 45.25 39.95<br />
Isc 5.75 5.74 6.11<br />
FF 0.66 0.66 0.67<br />
Vmax 33.82 34.39 30.36<br />
Imax 4.98 4.98 5.35<br />
Pmax,<br />
watts 168 171 163<br />
Test conditions: 1.1 suns, 21oC, 12:48 pm,<br />
8 Feb. 2006, Albuquerque NM<br />
at Array Technologies.<br />
200<br />
180<br />
160<br />
140<br />
120<br />
<strong>100</strong><br />
80<br />
3Sun-010<br />
60<br />
3Sun-007<br />
40<br />
Sharp175<br />
20<br />
0<br />
6 7 8 9 10 11 12 13 14 15 16 17 18<br />
Time of Day<br />
Figure 5: Power outputs for 3-sun #10 and #7 vs Sharp 175 on<br />
2/10/2006 in Albuquerque.
A 3-sun panel was also sent to NREL for calibration<br />
measurements. The results are shown in Table III. All of<br />
these measurements are consistent with a PTC 3-sun<br />
panel rating of 150 W.<br />
Table III: NREL PV Standardized Module Performance Test<br />
Report #2K1720 <strong>JX</strong> <strong>Crystals</strong> Low Concentration Module (Area =<br />
1.268 m2).<br />
11/22/06<br />
LACSS<br />
Spectrolab X200<br />
11/8/06<br />
Direct Normal<br />
Outdoor<br />
1079 W/m2<br />
11/8/06<br />
Normalized &<br />
Spectrally<br />
Corrected<br />
11/15/06<br />
Direct Normal<br />
Outdoor<br />
1081 W/m2<br />
11/15/06<br />
Normalized &<br />
Spectrally<br />
Corrected<br />
Temp<br />
( o C)<br />
Voc<br />
(V)<br />
Isc<br />
(A)<br />
FF<br />
(%)<br />
Pmax<br />
(W)<br />
22.9 24.5 9.1 67.6 150.5<br />
32.6 23.6 10.6 65.8<br />
32.6 9.9 153.7<br />
28.9 23.9 10.6 61.9<br />
28.9 9.8 145.6<br />
POST-MOUNTED 2-AXIS TRACKERS<br />
We then supplied twenty-four 3-sun panels for<br />
mounting on 2 Array Technologies post mounted AZ225 2-<br />
axis trackers and these were installed at the Shanghai<br />
Flower Park as shown in figure 6. A SMA inverter was<br />
mounted on each post.<br />
Pdc (<strong>kW</strong>)<br />
2<br />
1.75<br />
1.5<br />
1.25<br />
1<br />
0.75<br />
0.5<br />
0.25<br />
2<strong>kW</strong> Array 7/29/06<br />
West Array<br />
0<br />
5 6 7 8 9 10 11 12 13 14 15 16 17 18 19<br />
Time of Day<br />
Figure 7: Power output over a day for one of the 2 <strong>kW</strong> (STC)<br />
arrays.<br />
RO<strong>OF</strong>-MOUNTED <strong>100</strong> <strong>kW</strong> <strong>SYSTEM</strong><br />
Our customer’s goal from the beginning was to mount<br />
solar panels on the roof of a utility building at the Flower<br />
Port in order to provide electric power for green houses to<br />
keep them cool in the summer and warm in the winter. So<br />
we designed a low profile horizontal beam tracking 2-sun<br />
system. The building block is a 25 <strong>kW</strong> array as shown in<br />
figure 8. It consists of 7 beams oriented in the North-<br />
South direction driven by a motor and one central drive<br />
beam. There are twenty-four 3-sun panels astride each<br />
beam.<br />
The system we designed and built is a nominal <strong>100</strong><br />
<strong>kW</strong> (PTC) system consisting of four of these building<br />
blocks. It therefore contains 4x7x24= 672 panels.<br />
Figure 6: <strong>JX</strong> <strong>Crystals</strong> Inc 4 <strong>kW</strong> installation in Shanghai.<br />
We refer to this system as a 4 <strong>kW</strong> system but this is<br />
based on the STC panel rating of 180 W. However,<br />
based on the PCT rating of 150 W, we would expect 12 x<br />
150 W = 1.8 <strong>kW</strong> for each array. This is consistent with the<br />
power produced from an array as shown in figure 7. The<br />
peak power shown of 1.74 <strong>kW</strong> is consistent with the sun<br />
reading on that day of 0.97 suns (0.97x1.8 <strong>kW</strong> = 1.75 <strong>kW</strong>).<br />
Figure 8: Design drawing for 25 <strong>kW</strong> horizontal beam tracked array<br />
consisting of 7 beams, each with 24 3-sun panels, and one drive<br />
motor and drive beam.<br />
We actually made 750 3-sun panels and we were<br />
pleasantly surprised at the good yields and steadily<br />
improving performance as shown in the yield bar graph<br />
presented in figure 9. We used the NREL calibrated 3-<br />
sun panel as a reference panel for these flash test STC<br />
measurements.<br />
Figures 10 & 11 then show photos of the completed<br />
roof mounted <strong>100</strong> <strong>kW</strong> array.
Figure 9: STC Flash test 3-sun panel power yields for 750 panels<br />
with average at 190 W and high of 205 W.<br />
Figure 11: Close-up photos of 3-sun panels and tracker.<br />
Figure 10: Photograph of <strong>100</strong> <strong>kW</strong> 3-sun array.<br />
The installation of this system was completed in the<br />
middle of November of 2006. A SMA Sunny Central<br />
inverter was used along with string monitors to read the<br />
outputs from each of the 28 strings corresponding with the<br />
28 beams. Its performance is documented in figure 12<br />
where the current for one of the typical 28 strings is shown<br />
along with the system output voltage over a day in<br />
November. The system performance is as expected.<br />
Since the sun is at 50 degrees off normal toward the<br />
South in the winter time for this horizontal beam system,<br />
the current reading of 5 Amps per string needs to be<br />
divided by cos(50)= 0.64 to predict peak summer time<br />
operation. From this data, the system peak AC power in<br />
the summer should then be (5x28 / 0.64 A) x 430 V = 94<br />
<strong>kW</strong>. Given an inverter efficiency of 94%, this then equates<br />
to <strong>100</strong> <strong>kW</strong> (PTC) and this is consistent with 672 x 150 W =<br />
<strong>100</strong>.8 <strong>kW</strong>.<br />
CONCLUSIONS<br />
Thanks to funding from a launch customer in<br />
Shanghai, China, we have designed, built, and<br />
characterized 3-sun panels with an STC rating of 180 W<br />
and a PTC rating of 150 W. We then built in a first<br />
production run these panels for installation in two<br />
demonstration systems at the Shanghai Flower Port.<br />
These systems are performing and operating as per<br />
expectation.<br />
Idc (amps)<br />
6<br />
5<br />
4<br />
3<br />
2<br />
1<br />
0<br />
Vpv (dc volts)<br />
<strong>100</strong><strong>kW</strong> String Current 11/8/06<br />
5 6 7 8 9 10 11 12 13 14 15 16 17 18 19<br />
Time of Day<br />
500<br />
450<br />
400<br />
350<br />
300<br />
250<br />
200<br />
150<br />
<strong>100</strong><br />
50<br />
0<br />
5 6 7 8 9 10 11 12 13 14 15 16 17 18 19<br />
Time of Day<br />
Figure 12: Typical string current and system voltage for<br />
<strong>100</strong> <strong>kW</strong> (PTC) 3-sun system in winter of 2006.