Statistical Estimation and Tracking of Refractivity from Radar Clutter
Statistical Estimation and Tracking of Refractivity from Radar Clutter
Statistical Estimation and Tracking of Refractivity from Radar Clutter

Create successful ePaper yourself
Turn your PDF publications into a flip-book with our unique Google optimized e-Paper software.
9<br />
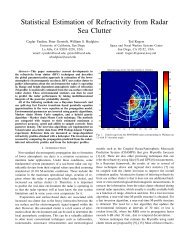
tally alter the propagation characteristics, the coverage area, <strong>and</strong> hence almost all<br />
<strong>of</strong> the important radar parameters as shown in Fig. 1.3.<br />
The M-pr<strong>of</strong>ile structure seen in Fig. 1.3 (a) is a weak evaporation duct.<br />
Notice how the value <strong>of</strong> M increases at a rate <strong>of</strong> 0.118 M-units/m except for the<br />
evaporative region near the surface. Since the evaporation duct is very weak it<br />
does not affect the propagation as seen <strong>from</strong> its coverage diagram obtained using<br />
the split-step fast Fourier transform (FFT) parabolic equation (PE). The upward<br />
bending effect <strong>of</strong> the normal propagation conditions can be seen clearly. Since the<br />
signal is bend upward, it has minimal interaction with the sea surface resulting<br />
in a clear clutter map, defined as the clutter observed on the radar plan position<br />
indicator (PPI).<br />
150<br />
(a)<br />
-110<br />
150<br />
(b)<br />
-110<br />
100<br />
-130<br />
100<br />
-130<br />
50<br />
50<br />
-150<br />
300 350 20 60 100 140<br />
<strong>Refractivity</strong> (M-unit/m) Range (km)<br />
Reflectivity image: March 11, 1998 Map # 031198-20 15:52:33.3<br />
-250<br />
-150<br />
300 350 20 60 100 140<br />
<strong>Refractivity</strong> (M-unit/m) Range (km)<br />
Reflectivity image: April 02, 1998 Map # 040298-17 18:50:00.3<br />
40 -250<br />
40<br />
-200<br />
35 -200<br />
35<br />
-150<br />
-100<br />
-50<br />
-150<br />
30<br />
-100<br />
25<br />
-50<br />
30<br />
25<br />
0<br />
50<br />
100<br />
150<br />
50 km<br />
100 km<br />
150 km<br />
200 km<br />
20 0<br />
50<br />
15<br />
100<br />
10<br />
150<br />
50 km<br />
100 km<br />
150 km<br />
200 km<br />
20<br />
15<br />
10<br />
200<br />
5<br />
200<br />
5<br />
250<br />
-200 -100 0 100 200<br />
0<br />
250<br />
-200 -100 0 100 200<br />
0<br />
Figure 1.3: Vertical M-pr<strong>of</strong>iles, coverage diagrams, <strong>and</strong> clutter maps resulting <strong>from</strong><br />
(a) a weak evaporation duct <strong>and</strong> (b) a strong surface-based duct.