How to interpret the Fund Fact Sheet report - Fi360
How to interpret the Fund Fact Sheet report - Fi360
How to interpret the Fund Fact Sheet report - Fi360

Create successful ePaper yourself
Turn your PDF publications into a flip-book with our unique Google optimized e-Paper software.
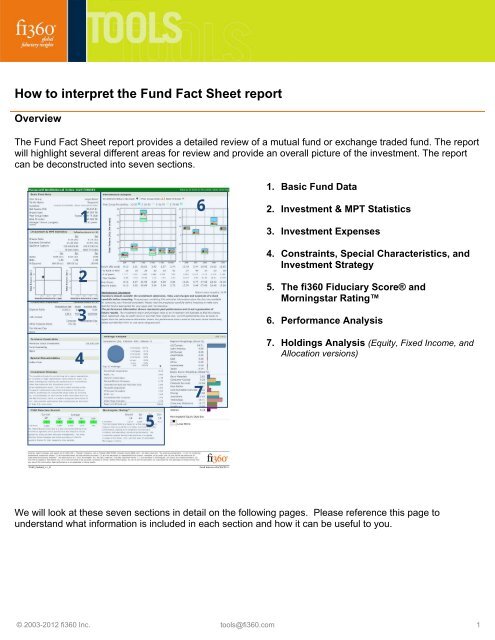
<strong>How</strong> <strong>to</strong> <strong>interpret</strong> <strong>the</strong> <strong>Fund</strong> <strong>Fact</strong> <strong>Sheet</strong> <strong>report</strong><br />
Overview<br />
The <strong>Fund</strong> <strong>Fact</strong> <strong>Sheet</strong> <strong>report</strong> provides a detailed review of a mutual fund or exchange traded fund. The <strong>report</strong><br />
will highlight several different areas for review and provide an overall picture of <strong>the</strong> investment. The <strong>report</strong><br />
can be deconstructed in<strong>to</strong> seven sections.<br />
1<br />
2<br />
3<br />
4<br />
6<br />
7<br />
1. Basic <strong>Fund</strong> Data<br />
2. Investment & MPT Statistics<br />
3. Investment Expenses<br />
4. Constraints, Special Characteristics, and<br />
Investment Strategy<br />
5. The fi360 Fiduciary Score® and<br />
Morningstar Rating<br />
6. Performance Analysis<br />
7. Holdings Analysis (Equity, Fixed Income, and<br />
Allocation versions)<br />
5<br />
We will look at <strong>the</strong>se seven sections in detail on <strong>the</strong> following pages. Please reference this page <strong>to</strong><br />
understand what information is included in each section and how it can be useful <strong>to</strong> you.<br />
© 2003-2012 fi360 Inc. <strong>to</strong>ols@fi360.com 1
Basic <strong>Fund</strong> Data<br />
A<br />
B<br />
C<br />
D<br />
E<br />
F<br />
G<br />
H<br />
I<br />
A. Peer Group – The group of investments, assigned by Morningstar that has <strong>the</strong> most similar investment style<br />
among all of <strong>the</strong> investments in <strong>the</strong> data universe. Peer groups are also known as <strong>the</strong> Morningstar Category TM .<br />
B. Family Name – The name of <strong>the</strong> firm that manages <strong>the</strong> investment.<br />
C. Inception – The date on which <strong>the</strong> investment began its operations. Investments with long track records offer<br />
more his<strong>to</strong>ry by which inves<strong>to</strong>rs can assess overall investment performance. <strong>How</strong>ever, ano<strong>the</strong>r important fac<strong>to</strong>r <strong>to</strong><br />
consider is <strong>the</strong> portfolio manager and his or her tenure with <strong>the</strong> investment. The product inception date is<br />
representative of <strong>the</strong> oldest share class for this investment, while <strong>the</strong> share class inception date refers <strong>to</strong> <strong>the</strong><br />
investment in <strong>the</strong> <strong>report</strong>.<br />
D. Net Assets ($Mil) – The month-end net assets of <strong>the</strong> investment, recorded in millions of dollars. Assets are<br />
<strong>to</strong>taled across all share classes of a mutual fund. Net-asset figures are useful in gauging an investments size,<br />
agility, and popularity. They help determine whe<strong>the</strong>r a small company investment, for example, can remain in its<br />
investment-objective category if its asset base reaches an ungainly size.<br />
E. Broad Index – The index used in <strong>the</strong> calculation of metrics such as Alpha, Beta and R2. In addition, <strong>the</strong>se<br />
broad indexes provide a common comparison point for investments with similar investing styles across different<br />
peer groups. *<br />
F. Peer Group Index – The index assigned <strong>to</strong> <strong>the</strong> investment’s peer group. Each peer group has its own index<br />
which can be used as a common comparison point between funds.<br />
F. Best Fit Index –The market index that shows <strong>the</strong> highest correlation with a fund over <strong>the</strong> most-recent 36<br />
months, as measured by <strong>the</strong> highest R-squared. In addition, <strong>the</strong> best-fit index can be used <strong>to</strong> compare <strong>the</strong> betas<br />
and alphas of similar funds that show <strong>the</strong> same best-fit index. Morningstar recalculates <strong>the</strong> best-fit index in-house<br />
on a monthly basis.<br />
H. Manager Tenure (Longest) – The number of years that <strong>the</strong> current manager has been managing <strong>the</strong><br />
investment. In <strong>the</strong> case of a team structure, <strong>the</strong> senior most managers’ tenure is shown. A manager with a long<br />
tenure will be more directly attributable <strong>to</strong> <strong>the</strong> overall performance of <strong>the</strong> portfolio than a manager who was hired<br />
recently.<br />
I. Manager Name – The name of <strong>the</strong> portfolio manager or portfolio management team.<br />
* See appendix.<br />
© 2003-2012 fi360 Inc. <strong>to</strong>ols@fi360.com 2
Investment and MPT Statistics<br />
A<br />
B<br />
C<br />
D<br />
E<br />
F<br />
G<br />
A. Sharpe Ratio – – A risk-adjusted measure developed by Nobel Laureate William Sharpe. The higher <strong>the</strong> Sharpe<br />
ratio, <strong>the</strong> better <strong>the</strong> investments his<strong>to</strong>rical risk-adjusted performance. The Sharpe ratio is calculated for <strong>the</strong> past 3<br />
or 5 year period by dividing <strong>the</strong> investments annualized excess return by <strong>the</strong> standard deviation of an investments<br />
annualized excess return. Since this ratio uses standard deviation as its risk measure, it is most appropriately<br />
applied when analyzing an investment that is an inves<strong>to</strong>r's sole holding. The Sharpe ratio can be used <strong>to</strong><br />
compare two investments directly on how much risk an investment had <strong>to</strong> bear <strong>to</strong> earn excess return over <strong>the</strong><br />
risk-free rate.<br />
B. Standard Deviation – A statistical measurement of dispersion about an average, which, for an investment,<br />
depicts how widely <strong>the</strong> returns varied over a certain period of time. Inves<strong>to</strong>rs use <strong>the</strong> standard deviation of<br />
his<strong>to</strong>rical performance <strong>to</strong> try <strong>to</strong> predict <strong>the</strong> range of returns that are most likely for a given investment. When an<br />
investment has a high standard deviation, <strong>the</strong> predicted range of performance is wide, implying greater volatility. If<br />
<strong>the</strong> investment is <strong>the</strong> only holding in an inves<strong>to</strong>r’s portfolio, <strong>the</strong>n it is an appropriate measure of risk. The figure<br />
cannot be easily calculated for more than one investment because <strong>the</strong> standard deviation for a portfolio of<br />
multiple investments is a function of not only <strong>the</strong> individual standard deviations, but also of <strong>the</strong> degree of<br />
correlation among <strong>the</strong> investments returns. If an investment’s returns follow a normal distribution, <strong>the</strong>n<br />
approximately 68 percent of <strong>the</strong> time <strong>the</strong>y will fall within one standard deviation of <strong>the</strong> mean return for <strong>the</strong><br />
investment, and 95 percent of <strong>the</strong> time within two standard deviations. Morningstar computes standard deviation<br />
using <strong>the</strong> trailing monthly <strong>to</strong>tal returns for <strong>the</strong> appropriate time period. All of <strong>the</strong> monthly standard deviations are<br />
<strong>the</strong>n annualized.<br />
© 2003-2012 fi360 Inc. <strong>to</strong>ols@fi360.com 3
Investment and MPT Statistics (continued)<br />
C. Up/Down Capture – Upside(Downside) Capture Ratio measures a manager's performance in up(down) markets<br />
relative <strong>to</strong> <strong>the</strong> market (benchmark) itself. It is calculated by taking <strong>the</strong> security’s upside(downside) capture return<br />
and dividing it by <strong>the</strong> benchmark’s upside(downside) capture return. A number equal <strong>to</strong> 100 indicates that <strong>the</strong><br />
security fully captured <strong>the</strong> return of <strong>the</strong> market (benchmark) for <strong>the</strong> period. All s<strong>to</strong>ck funds' upside and downside<br />
capture ratios are calculated versus <strong>the</strong> S&P 500, whereas bond and international funds' ratios are calculated<br />
relative <strong>to</strong> <strong>the</strong> Barclays Capital U.S. Aggregate Bond Index and MSCI EAFE Index, respectively.<br />
D. Alpha – A measure of <strong>the</strong> difference between an investments actual returns and its expected performance, given<br />
its level of risk as measured by beta. A positive alpha figure indicates <strong>the</strong> investment has performed better than<br />
its beta (or expected return) would predict. In contrast, a negative alpha indicates <strong>the</strong> investment underperformed,<br />
given <strong>the</strong> expectations established by <strong>the</strong> investment's beta. All MPT statistics (alpha, beta, and R-squared) are<br />
based on a least-squared regression of <strong>the</strong> investments return over Treasury bills (called excess return) and <strong>the</strong><br />
excess returns of <strong>the</strong> investments benchmark index.*<br />
E. Beta – A measure of a fund's sensitivity <strong>to</strong> market movements. The beta of <strong>the</strong> market is 1.00 by definition.<br />
Morningstar calculates beta by comparing a fund's excess return over Treasury bills <strong>to</strong> <strong>the</strong> market's excess return<br />
over Treasury bills. A beta of 1.10 shows that <strong>the</strong> fund has performed 10% better than its benchmark index* in<br />
up markets and 10% worse in down markets, assuming all o<strong>the</strong>r fac<strong>to</strong>rs remain constant. Conversely, whereas a<br />
beta of 0.85 indicates that <strong>the</strong> fund's excess return is expected <strong>to</strong> perform 15% worse than <strong>the</strong> market's excess<br />
return during up markets and 15% better during down markets.<br />
F. R-Squared – Reflects <strong>the</strong> percentage of an investment’s movements that can be explained by movements in its<br />
benchmark index.* An R-squared of 100 indicates that all movements of an investment can be explained by<br />
movements in <strong>the</strong> index. Thus, index funds that invest only in S&P 500 s<strong>to</strong>cks will have an R-squared very close<br />
<strong>to</strong> 100. Conversely, a low R-squared indicates that very few of <strong>the</strong> investments movements can be explained by<br />
movements in its benchmark index. An R-squared measure of 35, for example, means that only 35% of <strong>the</strong><br />
investments movements can be explained by movements in <strong>the</strong> benchmark index. R-squared can be used <strong>to</strong><br />
ascertain <strong>the</strong> significance of a particular beta. Generally, a higher R-squared will indicate a more reliable beta<br />
figure. If <strong>the</strong> R-squared is lower, <strong>the</strong>n <strong>the</strong> beta is less relevant <strong>to</strong> <strong>the</strong> investments performance.<br />
G. Risk/Return Chart – The charts help <strong>to</strong> visually review <strong>the</strong> relative reward (measured by investment return)<br />
received by an investment for <strong>the</strong> risk or volatility (measured by standard deviation) of <strong>the</strong> investment over a<br />
three or five year period. Relatively speaking, you would like <strong>to</strong> see <strong>the</strong> diamond fall in <strong>the</strong> upper left quadrant<br />
of <strong>the</strong> graph. This shows that <strong>the</strong> investment has lower volatility than <strong>the</strong> median manager in its peer group<br />
(represented by <strong>the</strong> vertical line) and has a higher return than <strong>the</strong> median manager in its peer group<br />
(represented by <strong>the</strong> horizontal line).<br />
* See appendix.<br />
© 2003-2012 fi360 Inc. <strong>to</strong>ols@fi360.com 4
Investment Expenses<br />
A B C<br />
D<br />
E<br />
F<br />
G<br />
H<br />
A. Prospectus Net Expense Ratio – The percentage of investment assets used <strong>to</strong> pay for operating expenses<br />
and management fees, including 12b-1 fees, administrative fees, and all o<strong>the</strong>r asset-based costs incurred by <strong>the</strong><br />
investment, except brokerage costs. <strong>Fund</strong> expenses are reflected in <strong>the</strong> fund's Net Asset Value. Sales charges<br />
are not included in <strong>the</strong> expense ratio. The expense ratio for fund of funds is <strong>the</strong> aggregate expense ratio defined<br />
as <strong>the</strong> sum of <strong>the</strong> wrap or sponsor fees plus <strong>the</strong> estimated weighted average of <strong>the</strong> underlying fund fees. An<br />
investments higher expense ratio will “drag” on <strong>the</strong> overall performance of <strong>the</strong> investment compared <strong>to</strong> peers with<br />
a lower expense ratio.<br />
B. Prospectus Gross Expense Ratio –The <strong>to</strong>tal gross expenses (net expenses with waivers added back in)<br />
divided by <strong>the</strong> investments average net assets. If it is not equal <strong>to</strong> <strong>the</strong> net expense ratio, <strong>the</strong> gross expense ratio<br />
portrays <strong>the</strong> investments expenses had <strong>the</strong> manager not waived a portion, or all, of its fees. Thus, <strong>to</strong> some<br />
degree, it is an indication of fee contracts. Some fee waivers have an expiration date; o<strong>the</strong>r waivers are in place<br />
indefinitely.<br />
C. Audited Net Expense Ratio - The percentage of fund assets paid for operating expenses and management fees,<br />
including 12b-1 fees, administrative fees, and all o<strong>the</strong>r asset-based costs incurred by <strong>the</strong> fund, except brokerage<br />
costs. <strong>Fund</strong> expenses are reflected in <strong>the</strong> fund’s NAV. This expense ratio is pulled directly from <strong>the</strong> fund's annual<br />
<strong>report</strong>. Sales charges are not included in <strong>the</strong> expense ratio. For fund of funds, <strong>the</strong> underlying fund expense<br />
ratios are not included in <strong>the</strong> expense ratio.<br />
D. 12b-1 Fee – Maximum annual charge deducted from investment assets <strong>to</strong> pay for distribution and marketing<br />
costs. Although usually shown as a percentage, this amount will occasionally be a flat figure. This information is<br />
taken directly from <strong>the</strong> investment prospectus, and includes distribution, service and o<strong>the</strong>r expenses incurred.<br />
Morningstar lists <strong>the</strong> maximum amount. Some 12b-1 fees are something of a hidden charge, because <strong>the</strong>y are<br />
taken out of <strong>the</strong> NAV. Morningstar breaks <strong>the</strong> 12b-1 amount out of <strong>the</strong> expense ratio so inves<strong>to</strong>rs know how much<br />
<strong>the</strong>y are paying.<br />
E. Front Load/Deferred Load – The front-end charge is a one-time deduction from a purchase made in<strong>to</strong> <strong>the</strong><br />
investment. The deferred load is a one-time charge paid at <strong>the</strong> time of <strong>the</strong> sale of <strong>the</strong> investment. The amount is<br />
relative <strong>to</strong> <strong>the</strong> amount of <strong>the</strong> investment, so that larger investments incur smaller rates of charge. The sales<br />
charge serves as a commission for <strong>the</strong> broker who sold <strong>the</strong> investment. Potential fees and sales charges are an<br />
important fac<strong>to</strong>r <strong>to</strong> consider before making an investment. The load compensates <strong>the</strong> broker or financial planner<br />
for <strong>the</strong> service of providing professional investment advice.<br />
© 2003-2012 fi360 Inc. <strong>to</strong>ols@fi360.com 5
Investment Expenses (continued)<br />
F. Turnover Ratio (1 year) – A measure of <strong>the</strong> investments trading activity computed by taking <strong>the</strong> lesser of<br />
purchases or sales (excluding all securities with maturities of less than one year) and dividing by average monthly<br />
net assets. A turnover ratio of 100% or more does not necessarily suggest that all securities in <strong>the</strong> portfolio have<br />
been traded. In practical terms, <strong>the</strong> resulting percentage loosely represents <strong>the</strong> percentage of <strong>the</strong> portfolio's<br />
holdings that have changed over <strong>the</strong> past year. A higher Turnover Ratio can indicate that higher trading costs<br />
may impact <strong>the</strong> performance of <strong>the</strong> investment.<br />
G. Redemption Fees – The redemption fee is an amount charged when money is withdrawn from <strong>the</strong> investment.<br />
This fee does not go back <strong>to</strong> <strong>the</strong> investment company, but ra<strong>the</strong>r in<strong>to</strong> <strong>the</strong> investment itself and thus does not<br />
represent a net cost <strong>to</strong> shareholders. Also, unlike contingent deferred sales charges, redemption fees typically<br />
operate only in short, specific time clauses, commonly 30, 180, or 365 days. <strong>How</strong>ever, some redemption fees<br />
exist for up <strong>to</strong> five years. Charges are not imposed after <strong>the</strong> stated time has passed. These fees are typically<br />
imposed <strong>to</strong> discourage market timers, whose quick movements in<strong>to</strong> and out of investment can be disruptive. The<br />
charge is normally imposed on <strong>the</strong> ending share value, appreciated or depreciated from <strong>the</strong> original value.<br />
H. Fee Waiver/ Cap – The elimination of all or part of an investments expense or <strong>the</strong> cap or maximum fee charged<br />
by <strong>the</strong> portfolio manager. Some fee waivers and caps have an expiration date; o<strong>the</strong>rs are in place indefinitely.<br />
Some investments adopt this practice at various times <strong>to</strong> make <strong>the</strong>ir returns more competitive.<br />
© 2003-2012 fi360 Inc. <strong>to</strong>ols@fi360.com 6
Purchase Constraints, Special Characteristics, and Investment Strategy<br />
A<br />
B<br />
C<br />
D<br />
A. Minimum Initial Investment – The smallest investment amount accepted for establishing a new investment in<br />
<strong>the</strong> fund. <strong>Fund</strong>s often charge a lower fee for larger initial investments and will have several share classes that<br />
provide an alternative initial investment.<br />
B. <strong>Fund</strong> Availability –<strong>Fund</strong>s will often limit or close investment in <strong>the</strong> fund if <strong>the</strong> portfolio size becomes difficult <strong>to</strong><br />
manage, especially if <strong>the</strong> strategy of <strong>the</strong> fund limits <strong>the</strong> investment options due <strong>to</strong> <strong>the</strong> size of <strong>the</strong> portfolio. Three<br />
options are displayed in this area: 1. Open – The investment is open <strong>to</strong> all new inves<strong>to</strong>rs. 2. Open – No New –<br />
The fund will not accept new inves<strong>to</strong>rs, but will still accept money from existing inves<strong>to</strong>rs. 3. Closed – The fund<br />
will not accept money from new or existing inves<strong>to</strong>rs.<br />
C. Special Characteristics – Unique characteristics of an investment that help <strong>to</strong> identify its investment approach.<br />
The following characteristics can be shown: 1. <strong>Fund</strong> of <strong>Fund</strong>s - A fund that specializes in buying shares in o<strong>the</strong>r<br />
mutual funds ra<strong>the</strong>r than individual securities. Quite often this type of fund is not discernible from its name alone,<br />
but ra<strong>the</strong>r through prospectus wording (i.e.: <strong>the</strong> fund’s charter). 2. Index - A fund that tracks a particular index and<br />
attempts <strong>to</strong> match returns. While an index typically has a much larger portfolio than a mutual fund, <strong>the</strong> fund’s<br />
management may study <strong>the</strong> index’s movements <strong>to</strong> develop a representative sampling, and match sec<strong>to</strong>rs<br />
proportionately. 3. Life Cycle -These funds are geared <strong>to</strong>ward inves<strong>to</strong>rs of a certain age or with a specific time<br />
horizon for investing. Typically <strong>the</strong>y are grouped <strong>to</strong>ge<strong>the</strong>r in sets (i.e. conservative, moderate, and aggressive<br />
portfolios). 4. Master Feeder - This structure consists of a "feeder" fund, which invests all of its assets in a<br />
"master" fund; <strong>the</strong> master fund, in turn, invests directly in a portfolio of securities. The individual securities listed<br />
in a feeder fund's portfolio are actually <strong>the</strong> investment holdings of <strong>the</strong> fund's corresponding master portfolio.<br />
Occasionally, this structure is referred <strong>to</strong> as "hub and spoke", which is a registered service mark of Signature<br />
Financial Group. 5. Non-Diversified <strong>Fund</strong>s - The inves<strong>to</strong>r should note that funds that invest more of <strong>the</strong>ir assets in<br />
a single issuer involve additional risks, including share price fluctuations, because of increased concentration of<br />
investments. 6. Socially Conscious - Any fund that invests according <strong>to</strong> non-economic guidelines. Such funds<br />
may make investments based on such issues as environmental responsibility, human rights, or religious views. A<br />
socially conscious fund may take a pro-active stance by selectively investing in, for example, environmentallyfriendly<br />
companies, or firms with good employee relations. This group also includes funds that avoid investing in<br />
companies involved in promoting alcohol, <strong>to</strong>bacco, or gambling, or in <strong>the</strong> defense industry.<br />
© 2003-2012 fi360 Inc. <strong>to</strong>ols@fi360.com 7
Purchase Constraints, Special Characteristics, and Investment Strategy (continued)<br />
D. Investment Strategy – A written three-paragraph summary of <strong>the</strong> Investment Objectives and Policy section<br />
found in every fund prospectus. It states <strong>the</strong> objective of <strong>the</strong> fund, and how <strong>the</strong> managers intend <strong>to</strong> invest <strong>to</strong><br />
achieve this objective. It includes any limitations as <strong>to</strong> <strong>the</strong> fund's investment policies, as well as any share class<br />
structure difference, previous names, merger, liquidation, and opening or closing information. This criteria is<br />
written for every fund in <strong>the</strong> Morningstar universe, and is pulled only from <strong>the</strong> fund prospectus.<br />
© 2003-2012 fi360 Inc. <strong>to</strong>ols@fi360.com 8
The fi360 Fiduciary Score® and Morningstar Rating<br />
fi360 Fiduciary Score – The fi360 Fiduciary Score® is a peer percentile ranking of an investment against a set of<br />
quantitative due diligence criteria selected <strong>to</strong> reflect prudent fiduciary management. For each investment with at<br />
least a three-year his<strong>to</strong>ry, fi360 calculates <strong>the</strong> fi360 Fiduciary Score based on <strong>the</strong> following due diligence criteria:<br />
regula<strong>to</strong>ry oversight, minimum track record, stability of <strong>the</strong> organization, assets in <strong>the</strong> investment, composition<br />
consistency with asset class, style consistency, expense ratio/fees relative <strong>to</strong> peers, risk-adjusted performance<br />
relative <strong>to</strong> peers, and performance relative <strong>to</strong> peers. Investments are evaluated at <strong>the</strong> conclusion of each<br />
calendar quarter. If an investment does not meet an individual due diligence criterion, points are awarded.<br />
Investments that satisfy all of <strong>the</strong> due diligence criteria receive a fi360 Fiduciary Score (Quarter) of 0. Every o<strong>the</strong>r<br />
investment is given a Score of 1-100 based on <strong>the</strong>ir point <strong>to</strong>tal, and representing <strong>the</strong>ir percentile ranking within<br />
<strong>the</strong>ir peer group. The fi360 Fiduciary Score (Average) is a one-, three-, five- or ten-year rolling average of an<br />
investment’s Quarter Score. The Average Score is also calculated on a quarterly basis. The fi360 Fiduciary Score<br />
represents a suggested course of action and is not intended, nor should it be used, as <strong>the</strong> sole source of<br />
information for reaching an investment decision. Visit fi360.com/fi360-Fiduciary-Score for <strong>the</strong> complete<br />
methodology document.<br />
Morningstar Rating – Morningstar rates mutual funds from 1 <strong>to</strong> 5 stars based on how well <strong>the</strong>y've performed (after<br />
adjusting for risk and accounting for sales charges) in comparison <strong>to</strong> similar funds. Within each Morningstar<br />
Category, <strong>the</strong> <strong>to</strong>p 10% of funds receive 5 stars and <strong>the</strong> bot<strong>to</strong>m 10% receive 1 star. <strong>Fund</strong>s are rated for up <strong>to</strong> three<br />
time periods-three-, five-, and 10-years and <strong>the</strong>se ratings are combined <strong>to</strong> produce an overall rating. <strong>Fund</strong>s with<br />
less than three years of his<strong>to</strong>ry are not rated. Ratings are objective, based entirely on a ma<strong>the</strong>matical evaluation<br />
of past performance. They're a useful <strong>to</strong>ol for identifying funds worthy of fur<strong>the</strong>r research, but shouldn't be<br />
considered buy or sell signals.<br />
© 2003-2012 fi360 Inc. <strong>to</strong>ols@fi360.com 9
Performance Analysis<br />
A<br />
B<br />
C<br />
D<br />
E<br />
F<br />
G<br />
A. Return (No Load)– Expressed in percentage terms, Morningstar's calculation of <strong>to</strong>tal return is determined each<br />
month by taking <strong>the</strong> change in monthly net asset value, reinvesting all income and capital-gains distributions<br />
during that month, and dividing by <strong>the</strong> starting NAV. Reinvestments are made using <strong>the</strong> actual reinvestment NAV,<br />
and daily payoffs are reinvested monthly. Unless o<strong>the</strong>rwise noted, Morningstar does not adjust <strong>to</strong>tal returns for<br />
sales charges (such as front-end loads, deferred loads and redemption fees), preferring <strong>to</strong> give a clearer picture<br />
of an investment's performance. The <strong>to</strong>tal returns do account for management, administrative, 12b-1 fees and<br />
o<strong>the</strong>r costs taken out of investment assets. Total returns for periods longer than one year are expressed in terms<br />
of compounded average annual returns (also known as geometric <strong>to</strong>tal returns), affording a more meaningful<br />
picture of investment performance than non-annualized figures.<br />
Return (With Load) - This return is adjusted for front-end loads, deferred loads and redemption fees, but not<br />
taxes. For funds with front-end loads, <strong>the</strong> full amount of <strong>the</strong> load is deducted. For deferred loads and redemption<br />
fees, <strong>the</strong> percentage charged often declines <strong>the</strong> longer <strong>the</strong> shares are held. Morningstar adjusts <strong>the</strong> deferred load<br />
for each time period accordingly when making this calculation.<br />
B. Calendar Year Returns – Total returns calculated on a calendar-year basis. The annual return for an investment<br />
will be <strong>the</strong> same as its trailing 1 year <strong>to</strong>tal return, only at year-end.<br />
C. % Rank in Peer – Percentile rank is a standardized way of ranking items within a peer group, in this case, funds<br />
within <strong>the</strong> same peer group. The investment with <strong>the</strong> largest return is ranked one; <strong>the</strong> investment with <strong>the</strong><br />
smallest return is ranked 100. The remaining investments are placed between 1 and 100 based on <strong>the</strong>ir value in<br />
relation <strong>to</strong> <strong>the</strong> o<strong>the</strong>r investments in <strong>the</strong> peer group.<br />
© 2003-2012 fi360 Inc. <strong>to</strong>ols@fi360.com 10
Performance Analysis (continued)<br />
D. # of Peers – The number of investments within a specific peer group for a particular data point such as 1-year<br />
return or Alpha. This number represents <strong>the</strong> <strong>to</strong>tal number of investments used <strong>to</strong> calculate <strong>the</strong> peer group<br />
rankings for each data point. The peer group sizes are helpful <strong>to</strong> determine if <strong>the</strong> investment research was<br />
created against a meaningful size of comparable peers.<br />
D. Peer Median – The median manager for a given data point is calculated by ranking <strong>the</strong> managers (investments)<br />
within a given peer group on a particular data point from best <strong>to</strong> worst. The manager that represents <strong>the</strong> 50th<br />
percentile of <strong>the</strong> ranking becomes <strong>the</strong> median manager for <strong>the</strong> group.<br />
E. Peer Group Index –The returns for <strong>the</strong> index assigned <strong>to</strong> <strong>the</strong> investment’s peer group. Each peer group has its<br />
own index which can be used as a common comparison point between funds.<br />
F. Best Fit Index –The returns for <strong>the</strong> market index that shows <strong>the</strong> highest correlation with a fund over <strong>the</strong> mostrecent<br />
36 months, as measured by <strong>the</strong> highest R-squared. In addition, <strong>the</strong> best-fit index can be used <strong>to</strong> compare<br />
<strong>the</strong> betas and alphas of similar funds that show <strong>the</strong> same best-fit index. Morningstar recalculates <strong>the</strong> best-fit index<br />
in-house on a monthly basis.<br />
© 2003-2012 fi360 Inc. <strong>to</strong>ols@fi360.com 11
Holdings Analysis<br />
The composition analysis section helps <strong>to</strong> identify <strong>the</strong><br />
percentage of fund assets invested in one of <strong>the</strong> six<br />
broad asset categories. This information can be used<br />
<strong>to</strong> determine if <strong>the</strong> investment allocation of <strong>the</strong> fund will<br />
complement o<strong>the</strong>r investments in a diversified portfolio<br />
of assets. Used in all fund fact sheets.<br />
The Morningstar Style Box is a nine-square grid that<br />
provides a graphical representation of <strong>the</strong> "investment<br />
style" of s<strong>to</strong>cks and mutual funds. For equity funds, it<br />
classifies securities according <strong>to</strong> market capitalization<br />
(<strong>the</strong> vertical axis) and growth and value fac<strong>to</strong>rs (<strong>the</strong><br />
horizontal axis). Fixed income funds are classified<br />
according <strong>to</strong> credit quality (<strong>the</strong> vertical axis) and<br />
sensitivity <strong>to</strong> changes in interest rates (<strong>the</strong> horizontal<br />
axis). Used in all fund fact sheets.<br />
The <strong>to</strong>p ten holdings section identifies <strong>the</strong> <strong>to</strong>p ten<br />
investments in <strong>the</strong> portfolio. This section can be used<br />
<strong>to</strong> identify <strong>the</strong> relative diversity of <strong>the</strong> holdings within<br />
<strong>the</strong> fund. It can also be used <strong>to</strong> help identify <strong>the</strong><br />
diversity of <strong>the</strong> client’s portfolio across funds. For<br />
example, if two funds in a client portfolio both hold a<br />
significant position in <strong>the</strong> same s<strong>to</strong>ck; <strong>the</strong> portfolio may<br />
not be as diversified as thought. Used in <strong>the</strong> equity and<br />
allocation fact sheets.<br />
The regional weighing section identifies <strong>the</strong> percentage<br />
of assets held in one of <strong>the</strong> eight labeled regions. This<br />
section can be used <strong>to</strong> identify <strong>the</strong> diversity of<br />
investments in <strong>the</strong> fund across countries and regions.<br />
Used in <strong>the</strong> equity and allocation fact sheets.<br />
© 2003-2012 fi360 Inc. <strong>to</strong>ols@fi360.com 12
Holdings Analysis(continued)<br />
The analysis reveals <strong>the</strong> percentage of fixed-income<br />
securities that fall within each credit-quality rating as<br />
assigned by Standard & Poor's or Moody's. At <strong>the</strong> <strong>to</strong>p<br />
of <strong>the</strong> ratings are U.S. government bonds. Bonds<br />
issued and backed by <strong>the</strong> federal government are of<br />
extremely high quality and thus are considered<br />
superior <strong>to</strong> bonds rated AAA, which is <strong>the</strong> highest<br />
possible rating a corporate issue can receive.<br />
Morningstar gives U.S. government bonds a credit<br />
rating separate from AAA securities <strong>to</strong> allow for a more<br />
accurate credit analysis of a portfolio's holdings. Used<br />
in <strong>the</strong> fixed income fact sheet.<br />
Sec<strong>to</strong>rs help inves<strong>to</strong>rs and investment professionals<br />
more easily compare and understand <strong>the</strong> sec<strong>to</strong>r<br />
exposures of mutual funds and portfolios. Sec<strong>to</strong>rs<br />
allow for intelligent diversification, and make it easier <strong>to</strong><br />
understand <strong>the</strong> decisions being made by portfolio<br />
managers.<br />
There are eleven sec<strong>to</strong>rs based on companies’<br />
economic sensitivity. Unlike some o<strong>the</strong>r sec<strong>to</strong>r<br />
classification systems, sec<strong>to</strong>rs aren't based on<br />
expected behavior of <strong>the</strong> s<strong>to</strong>cks of <strong>the</strong>se companies.<br />
Used in <strong>the</strong> equity fact sheet.<br />
Sec<strong>to</strong>rs help inves<strong>to</strong>rs and investment professionals<br />
more easily compare and understand <strong>the</strong> sec<strong>to</strong>r<br />
exposures of mutual funds and portfolios. Sec<strong>to</strong>rs<br />
allow for intelligent diversification, and make it easier <strong>to</strong><br />
understand <strong>the</strong> decisions being made by portfolio<br />
managers.<br />
There are twelve sec<strong>to</strong>rs based on <strong>the</strong> bonds’ issuer.<br />
This information can be used <strong>to</strong> identify <strong>the</strong> exposure<br />
of <strong>the</strong> investment <strong>to</strong> a particular credit instrument.<br />
Used in <strong>the</strong> fixed income fact sheet.<br />
© 2003-2012 fi360 Inc. <strong>to</strong>ols@fi360.com 13
Holdings Analysis (continued)<br />
Avg Effective Duration - A measure of a fund's<br />
interest-rate sensitivity--<strong>the</strong> longer a fund's duration,<br />
<strong>the</strong> more sensitive <strong>the</strong> fund is <strong>to</strong> shifts in interest rates.<br />
Duration is determined by a formula that includes<br />
coupon rates and bond maturities. Small coupons tend<br />
<strong>to</strong> increase duration, while shorter maturities and<br />
higher coupons shorten duration.<br />
Avg Effective Maturity - Average effective maturity is<br />
a weighted average of all <strong>the</strong> maturities of <strong>the</strong> bonds in<br />
a portfolio, computed by weighting each bond's<br />
effective maturity by <strong>the</strong> market value of <strong>the</strong> security.<br />
Average effective maturity takes in<strong>to</strong> consideration all<br />
mortgage prepayments, puts, and adjustable coupons.<br />
Longer-maturity funds are generally considered more<br />
interest-rate sensitive than <strong>the</strong>ir shorter counterparts.<br />
Avg Weighted Coupon - This figure is calculated by<br />
weighting each bond's coupon by its relative size in <strong>the</strong><br />
portfolio. It indicates whe<strong>the</strong>r <strong>the</strong> underlying fund owns<br />
more high- or low-coupon bonds.<br />
Yield To Maturity - The expected rate of return on a<br />
bond, if it is held until its maturity date.<br />
Used in <strong>the</strong> fixed income fact sheet.<br />
Appendix<br />
Morningstar uses a broad asset class index <strong>to</strong> calculate Alpha, Beta and R 2 , not <strong>the</strong> Peer Group Index noted in<br />
<strong>the</strong> <strong>report</strong>.<br />
Broad Asset Class Broad Asset Class Index<br />
U.S. S<strong>to</strong>ck<br />
S&P 500 TR<br />
International S<strong>to</strong>ck MSCI EAFE NR USD<br />
Municipal Bond BarCap Municipal TR USD<br />
Balanced<br />
Morningstar Moderate Target Risk<br />
Taxable Bond<br />
BarCap US Agg Bond TR USD<br />
Commodities<br />
Morningstar Long-Only Commodity TR<br />
Alternative<br />
ML USD LIBOR 3 Mon CM<br />
8.15.11<br />
© 2003-2012 fi360 Inc. <strong>to</strong>ols@fi360.com 14