404(a)(5) Participant Fee Disclosure - Fi360
404(a)(5) Participant Fee Disclosure - Fi360
404(a)(5) Participant Fee Disclosure - Fi360
Create successful ePaper yourself
Turn your PDF publications into a flip-book with our unique Google optimized e-Paper software.
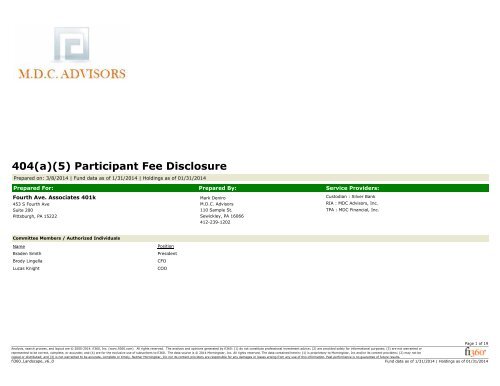
<strong>404</strong>(a)(5) <strong>Participant</strong> <strong>Fee</strong> <strong>Disclosure</strong><br />
Prepared on: 3/8/2014 | Fund data as of 1/31/2014 | Holdings as of 01/31/2014<br />
Prepared For: Prepared By: Service Providers:<br />
Fourth Ave. Associates 401k<br />
453 S Fourth Ave<br />
Suite 200<br />
Pittsburgh, PA 15222<br />
Mark Deniro<br />
M.D.C. Advisors<br />
110 Sample St.<br />
Sewickley, PA 16066<br />
412-239-1202<br />
Custodian : Silver Bank<br />
RIA : MDC Advisors, Inc.<br />
TPA : MDC Financial, Inc.<br />
Committee Members / Authorized Individuals<br />
Name<br />
Braden Smith<br />
Brody Lingella<br />
Lucas Knight<br />
Position<br />
President<br />
CFO<br />
COO<br />
Analysis, search process, and layout are © 2000-2014, fi360, Inc. (www.fi360.com). All rights reserved. The analysis and opinions generated by fi360: (1) do not constitute professional investment advice; (2) are provided solely for informational purposes; (3) are not warranted or<br />
represented to be correct, complete, or accurate; and (4) are for the exclusive use of subscribers to fi360. The data source is © 2014 Morningstar, Inc. All rights reserved. The data contained herein: (1) is proprietary to Morningstar, Inc and/or its content providers; (2) may not be<br />
copied or distributed; and (3) is not warranted to be accurate, complete or timely. Neither Morningstar, Inc nor its content providers are responsible for any damages or losses arising from any use of this information. Past performance is no guarantee of future results.<br />
fi360_Landscape_v6_0<br />
Fund data as of 1/31/2014 | Holdings as of 01/31/2014<br />
Page 1 of 19
Prepared for: Fourth Ave. Associates 401k<br />
<strong>Fee</strong>s Paid By Plan <strong>Participant</strong>s Plan Assets: $631,227.00 <strong>Participant</strong>s: 59<br />
This section will review the annual direct and indirect expenses charged against the Plan. Direct expenses will be paid from the plan's assets and deducted from individual plan<br />
accounts on a pro-rata basis. Indirect expenses are paid through the investments in which you invest. Each investment option may charge an expense ratio that can either be kept in<br />
full by the investment manager or used to compensate other service providers for services they provide to the plan.<br />
Compensation from Plan <strong>Participant</strong>s<br />
Direct fees paid to MDC Advisors, Inc. for RIA services<br />
+ Advisory <strong>Fee</strong>: 15.00 bps of plan assets assessed yearly.<br />
<strong>Fee</strong>s for investment advisory and other management services.<br />
Direct fees paid via the expense ratio to the investment manager<br />
+ Effective Mgmt <strong>Fee</strong>: 52.47 bps of plan assets assessed annually.<br />
Indirect revenue sharing paid via the expense ratio to MDC Advisors, Inc.<br />
+ 12b-1 Sales <strong>Fee</strong>: 5.18 bps of plan assets assessed annually.<br />
Indirect revenue sharing paid via the expense ratio to MDC Financial, Inc.<br />
+ Sub-TA <strong>Fee</strong>: 4.67 bps of plan assets assessed annually.<br />
+ Shareholder Service <strong>Fee</strong>: 1.99 bps of plan assets assessed annually.<br />
$947<br />
$3,312<br />
$327<br />
$295<br />
$126<br />
Net annual recurring fees $5,008<br />
0.79% of plan assets or approximately $7.93 per $1,000 invested<br />
Analysis, search process, and layout are © 2000-2014, fi360, Inc. (www.fi360.com). All rights reserved. The analysis and opinions generated by fi360: (1) do not constitute professional investment advice; (2) are provided solely for informational purposes; (3) are not warranted or<br />
represented to be correct, complete, or accurate; and (4) are for the exclusive use of subscribers to fi360. The data source is © 2014 Morningstar, Inc. All rights reserved. The data contained herein: (1) is proprietary to Morningstar, Inc and/or its content providers; (2) may not be<br />
copied or distributed; and (3) is not warranted to be accurate, complete or timely. Neither Morningstar, Inc nor its content providers are responsible for any damages or losses arising from any use of this information. Past performance is no guarantee of future results.<br />
fi360_Landscape_v6_0<br />
Fund data as of 1/31/2014 | Holdings as of 01/31/2014<br />
Page 2 of 19
<strong>Fee</strong>s Paid By Plan <strong>Participant</strong>s<br />
The following pie charts will illustrate the relative expense distribution of plan funded expenses.<br />
Prepared for: Fourth Ave. Associates 401k<br />
Direct fees paid from plan assets $947 18.9%<br />
<strong>Fee</strong>s paid through the investments $4,061 81.1%<br />
Total: $5,008 100.0%<br />
Investment Manager $3,312 66.1%<br />
MDC Advisors, Inc. $1,274 25.4%<br />
MDC Financial, Inc. $421 8.4%<br />
Total: $5,008 100.0%<br />
Analysis, search process, and layout are © 2000-2014, fi360, Inc. (www.fi360.com). All rights reserved. The analysis and opinions generated by fi360: (1) do not constitute professional investment advice; (2) are provided solely for informational purposes; (3) are not warranted or<br />
represented to be correct, complete, or accurate; and (4) are for the exclusive use of subscribers to fi360. The data source is © 2014 Morningstar, Inc. All rights reserved. The data contained herein: (1) is proprietary to Morningstar, Inc and/or its content providers; (2) may not be<br />
copied or distributed; and (3) is not warranted to be accurate, complete or timely. Neither Morningstar, Inc nor its content providers are responsible for any damages or losses arising from any use of this information. Past performance is no guarantee of future results.<br />
fi360_Landscape_v6_0<br />
Fund data as of 1/31/2014 | Holdings as of 01/31/2014<br />
Page 3 of 19
Plan Options: Performance and Expenses<br />
This document includes important information to help you compare the investment options under your retirement plan. If you want additional information about your investment options, you can go to the<br />
specific internet web site address shown next to each investment or you can contact us at the number shown on the cover page.<br />
Prepared for: Fourth Ave. Associates 401k<br />
Investors should consider the investment objectives, risks, and charges and expenses of a fund carefully before investing. Prospectuses containing this and other information about the fund are available by<br />
contacting your financial consultant. Please read the prospectus carefully before investing to make sure that the fund is appropriate for your goals and risk tolerance. The performance information shown<br />
represents past performance and is not a guarantee of future results. The investment return and principal value of an investment will fluctuate so that the shares, when redeemed, may be worth more or less<br />
than their original cost. The performance information shown reflects performance without adjusting for sales charges. If adjusted for sales charges, the load would reduce the performance quoted. Current<br />
performance may be lower or higher than the performance information shown. For performance data current to the most recent month-end, please reference the Investment Company Contact Information<br />
section.<br />
Your Investment Options<br />
Total Annualized Returns<br />
Large-Cap Equity<br />
Alpine Accelerating Dividend A (AAADX) | Alpine | Mutual Fund<br />
Your Share Class Inception: 12/30/2011<br />
Oldest Share Class Inception: 11/05/2008<br />
Return Benchmark: Russell 1000 TR USD<br />
Total Annual Investment Expenses<br />
1.60% - Expense ratio<br />
1.07% - Median peer expense ratio<br />
Charged $16.00 annually per $1000 invested<br />
Costs less than 22% of its 1,558 peers<br />
Vanguard 500 Index Admiral (VFIAX) | Vanguard | Mutual Fund<br />
Your Share Class Inception: 11/13/2000<br />
Oldest Share Class Inception: 08/31/1976<br />
Return Benchmark: Russell 1000 TR USD<br />
Total Annual Investment Expenses<br />
0.05% - Expense ratio<br />
1.07% - Median peer expense ratio<br />
Charged $0.50 annually per $1000 invested<br />
Costs less than 98% of its 1,558 peers<br />
1-Year 5-Year 10-Year<br />
19.30% - Investment return<br />
20.99% - Median peer return<br />
22.23% - Benchmark return<br />
Earned $193.00 per $1000 invested<br />
Outperformed 30% of its 1,454 peers<br />
Investment return since inception is 18.06% for your share class<br />
14.75% - Investment return<br />
18.22% - Median peer return<br />
19.84% - Benchmark return<br />
Earned $737.50 per $1000 invested<br />
Outperformed 6% of its 1,250 peers<br />
N/Av<br />
6.49% - Median peer return<br />
7.23% - Benchmark return<br />
Note: Any investment return shown in bold italics was calculated using extended performance data. The oldest share class return adjusted for your share class expense ratio is<br />
shown as a proxy.<br />
Shareholder-type expenses (If applicable)<br />
Contractual expense ratio cap of 1.60%. Expires on 2013-2-28. Gross expense ratio is 3.51%.<br />
21.46% - Investment return<br />
20.99% - Median peer return<br />
22.23% - Benchmark return<br />
Earned $214.60 per $1000 invested<br />
Outperformed 59% of its 1,454 peers<br />
Investment return since inception is 4.10% for your share class<br />
Shareholder-type expenses (If applicable)<br />
None<br />
Eaton Vance Large-Cap Growth A (EALCX) | Eaton Vance | Mutual Fund<br />
Your Share Class Inception: 09/09/2002<br />
Oldest Share Class Inception: 09/09/2002<br />
Return Benchmark: Russell 1000 Growth TR USD<br />
Total Annual Investment Expenses<br />
1.25% - Expense ratio<br />
1.14% - Median peer expense ratio<br />
Charged $12.50 annually per $1000 invested<br />
Costs less than 42% of its 1,592 peers<br />
26.10% - Investment return<br />
24.38% - Median peer return<br />
24.35% - Benchmark return<br />
Earned $261.00 per $1000 invested<br />
Outperformed 67% of its 1,569 peers<br />
Investment return since inception is 8.42% for your share class<br />
Shareholder-type expenses (If applicable)<br />
19.19% - Investment return<br />
18.22% - Median peer return<br />
19.84% - Benchmark return<br />
Earned $959.50 per $1000 invested<br />
Outperformed 74% of its 1,250 peers<br />
18.37% - Investment return<br />
19.46% - Median peer return<br />
20.88% - Benchmark return<br />
Earned $918.50 per $1000 invested<br />
Outperformed 31% of its 1,367 peers<br />
Contractual expense waiver of 0.13%. Expires on 2014-4-30. Gross expense ratio is 1.38%.<br />
6.82% - Investment return<br />
6.49% - Median peer return<br />
7.23% - Benchmark return<br />
Earned $682.00 per $1000 invested<br />
Outperformed 64% of its 1,010 peers<br />
7.16% - Investment return<br />
7.01% - Median peer return<br />
7.30% - Benchmark return<br />
Earned $716.00 per $1000 invested<br />
Outperformed 55% of its 1,176 peers<br />
www.alpinefunds.com<br />
www.vanguard.com<br />
www.eatonvance.com<br />
Analysis, search process, and layout are © 2000-2014, fi360, Inc. (www.fi360.com). All rights reserved. The analysis and opinions generated by fi360: (1) do not constitute professional investment advice; (2) are provided solely for informational purposes; (3) are not warranted or<br />
represented to be correct, complete, or accurate; and (4) are for the exclusive use of subscribers to fi360. The data source is © 2014 Morningstar, Inc. All rights reserved. The data contained herein: (1) is proprietary to Morningstar, Inc and/or its content providers; (2) may not be<br />
copied or distributed; and (3) is not warranted to be accurate, complete or timely. Neither Morningstar, Inc nor its content providers are responsible for any damages or losses arising from any use of this information. Past performance is no guarantee of future results.<br />
fi360_Landscape_v6_0<br />
Fund data as of 1/31/2014 | Holdings as of 01/31/2014<br />
Page 4 of 19
Plan Options: Performance and Expenses (Cont.)<br />
This document includes important information to help you compare the investment options under your retirement plan. If you want additional information about your investment options, you can go to the<br />
specific internet web site address shown next to each investment or you can contact us at the number shown on the cover page.<br />
Your Investment Options<br />
Total Annualized Returns<br />
Large-Cap Equity (Cont.)<br />
Vanguard Windsor II Adm (VWNAX) | Vanguard | Mutual Fund<br />
Your Share Class Inception: 05/14/2001<br />
Oldest Share Class Inception: 06/24/1985<br />
Return Benchmark: Russell 1000 Value TR USD<br />
Total Annual Investment Expenses<br />
0.27% - Expense ratio<br />
1.07% - Median peer expense ratio<br />
Charged $2.70 annually per $1000 invested<br />
Costs less than 96% of its 1,190 peers<br />
Mid-Cap Equity<br />
1-Year 5-Year 10-Year<br />
20.35% - Investment return<br />
19.53% - Median peer return<br />
20.02% - Benchmark return<br />
Earned $203.50 per $1000 invested<br />
Outperformed 60% of its 1,145 peers<br />
Investment return since inception is 6.02% for your share class<br />
Shareholder-type expenses (If applicable)<br />
None<br />
Columbia Mid Cap Index Z (NMPAX) | Columbia | Mutual Fund<br />
Your Share Class Inception: 03/31/2000<br />
Oldest Share Class Inception: 03/31/2000<br />
Return Benchmark: Russell Mid Cap TR USD<br />
Total Annual Investment Expenses<br />
0.21% - Expense ratio<br />
1.14% - Median peer expense ratio<br />
Charged $2.10 annually per $1000 invested<br />
Costs less than 93% of its 407 peers<br />
21.68% - Investment return<br />
22.76% - Median peer return<br />
23.68% - Benchmark return<br />
Earned $216.80 per $1000 invested<br />
Outperformed 41% of its 389 peers<br />
Investment return since inception is 8.45% for your share class<br />
Shareholder-type expenses (If applicable)<br />
T. Rowe Price Mid-Cap Growth (RPMGX) | T. Rowe Price | Mutual Fund<br />
Your Share Class Inception: 06/30/1992<br />
Oldest Share Class Inception: 06/30/1992<br />
Return Benchmark: Russell Mid Cap Growth TR<br />
USD<br />
Total Annual Investment Expenses<br />
0.80% - Expense ratio<br />
1.24% - Median peer expense ratio<br />
Charged $8.00 annually per $1000 invested<br />
Costs less than 88% of its 686 peers<br />
18.45% - Investment return<br />
17.62% - Median peer return<br />
18.69% - Benchmark return<br />
Earned $922.50 per $1000 invested<br />
Outperformed 69% of its 1,015 peers<br />
22.98% - Investment return<br />
21.65% - Median peer return<br />
23.77% - Benchmark return<br />
Earned $1,149.00 per $1000 invested<br />
Outperformed 68% of its 316 peers<br />
Contractual expense waiver of 0.21%. Expires on 2014-6-30. Gross expense ratio is 0.42%.<br />
28.52% - Investment return<br />
23.98% - Median peer return<br />
25.08% - Benchmark return<br />
Earned $285.20 per $1000 invested<br />
Outperformed 81% of its 663 peers<br />
Investment return since inception is 14.00% for your share class<br />
Shareholder-type expenses (If applicable)<br />
None<br />
24.31% - Investment return<br />
21.70% - Median peer return<br />
23.97% - Benchmark return<br />
Earned $1,215.50 per $1000 invested<br />
Outperformed 87% of its 610 peers<br />
Prepared for: Fourth Ave. Associates 401k<br />
7.32% - Investment return<br />
6.64% - Median peer return<br />
7.01% - Benchmark return<br />
Earned $732.00 per $1000 invested<br />
Outperformed 71% of its 836 peers<br />
9.77% - Investment return<br />
8.59% - Median peer return<br />
9.69% - Benchmark return<br />
Earned $977.00 per $1000 invested<br />
Outperformed 87% of its 245 peers<br />
www.vanguard.com<br />
www.columbiamanagement.com<br />
11.17% - Investment return<br />
8.97% - Median peer return<br />
9.17% - Benchmark return<br />
Earned $1,117.00 per $1000 invested<br />
Outperformed 95% of its 534 peers<br />
www.troweprice.com<br />
Analysis, search process, and layout are © 2000-2014, fi360, Inc. (www.fi360.com). All rights reserved. The analysis and opinions generated by fi360: (1) do not constitute professional investment advice; (2) are provided solely for informational purposes; (3) are not warranted or<br />
represented to be correct, complete, or accurate; and (4) are for the exclusive use of subscribers to fi360. The data source is © 2014 Morningstar, Inc. All rights reserved. The data contained herein: (1) is proprietary to Morningstar, Inc and/or its content providers; (2) may not be<br />
copied or distributed; and (3) is not warranted to be accurate, complete or timely. Neither Morningstar, Inc nor its content providers are responsible for any damages or losses arising from any use of this information. Past performance is no guarantee of future results.<br />
fi360_Landscape_v6_0<br />
Fund data as of 1/31/2014 | Holdings as of 01/31/2014<br />
Page 5 of 19
Plan Options: Performance and Expenses (Cont.)<br />
This document includes important information to help you compare the investment options under your retirement plan. If you want additional information about your investment options, you can go to the<br />
specific internet web site address shown next to each investment or you can contact us at the number shown on the cover page.<br />
Your Investment Options<br />
Total Annualized Returns<br />
Mid-Cap Equity (Cont.)<br />
Fidelity Advisor Mid Cap Value I (FMPOX) | Fidelity Investments | Mutual Fund<br />
Your Share Class Inception: 02/13/2007<br />
Oldest Share Class Inception: 11/15/2001<br />
Return Benchmark: Russell Mid Cap Value TR USD<br />
Total Annual Investment Expenses<br />
0.89% - Expense ratio<br />
1.23% - Median peer expense ratio<br />
Charged $8.90 annually per $1000 invested<br />
Costs less than 79% of its 403 peers<br />
1-Year 5-Year 10-Year<br />
23.98% - Investment return<br />
22.77% - Median peer return<br />
22.14% - Benchmark return<br />
Earned $239.80 per $1000 invested<br />
Outperformed 67% of its 388 peers<br />
Investment return since inception is 6.06% for your share class<br />
23.73% - Investment return<br />
21.63% - Median peer return<br />
23.41% - Benchmark return<br />
Earned $1,186.50 per $1000 invested<br />
Outperformed 80% of its 340 peers<br />
Prepared for: Fourth Ave. Associates 401k<br />
9.50% - Investment return<br />
8.78% - Median peer return<br />
9.78% - Benchmark return<br />
Earned $950.00 per $1000 invested<br />
Outperformed 77% of its 258 peers<br />
Note: Any investment return shown in bold italics was calculated using extended performance data. The oldest share class return adjusted for your share class expense ratio is<br />
shown as a proxy.<br />
Shareholder-type expenses (If applicable)<br />
None<br />
Perkins Mid Cap Value T (JMCVX) | Janus | Mutual Fund<br />
Your Share Class Inception: 08/12/1998<br />
Oldest Share Class Inception: 08/12/1998<br />
Return Benchmark: Russell Mid Cap Value TR USD<br />
Total Annual Investment Expenses<br />
0.77% - Expense ratio<br />
1.23% - Median peer expense ratio<br />
Charged $7.70 annually per $1000 invested<br />
Costs less than 87% of its 403 peers<br />
Small-Cap Equity<br />
14.98% - Investment return<br />
22.77% - Median peer return<br />
22.14% - Benchmark return<br />
Earned $149.80 per $1000 invested<br />
Outperformed 4% of its 388 peers<br />
Investment return since inception is 12.25% for your share class<br />
Shareholder-type expenses (If applicable)<br />
None<br />
Columbia Small Cap Index Z (NMSCX) | Columbia | Mutual Fund<br />
Your Share Class Inception: 10/15/1996<br />
Oldest Share Class Inception: 10/15/1996<br />
Return Benchmark: Russell 2000 TR USD<br />
Total Annual Investment Expenses<br />
0.23% - Expense ratio<br />
1.23% - Median peer expense ratio<br />
Charged $2.30 annually per $1000 invested<br />
Costs less than 96% of its 677 peers<br />
28.15% - Investment return<br />
25.38% - Median peer return<br />
27.03% - Benchmark return<br />
Earned $281.50 per $1000 invested<br />
Outperformed 77% of its 636 peers<br />
Investment return since inception is 9.59% for your share class<br />
Shareholder-type expenses (If applicable)<br />
None<br />
16.23% - Investment return<br />
21.63% - Median peer return<br />
23.41% - Benchmark return<br />
Earned $811.50 per $1000 invested<br />
Outperformed 3% of its 340 peers<br />
23.52% - Investment return<br />
21.99% - Median peer return<br />
22.26% - Benchmark return<br />
Earned $1,176.00 per $1000 invested<br />
Outperformed 75% of its 571 peers<br />
8.49% - Investment return<br />
8.78% - Median peer return<br />
9.78% - Benchmark return<br />
Earned $849.00 per $1000 invested<br />
Outperformed 40% of its 258 peers<br />
9.78% - Investment return<br />
8.23% - Median peer return<br />
8.31% - Benchmark return<br />
Earned $978.00 per $1000 invested<br />
Outperformed 83% of its 439 peers<br />
www.advisor.fidelity.com<br />
www.janus.com<br />
www.columbiamanagement.com<br />
Analysis, search process, and layout are © 2000-2014, fi360, Inc. (www.fi360.com). All rights reserved. The analysis and opinions generated by fi360: (1) do not constitute professional investment advice; (2) are provided solely for informational purposes; (3) are not warranted or<br />
represented to be correct, complete, or accurate; and (4) are for the exclusive use of subscribers to fi360. The data source is © 2014 Morningstar, Inc. All rights reserved. The data contained herein: (1) is proprietary to Morningstar, Inc and/or its content providers; (2) may not be<br />
copied or distributed; and (3) is not warranted to be accurate, complete or timely. Neither Morningstar, Inc nor its content providers are responsible for any damages or losses arising from any use of this information. Past performance is no guarantee of future results.<br />
fi360_Landscape_v6_0<br />
Fund data as of 1/31/2014 | Holdings as of 01/31/2014<br />
Page 6 of 19
Plan Options: Performance and Expenses (Cont.)<br />
This document includes important information to help you compare the investment options under your retirement plan. If you want additional information about your investment options, you can go to the<br />
specific internet web site address shown next to each investment or you can contact us at the number shown on the cover page.<br />
Your Investment Options<br />
Total Annualized Returns<br />
Small-Cap Equity (Cont.)<br />
Undiscovered Mgrs Behavioral Value Inst (UBVLX) | JPMorgan | Mutual Fund<br />
Your Share Class Inception: 12/28/1998<br />
Oldest Share Class Inception: 12/28/1998<br />
Return Benchmark: Russell 2000 Value TR USD<br />
Total Annual Investment Expenses<br />
1.04% - Expense ratio<br />
1.32% - Median peer expense ratio<br />
Charged $10.40 annually per $1000 invested<br />
Costs less than 74% of its 364 peers<br />
Developed International Equity<br />
1-Year 5-Year 10-Year<br />
26.21% - Investment return<br />
23.46% - Median peer return<br />
22.04% - Benchmark return<br />
Earned $262.10 per $1000 invested<br />
Outperformed 76% of its 349 peers<br />
Investment return since inception is 13.10% for your share class<br />
Shareholder-type expenses (If applicable)<br />
American Funds EuroPacific Gr R5 (RERFX) | American Funds | Mutual Fund<br />
Your Share Class Inception: 05/15/2002<br />
Oldest Share Class Inception: 04/16/1984<br />
Return Benchmark: MSCI ACWI Ex USA NR USD<br />
Total Annual Investment Expenses<br />
0.55% - Expense ratio<br />
1.22% - Median peer expense ratio<br />
Charged $5.50 annually per $1000 invested<br />
Costs less than 89% of its 763 peers<br />
29.02% - Investment return<br />
22.07% - Median peer return<br />
20.37% - Benchmark return<br />
Earned $1,451.00 per $1000 invested<br />
Outperformed 95% of its 294 peers<br />
Contractual expense waiver of 0.59%. Expires on 2015-1-1. Gross expense ratio is 1.63%.<br />
11.44% - Investment return<br />
10.03% - Median peer return<br />
5.75% - Benchmark return<br />
Earned $114.40 per $1000 invested<br />
Outperformed 69% of its 735 peers<br />
Investment return since inception is 8.54% for your share class<br />
Shareholder-type expenses (If applicable)<br />
None<br />
American Funds Capital World G/I R5 (RWIFX) | American Funds | Mutual Fund<br />
Your Share Class Inception: 05/15/2002<br />
Oldest Share Class Inception: 03/26/1993<br />
Return Benchmark: MSCI ACWI NR USD<br />
Total Annual Investment Expenses<br />
0.49% - Expense ratio<br />
1.35% - Median peer expense ratio<br />
Charged $4.90 annually per $1000 invested<br />
Costs less than 97% of its 1,047 peers<br />
16.54% - Investment return<br />
15.49% - Median peer return<br />
12.70% - Benchmark return<br />
Earned $165.40 per $1000 invested<br />
Outperformed 61% of its 951 peers<br />
Investment return since inception is 9.40% for your share class<br />
Shareholder-type expenses (If applicable)<br />
None<br />
15.03% - Investment return<br />
13.80% - Median peer return<br />
13.86% - Benchmark return<br />
Earned $751.50 per $1000 invested<br />
Outperformed 78% of its 650 peers<br />
16.45% - Investment return<br />
16.72% - Median peer return<br />
16.04% - Benchmark return<br />
Earned $822.50 per $1000 invested<br />
Outperformed 48% of its 665 peers<br />
Prepared for: Fourth Ave. Associates 401k<br />
9.54% - Investment return<br />
8.58% - Median peer return<br />
7.81% - Benchmark return<br />
Earned $954.00 per $1000 invested<br />
Outperformed 81% of its 226 peers<br />
8.53% - Investment return<br />
6.09% - Median peer return<br />
6.90% - Benchmark return<br />
Earned $853.00 per $1000 invested<br />
Outperformed 91% of its 441 peers<br />
8.76% - Investment return<br />
6.95% - Median peer return<br />
6.55% - Benchmark return<br />
Earned $876.00 per $1000 invested<br />
Outperformed 85% of its 412 peers<br />
www.jpmorganfunds.com<br />
www.americanfunds.com<br />
www.americanfunds.com<br />
Analysis, search process, and layout are © 2000-2014, fi360, Inc. (www.fi360.com). All rights reserved. The analysis and opinions generated by fi360: (1) do not constitute professional investment advice; (2) are provided solely for informational purposes; (3) are not warranted or<br />
represented to be correct, complete, or accurate; and (4) are for the exclusive use of subscribers to fi360. The data source is © 2014 Morningstar, Inc. All rights reserved. The data contained herein: (1) is proprietary to Morningstar, Inc and/or its content providers; (2) may not be<br />
copied or distributed; and (3) is not warranted to be accurate, complete or timely. Neither Morningstar, Inc nor its content providers are responsible for any damages or losses arising from any use of this information. Past performance is no guarantee of future results.<br />
fi360_Landscape_v6_0<br />
Fund data as of 1/31/2014 | Holdings as of 01/31/2014<br />
Page 7 of 19
Plan Options: Performance and Expenses (Cont.)<br />
This document includes important information to help you compare the investment options under your retirement plan. If you want additional information about your investment options, you can go to the<br />
specific internet web site address shown next to each investment or you can contact us at the number shown on the cover page.<br />
Your Investment Options<br />
Total Annualized Returns<br />
Real Estate<br />
Nuveen Real Estate Securities A (FREAX) | Nuveen | Mutual Fund<br />
Your Share Class Inception: 09/29/1995<br />
Oldest Share Class Inception: 06/30/1995<br />
Return Benchmark: S&P United States REIT TR<br />
USD<br />
Total Annual Investment Expenses<br />
1.28% - Expense ratio<br />
1.21% - Median peer expense ratio<br />
Charged $12.80 annually per $1000 invested<br />
Costs less than 45% of its 259 peers<br />
Intermediate Fixed Income<br />
1-Year 5-Year 10-Year<br />
1.76% - Investment return<br />
1.80% - Median peer return<br />
2.83% - Benchmark return<br />
Earned $17.60 per $1000 invested<br />
Outperformed 50% of its 245 peers<br />
Investment return since inception is 11.54% for your share class<br />
Shareholder-type expenses (If applicable)<br />
None<br />
Vanguard Interm-Term Treasury Inv (VFITX) | Vanguard | Mutual Fund<br />
Your Share Class Inception: 10/28/1991<br />
Oldest Share Class Inception: 10/28/1991<br />
Return Benchmark: Barclays US Government TR<br />
USD<br />
Total Annual Investment Expenses<br />
0.20% - Expense ratio<br />
0.87% - Median peer expense ratio<br />
Charged $2.00 annually per $1000 invested<br />
Costs less than 94% of its 279 peers<br />
-0.74% - Investment return<br />
-0.74% - Median peer return<br />
-0.57% - Benchmark return<br />
Lost $7.40 per $1000 invested<br />
Outperformed 50% of its 277 peers<br />
Investment return since inception is 6.38% for your share class<br />
Shareholder-type expenses (If applicable)<br />
None<br />
Vanguard Total Bond Market Index Inv (VBMFX) | Vanguard | Mutual Fund<br />
Your Share Class Inception: 12/11/1986<br />
Oldest Share Class Inception: 12/11/1986<br />
Return Benchmark: Barclays US Agg Bond TR<br />
USD<br />
Total Annual Investment Expenses<br />
0.20% - Expense ratio<br />
0.79% - Median peer expense ratio<br />
Charged $2.00 annually per $1000 invested<br />
Costs less than 96% of its 995 peers<br />
-0.04% - Investment return<br />
0.09% - Median peer return<br />
0.12% - Benchmark return<br />
Lost $0.40 per $1000 invested<br />
Outperformed 44% of its 976 peers<br />
Investment return since inception is 6.42% for your share class<br />
Shareholder-type expenses (If applicable)<br />
None<br />
22.05% - Investment return<br />
21.22% - Median peer return<br />
22.35% - Benchmark return<br />
Earned $1,102.50 per $1000 invested<br />
Outperformed 72% of its 213 peers<br />
3.73% - Investment return<br />
3.52% - Median peer return<br />
3.04% - Benchmark return<br />
Earned $186.50 per $1000 invested<br />
Outperformed 58% of its 268 peers<br />
4.75% - Investment return<br />
6.67% - Median peer return<br />
4.93% - Benchmark return<br />
Earned $237.50 per $1000 invested<br />
Outperformed 16% of its 845 peers<br />
Prepared for: Fourth Ave. Associates 401k<br />
9.77% - Investment return<br />
7.94% - Median peer return<br />
8.34% - Benchmark return<br />
Earned $977.00 per $1000 invested<br />
Outperformed 93% of its 187 peers<br />
4.69% - Investment return<br />
3.91% - Median peer return<br />
4.19% - Benchmark return<br />
Earned $469.00 per $1000 invested<br />
Outperformed 88% of its 262 peers<br />
4.49% - Investment return<br />
4.47% - Median peer return<br />
4.62% - Benchmark return<br />
Earned $449.00 per $1000 invested<br />
Outperformed 52% of its 749 peers<br />
www.nuveen.com<br />
www.vanguard.com<br />
www.vanguard.com<br />
Analysis, search process, and layout are © 2000-2014, fi360, Inc. (www.fi360.com). All rights reserved. The analysis and opinions generated by fi360: (1) do not constitute professional investment advice; (2) are provided solely for informational purposes; (3) are not warranted or<br />
represented to be correct, complete, or accurate; and (4) are for the exclusive use of subscribers to fi360. The data source is © 2014 Morningstar, Inc. All rights reserved. The data contained herein: (1) is proprietary to Morningstar, Inc and/or its content providers; (2) may not be<br />
copied or distributed; and (3) is not warranted to be accurate, complete or timely. Neither Morningstar, Inc nor its content providers are responsible for any damages or losses arising from any use of this information. Past performance is no guarantee of future results.<br />
fi360_Landscape_v6_0<br />
Fund data as of 1/31/2014 | Holdings as of 01/31/2014<br />
Page 8 of 19
Plan Options: Performance and Expenses (Cont.)<br />
This document includes important information to help you compare the investment options under your retirement plan. If you want additional information about your investment options, you can go to the<br />
specific internet web site address shown next to each investment or you can contact us at the number shown on the cover page.<br />
Your Investment Options<br />
Total Annualized Returns<br />
Intermediate Fixed Income (Cont.)<br />
Nuveen Oregon Intermediate Muni Bd I (FORCX) | Nuveen | Mutual Fund<br />
Your Share Class Inception: 08/08/1997<br />
Oldest Share Class Inception: 08/08/1997<br />
Return Benchmark: Barclays Municipal 10 Yr 8-12<br />
TR USD<br />
Total Annual Investment Expenses<br />
0.63% - Expense ratio<br />
0.82% - Median peer expense ratio<br />
Charged $6.30 annually per $1000 invested<br />
Costs less than 77% of its 178 peers<br />
Allocation<br />
1-Year 5-Year 10-Year<br />
-0.84% - Investment return<br />
-1.29% - Median peer return<br />
-0.49% - Benchmark return<br />
Lost $8.40 per $1000 invested<br />
Outperformed 73% of its 178 peers<br />
Investment return since inception is 4.18% for your share class<br />
Shareholder-type expenses (If applicable)<br />
None<br />
Vanguard Wellington Inv (VWELX) | Vanguard | Mutual Fund<br />
Your Share Class Inception: 07/01/1929<br />
Oldest Share Class Inception: 07/01/1929<br />
Return Benchmark: Morningstar Moderately Aggr<br />
Target Risk<br />
Total Annual Investment Expenses<br />
0.25% - Expense ratio<br />
1.24% - Median peer expense ratio<br />
Charged $2.50 annually per $1000 invested<br />
Costs less than 98% of its 815 peers<br />
Alternative<br />
13.86% - Investment return<br />
11.41% - Median peer return<br />
12.63% - Benchmark return<br />
Earned $138.60 per $1000 invested<br />
Outperformed 82% of its 780 peers<br />
Investment return since inception is 8.23% for your share class<br />
Shareholder-type expenses (If applicable)<br />
None<br />
DWS Alternative Asset Allocation A (AAAAX) | DWS Investments | Mutual Fund<br />
Your Share Class Inception: 07/31/2007<br />
Oldest Share Class Inception: 07/30/2007<br />
Return Benchmark: Morningstar Moderate Target<br />
Risk<br />
Total Annual Investment Expenses<br />
1.96% - Expense ratio<br />
1.92% - Median peer expense ratio<br />
Charged $19.60 annually per $1000 invested<br />
Costs less than 48% of its 327 peers<br />
-0.24% - Investment return<br />
2.67% - Median peer return<br />
9.43% - Benchmark return<br />
Lost $2.40 per $1000 invested<br />
Outperformed 32% of its 243 peers<br />
Investment return since inception is 2.09% for your share class<br />
Shareholder-type expenses (If applicable)<br />
4.21% - Investment return<br />
4.02% - Median peer return<br />
5.26% - Benchmark return<br />
Earned $210.50 per $1000 invested<br />
Outperformed 60% of its 175 peers<br />
14.58% - Investment return<br />
13.52% - Median peer return<br />
15.64% - Benchmark return<br />
Earned $729.00 per $1000 invested<br />
Outperformed 71% of its 648 peers<br />
9.35% - Investment return<br />
7.07% - Median peer return<br />
12.88% - Benchmark return<br />
Earned $467.50 per $1000 invested<br />
Outperformed 75% of its 102 peers<br />
Contractual expense waiver of 0.07%. Expires on 2014-7-31. Gross expense ratio is 2.03%.<br />
Prepared for: Fourth Ave. Associates 401k<br />
3.58% - Investment return<br />
3.35% - Median peer return<br />
4.80% - Benchmark return<br />
Earned $358.00 per $1000 invested<br />
Outperformed 72% of its 172 peers<br />
7.86% - Investment return<br />
5.75% - Median peer return<br />
7.47% - Benchmark return<br />
Earned $786.00 per $1000 invested<br />
Outperformed 94% of its 509 peers<br />
N/Av<br />
1.80% - Median peer return<br />
6.89% - Benchmark return<br />
www.nuveen.com<br />
www.vanguard.com<br />
www.dws-investments.com<br />
Analysis, search process, and layout are © 2000-2014, fi360, Inc. (www.fi360.com). All rights reserved. The analysis and opinions generated by fi360: (1) do not constitute professional investment advice; (2) are provided solely for informational purposes; (3) are not warranted or<br />
represented to be correct, complete, or accurate; and (4) are for the exclusive use of subscribers to fi360. The data source is © 2014 Morningstar, Inc. All rights reserved. The data contained herein: (1) is proprietary to Morningstar, Inc and/or its content providers; (2) may not be<br />
copied or distributed; and (3) is not warranted to be accurate, complete or timely. Neither Morningstar, Inc nor its content providers are responsible for any damages or losses arising from any use of this information. Past performance is no guarantee of future results.<br />
fi360_Landscape_v6_0<br />
Fund data as of 1/31/2014 | Holdings as of 01/31/2014<br />
Page 9 of 19
Plan Options: Performance and Expenses (Cont.)<br />
This document includes important information to help you compare the investment options under your retirement plan. If you want additional information about your investment options, you can go to the<br />
specific internet web site address shown next to each investment or you can contact us at the number shown on the cover page.<br />
Your Investment Options<br />
Total Annualized Returns<br />
Other / Specialty<br />
Fourth Ave. Company Stock| Custom<br />
1-Year 5-Year 10-Year<br />
Prepared for: Fourth Ave. Associates 401k<br />
Inception:<br />
Return Benchmark: Morningstar US Market TR<br />
USD<br />
-10.00% - Investment return<br />
N/Av<br />
22.29% - Benchmark return<br />
Lost $100.00 per $1000 invested<br />
7.50% - Investment return<br />
N/Av<br />
20.01% - Benchmark return<br />
Earned $375.00 per $1000 invested<br />
N/Av<br />
N/Av<br />
7.53% - Benchmark return<br />
Total Annual Investment Expenses<br />
0.30% - Expense ratio<br />
Median peer expenses are N/Av<br />
Charged $3.00 annually per $1000 invested<br />
Investment return since inception is N/Av<br />
Shareholder-type expenses (If applicable)<br />
None<br />
Page 10 of 19<br />
Analysis, search process, and layout are © 2000-2014, fi360, Inc. (www.fi360.com). All rights reserved. The analysis and opinions generated by fi360: (1) do not constitute professional investment advice; (2) are provided solely for informational purposes; (3) are not warranted or<br />
represented to be correct, complete, or accurate; and (4) are for the exclusive use of subscribers to fi360. The data source is © 2014 Morningstar, Inc. All rights reserved. The data contained herein: (1) is proprietary to Morningstar, Inc and/or its content providers; (2) may not be<br />
copied or distributed; and (3) is not warranted to be accurate, complete or timely. Neither Morningstar, Inc nor its content providers are responsible for any damages or losses arising from any use of this information. Past performance is no guarantee of future results.<br />
fi360_Landscape_v6_0<br />
Fund data as of 1/31/2014 | Holdings as of 01/31/2014
Models - Summary<br />
Model summary statistics are reported below. The annualized return data below reflects performance without adjusting for sales charges. If adjusted for sales charges, the load would reduce the performance quoted.<br />
Past performance is no guarantee of future results. If included, the hypothetical performance is for illustrative purposes only and may not reflect the actual performance or volatility that would have been experienced.<br />
It does not take into account any historical model changes and utilizes the rebalancing frequency shown below. 1yr Model turnover is approximated using the following formula. The lesser of the these two numbers<br />
(investments added during the last year and investments removed during the last year) is divided by the average number of investments held over that period. Please view the Appendix for additional disclosures.<br />
Model Name<br />
Weighted<br />
Expense Ratio<br />
Aggressive (Inception Date: 2/28/2002 | Rebalancing frequency: Manual)<br />
Turnover<br />
1-Year<br />
Standard Deviation<br />
3-Year<br />
5-Year<br />
3-Month<br />
YTD<br />
1-Year<br />
Annualized Total Return<br />
3-Year<br />
Prepared for: Fourth Ave. Associates 401k<br />
Actual Model as of 1/31/2014 1.24 8.16 13.92 17.54<br />
-0.98 -1.60 4.39 5.82 17.47 7.70<br />
8.47<br />
Hypothetical Model as of 1/31/2014 1.24 - 13.46 16.42<br />
-1.91 -1.12 -0.46 4.36 16.30 8.08<br />
N/Av<br />
# of Investments in model: 14 | # of <strong>Participant</strong>s: 50 | $ Assets invested: 250,000.00<br />
Balanced (Inception Date: 11/30/2010 | Rebalancing frequency: Monthly)<br />
Actual Model as of 1/31/2014 0.28 0.00 10.07 -<br />
1.52 -2.21 16.39 10.41 -<br />
-<br />
12.06<br />
Hypothetical Model as of 1/31/2014 0.28 - 10.07 12.33<br />
1.52 -2.21 16.39 10.41 15.99 7.60<br />
N/Av<br />
# of Investments in model: 7 | # of <strong>Participant</strong>s: 50 | $ Assets invested: 300,000.00<br />
Conservative (Inception Date: 2/28/2005 | Rebalancing frequency: Quarterly)<br />
Actual Model as of 1/31/2014 0.71 8.28 4.18 5.39<br />
0.12 -0.59 2.95 3.47 7.13 -<br />
4.68<br />
Hypothetical Model as of 1/31/2014 0.71 - 3.50 4.39<br />
0.12 -0.60 3.36 3.51 6.26 4.30<br />
N/Av<br />
# of Investments in model: 12 | # of <strong>Participant</strong>s: 50 | $ Assets invested: 400,000.00<br />
5-Year<br />
10-Year<br />
Return since<br />
inception<br />
Page 11 of 19<br />
Analysis, search process, and layout are © 2000-2014, fi360, Inc. (www.fi360.com). All rights reserved. The analysis and opinions generated by fi360: (1) do not constitute professional investment advice; (2) are provided solely for informational purposes; (3) are not warranted or<br />
represented to be correct, complete, or accurate; and (4) are for the exclusive use of subscribers to fi360. The data source is © 2014 Morningstar, Inc. All rights reserved. The data contained herein: (1) is proprietary to Morningstar, Inc and/or its content providers; (2) may not be<br />
copied or distributed; and (3) is not warranted to be accurate, complete or timely. Neither Morningstar, Inc nor its content providers are responsible for any damages or losses arising from any use of this information. Past performance is no guarantee of future results.<br />
fi360_Landscape_v6_0<br />
Fund data as of 1/31/2014 | Holdings as of 01/31/2014
Peer Group Definitions<br />
Foreign Large Blend<br />
Foreign large-blend portfolios invest in a variety of big international stocks. Most of these portfolios divide their assets among a dozen or more developed markets, including Japan, Britain, France, and Germany. These<br />
portfolios primarily invest in stocks that have market caps in the top 70% of each economically integrated market (such as Europe or Asia ex-Japan). The blend style is assigned to portfolios where neither growth nor<br />
value characteristics predominate. These portfolios typically will have less than 20% of assets invested in U.S. stocks.<br />
Intermediate Government<br />
Intermediate-government portfolios have at least 90% of their bond holdings in bonds backed by the U.S. government or by government-linked agencies. This backing minimizes the credit risk of these portfolios, as the<br />
U.S. government is unlikely to default on its debt. These portfolios have durations typically between 3.5 and six years. Consequently, the group's performance--and its level of volatility--tends to fall between that of the<br />
short government and long government bond categories. Morningstar calculates monthly breakpoints using the effective duration of the Morningstar Core Bond Index (MCBI) in determing duration assignment.<br />
Intermediate is defined as 75% to 125% of the 3 year average effective duration of the MCBI.<br />
Intermediate-Term Bond<br />
Intermediate-term bond portfolios invest primarily in corporate and other investment-grade U.S. fixed-income issues and typically have durations of 3.5 to six years. These portfolios are less sensitive to interest rates,<br />
and therefore less volatile, than portfolios that have longer durations. Morningstar calculates monthly breakpoints using the effective duration of the Morningstar Core Bond Index (MCBI) in determing duration<br />
assignment. Intermediate-term is defined as 75% to 125% of the 3 year average effective duration of the MCBI.<br />
Large Blend<br />
Large-blend portfolios are fairly representative of the overall U.S. stock market in size, growth rates, and price. Stocks in the top 70% of the capitalization of the U.S. equity market are defined as large-cap. The blend<br />
style is assigned to portfolios where neither growth nor value characteristics predominate. These portfolios tend to invest across the spectrum of U.S. industries, and owing to their broad exposure, the portfolios' returns<br />
are often similar to those of the S&P 500 Index.<br />
Large Growth<br />
Large-growth portfolios invest primarily in big U.S. companies that are projected to grow faster than other large-cap stocks. Stocks in the top 70% of the capitalization of the U.S. equity market are defined as large cap.<br />
Growth is defined based on fast growth (high growth rates for earnings, sales, book value, and cash flow) and high valuations (high price ratios and low dividend yields). Most of these portfolios focus on companies in<br />
rapidly expanding industries.<br />
Large Value<br />
Large-value portfolios invest primarily in big U.S. companies that are less expensive or growing more slowly than other large-cap stocks. Stocks in the top 70% of the capitalization of the U.S. equity market are defined<br />
as large-cap. Value is defined based on low valuations (low price ratios and high dividend yields) and slow growth (low growth rates for earnings, sales, book value, and cash flow).<br />
Mid-Cap Blend<br />
The typical mid-cap blend portfolio invests in U.S. stocks of various sizes and styles, giving it a middle-of-the-road profile. Most shy away from high-priced growth stocks, but aren't so price-conscious that they land in<br />
value territory. The U.S. mid-cap range for market capitalization typically falls between $1 billion-$8 billion and represents 20% of the total capitalization of the U.S. equity market. The blend style is assigned to<br />
portfolios where neither growth nor value characteristics predominate.<br />
Mid-Cap Growth<br />
Some mid-cap growth portfolios invest in stocks of all sizes, thus leading to a mid-cap profile, but others focus on midsize companies. Mid-cap growth portfolios target U.S. firms that are projected to grow faster than<br />
other mid-cap stocks, therefore commanding relatively higher prices. The U.S. mid-cap range for market capitalization typically falls between $1 billion-$8 billion and represents 20% of the total capitalization of the U.S.<br />
equity market. Growth is defined based on fast growth (high growth rates for earnings, sales, book value, and cash flow) and high valuations (high price ratios and low dividend yields).<br />
Mid-Cap Value<br />
Some mid-cap value portfolios focus on medium-size companies while others land here because they own a mix of small-, mid-, and large-cap stocks. All look for U.S. stocks that are less expensive or growing more<br />
slowly than the market. The U.S. mid-cap range for market capitalization typically falls between $1 billion-$8 billion and represents 20% of the total capitalization of the U.S. equity market. Value is defined based on low<br />
valuations (low price ratios and high dividend yields) and slow growth (low growth rates for earnings, sales, book value, and cash flow).<br />
Miscellaneous Sector<br />
Miscellaneous sector portfolios invest in specific sectors that do not fit into any of Morningstar's existing sector categories and for which not enough funds exist to merit the creation of a separate category.<br />
Moderate Allocation<br />
Moderate-allocation portfolios seek to provide both capital appreciation and income by investing in three major areas: stocks, bonds, and cash. These portfolios tend to hold larger positions in stocks than<br />
conservative-allocation portfolios. These portfolios typically have 50% to 70% of assets in equities and the remainder in fixed income and cash.<br />
Multialternative<br />
These funds offer investors exposure to several different alternative investment tactics. Funds in this category have a majority of their assets exposed to alternative strategies. An investor's exposure to different tactics<br />
may change slightly over time in response to market movements. Funds in this category include both funds with static allocations to alternative strategies and funds tactically allocating among alternative strategies and<br />
asset classes. The gross short exposure is greater than 20%.<br />
Prepared for: Fourth Ave. Associates 401k<br />
Page 12 of 19<br />
Analysis, search process, and layout are © 2000-2014, fi360, Inc. (www.fi360.com). All rights reserved. The analysis and opinions generated by fi360: (1) do not constitute professional investment advice; (2) are provided solely for informational purposes; (3) are not warranted or<br />
represented to be correct, complete, or accurate; and (4) are for the exclusive use of subscribers to fi360. The data source is © 2014 Morningstar, Inc. All rights reserved. The data contained herein: (1) is proprietary to Morningstar, Inc and/or its content providers; (2) may not be<br />
copied or distributed; and (3) is not warranted to be accurate, complete or timely. Neither Morningstar, Inc nor its content providers are responsible for any damages or losses arising from any use of this information. Past performance is no guarantee of future results.<br />
fi360_Landscape_v6_0<br />
Fund data as of 1/31/2014 | Holdings as of 01/31/2014
Peer Group Definitions (Cont.)<br />
Muni Single State Interm<br />
Muni single-state intermediate portfolios invest in bonds issued by state and local governments to fund public projects. The income from such bonds is generally free from federal taxes and from state taxes in the issuing<br />
state. To get the state-tax benefit, these portfolios buy bonds from only one state. These portfolios have durations of 4.5 to seven years (or, if duration is unavailable, average maturities of five to 12 years).<br />
Real Estate<br />
Real estate portfolios invest primarily in real estate investment trusts of various types. REITs are companies that develop and manage real estate properties. There are several different types of REITs, including<br />
apartment, factory-outlet, health-care, hotel, industrial, mortgage, office, and shopping center REITs. Some portfolios in this category also invest in real estate operating companies.<br />
Small Blend<br />
Small-blend portfolios favor U.S. firms at the smaller end of the market-capitalization range. Some aim to own an array of value and growth stocks while others employ a discipline that leads to holdings with valuations<br />
and growth rates close to the small-cap averages. Stocks in the bottom 10% of the capitalization of the U.S. equity market are defined as small-cap. The blend style is assigned to portfolios where neither growth nor<br />
value characteristics predominate.<br />
Small Value<br />
Small-value portfolios invest in small U.S. companies with valuations and growth rates below other small-cap peers. Stocks in the bottom 10% of the capitalization of the U.S. equity market are defined as small-cap.<br />
Value is defined based on low valuations (low price ratios and high dividend yields) and slow growth (low growth rates for earnings, sales, book value, and cash flow).<br />
World Stock<br />
World-stock portfolios have few geographical limitations. It is common for these portfolios to invest the majority of their assets in the U.S., Europe, and Japan, with the remainder divided among the globe's smaller<br />
markets. These portfolios typically have 20%-60% of assets in U.S. stocks.<br />
Prepared for: Fourth Ave. Associates 401k<br />
Page 13 of 19<br />
Analysis, search process, and layout are © 2000-2014, fi360, Inc. (www.fi360.com). All rights reserved. The analysis and opinions generated by fi360: (1) do not constitute professional investment advice; (2) are provided solely for informational purposes; (3) are not warranted or<br />
represented to be correct, complete, or accurate; and (4) are for the exclusive use of subscribers to fi360. The data source is © 2014 Morningstar, Inc. All rights reserved. The data contained herein: (1) is proprietary to Morningstar, Inc and/or its content providers; (2) may not be<br />
copied or distributed; and (3) is not warranted to be accurate, complete or timely. Neither Morningstar, Inc nor its content providers are responsible for any damages or losses arising from any use of this information. Past performance is no guarantee of future results.<br />
fi360_Landscape_v6_0<br />
Fund data as of 1/31/2014 | Holdings as of 01/31/2014
Index Definitions<br />
Barclays Municipal 10 Yr 8-12 TR USD<br />
The index measures the performance of USD-denominated long-term tax exempt bond market with maturities of 10 years(8-12), including state and local general obligation bonds, revenue bonds, insured bonds, and<br />
prerefunded bonds.<br />
Barclays US Agg Bond TR USD<br />
Prepared for: Fourth Ave. Associates 401k<br />
The index measures the performance of investment grade, U.S. dollar-denominated, fixed-rate taxable bond market, including Treasuries, government-related and corporate securities, MBS (agency fixed-rate and hybrid<br />
ARM passthroughs), ABS, and CMBS. It rolls up into other Barclays flagship indices, such as the multi-currency Global Aggregate Index and the U.S. Universal Index, which includes high yield and emerging markets debt.<br />
Barclays US Government TR USD<br />
The index measures the performance of the U.S. Treasury and U.S. Agency Indices, including Treasuries and U.S. agency debentures. It is a component of the U.S. Government/Credit Index and the U.S. Aggregate<br />
Index.<br />
Morningstar Moderate Target Risk<br />
The index measures the performance of a portfolio of global equities, bonds and traditional inflation hedges such as commodities and TIPS. This portfolio is held in a static allocation appropriate for US investors who seek<br />
average exposure to equity market risk and returns.<br />
Morningstar Moderately Aggr Target Risk<br />
The index measures the performance of a portfolio of global equities, bonds and traditional inflation hedges such as commodities and TIPS. This portfolio is held in a static allocation appropriate for US investors who seek<br />
a slightly above-average exposure to equity market risk and returns.<br />
Morningstar US Market TR USD<br />
The index measures the performance of US securities and targets 97% market capitalization coverage of the investable universe. It is a diversified broad market index.<br />
MSCI ACWI Ex USA NR USD<br />
The index measures the performance of the large and mid cap segments of the particular regions, excluding USA equity securities, including developed and emerging market. It is free float-adjusted market-capitalization<br />
weighted.<br />
MSCI ACWI NR USD<br />
The index measures the performance of the large and mid cap segments of the particular regions equity securities, including developed and emerging market. It is free float-adjusted market-capitalization weighted.<br />
Russell 1000 Growth TR USD<br />
The index measures the performance of the large-cap growth segment of the US equity securities. It includes the Russell 1000 index companies with higher price-to-book ratios and higher forecasted growth values. It is<br />
market-capitalization weighted.<br />
Russell 1000 TR USD<br />
The index measures the performance of the large-cap segment of the US equity securities. It is a subset of the Russell 3000 index and includes approximately 1000 of the largest securities based on a combination of<br />
their market cap and current index membership.<br />
Russell 1000 Value TR USD<br />
The index measures the performance of the large-cap value segment of the US equity securities. It includes the Russell 1000 index companies with lower price-to-book ratios and lower expected growth values. It is<br />
market-capitalization weighted.<br />
Russell 2000 TR USD<br />
The index measures the performance of the small-cap segment of the US equity universe. It is a subset of the Russell 3000 and includes approximately 2000 of the smallest securities based on a combination of their<br />
market cap and current index membership.<br />
Russell 2000 Value TR USD<br />
The index measures the performance of small-cap growth segment of the US equity universe. It includes Russell 2000 index companies with higher price-to-value and higher forecasted growth values. It is<br />
market-capitalization weighted.<br />
Russell Mid Cap Growth TR USD<br />
The index measures the performance of the mid-cap growth segment of the US equity universe. It includes Russell midcap index companies with higher price-to-book ratios and higher forecasted growth values. It is<br />
market-capitalization weighted.<br />
Page 14 of 19<br />
Analysis, search process, and layout are © 2000-2014, fi360, Inc. (www.fi360.com). All rights reserved. The analysis and opinions generated by fi360: (1) do not constitute professional investment advice; (2) are provided solely for informational purposes; (3) are not warranted or<br />
represented to be correct, complete, or accurate; and (4) are for the exclusive use of subscribers to fi360. The data source is © 2014 Morningstar, Inc. All rights reserved. The data contained herein: (1) is proprietary to Morningstar, Inc and/or its content providers; (2) may not be<br />
copied or distributed; and (3) is not warranted to be accurate, complete or timely. Neither Morningstar, Inc nor its content providers are responsible for any damages or losses arising from any use of this information. Past performance is no guarantee of future results.<br />
fi360_Landscape_v6_0<br />
Fund data as of 1/31/2014 | Holdings as of 01/31/2014
Index Definitions (Cont.)<br />
Russell Mid Cap TR USD<br />
The index measures the performance of the mid-cap segment of the US equity universe. It is a subset of Russell 1000 index and includes approximately 800 of the smallest securities based on a combination of their<br />
market cap and current index membership. The index represents approximately 31% of the total market capitalization of the Russell 1000 companies.<br />
Russell Mid Cap Value TR USD<br />
The index measures the performance of the mid-cap value segment of the US equity universe. It includes Russell midcap index companies with lower price-to-book ratios and lower forecasted growth values. It is<br />
market-capitalization weighted.<br />
S&P United States REIT TR USD<br />
The index measures the performance of investable universe of pubilcly traded real estate investment trusts domiciled in the United States.<br />
Prepared for: Fourth Ave. Associates 401k<br />
Page 15 of 19<br />
Analysis, search process, and layout are © 2000-2014, fi360, Inc. (www.fi360.com). All rights reserved. The analysis and opinions generated by fi360: (1) do not constitute professional investment advice; (2) are provided solely for informational purposes; (3) are not warranted or<br />
represented to be correct, complete, or accurate; and (4) are for the exclusive use of subscribers to fi360. The data source is © 2014 Morningstar, Inc. All rights reserved. The data contained herein: (1) is proprietary to Morningstar, Inc and/or its content providers; (2) may not be<br />
copied or distributed; and (3) is not warranted to be accurate, complete or timely. Neither Morningstar, Inc nor its content providers are responsible for any damages or losses arising from any use of this information. Past performance is no guarantee of future results.<br />
fi360_Landscape_v6_0<br />
Fund data as of 1/31/2014 | Holdings as of 01/31/2014
Glossary<br />
12b-1 <strong>Fee</strong><br />
Maximum annual charge deducted from fund assets to pay for distribution and marketing costs. Although usually set on a percentage basis, this amount will occasionally be a flat figure. This information is taken directly<br />
from the fund's prospectus, and includes distribution, service and other expenses incurred by the fund. Morningstar lists the maximum amount. Some 12b-1 fees are something of a hidden charge, because they are<br />
taken out of the NAV. Morningstar breaks the 12b-1 amount out of the expense ratio so investors know how much they're paying. (Description provided by Morningstar)<br />
12b-1 Sales <strong>Fee</strong><br />
Prepared for: Fourth Ave. Associates 401k<br />
The sales fee component of the 12b-1 fee is used to compensate the advisor or broker for the sale of the fund to the client. This is the most common component of the 12b-1 fee.This fee can be rebated back to the client<br />
to offset other plan expenses. (Description provided by fi360)<br />
12b-1 Service <strong>Fee</strong><br />
The service fee component of the 12b-1 fee is used to pay for services of the plan.These fees help to reduce other costs of the plan.This fee can be rebated back to the client to offset other plan expenses. (Description<br />
provided by fi360)<br />
Basis Point<br />
One-hundredth of a percentage point. For example, 50 basis points equals .50%. (Description provided by Morningstar)<br />
Broad Asset Class<br />
A term used to group funds with similar categories and investing styles. (Description provided by fi360)<br />
Effective Management <strong>Fee</strong><br />
The Effective Mgmt. <strong>Fee</strong>s column represents the actual fees paid to the investment manager for managing and administering the fund. In addition the pure management fee, this would also include administration costs<br />
such as accounting, auditing, legal fees,etc. This value is calculated by subtracting the 12b-1 fees and Sub-ta <strong>Fee</strong>s from the Prospectus Net Expense Ratio. (Description provided by fi360)<br />
Expense Ratio - Audited Net<br />
The percentage of fund assets paid for operating expenses and management fees, including 12b-1 fees, administrative fees, and all other asset-based costs incurred by the fund, except brokerage costs. Fund expenses<br />
are reflected in the fund's NAV . This expense ratio is pulled directly from the fund's annual report.Sales charges are not included in the expense ratio.For fund of funds, the underlying fund expense ratios are not<br />
included in the expense ratio. (Description provided by Morningstar)<br />
Expense Ratio - Prospectus Gross<br />
Gross Expense Ratio represents the total gross expenses (net expenses with waivers added back in) divided by the fund's average net assets. If it is not equal to the net expense ratio, the gross expense ratio portrays<br />
the fund's expenses had the fund not waived a portion, or all, of its fees. Thus, to some degree, it is an indication of fee contracts. Some fee waivers have an expiration date; other waivers are in place indefinitely.<br />
(Description provided by Morningstar)<br />
Expense Ratio - Prospectus Net<br />
The percentage of fund assets used to pay for operating expenses and management fees, including 12b-1 fees, administrative fees, and all other asset-based costs incurred by the fund, except brokerage costs. Fund<br />
expenses are reflected in the fund's NAV. Sales charges are not included in the expense ratio. The expense ratio for fund of funds is the aggregate expense ratio as defined as the sum of the wrap or sponsor fees plus<br />
the estimated weighted average of the underlying fund fees. (Description provided by Morningstar)<br />
<strong>Fee</strong> Waiver<br />
The elimination of all or part of a fund's expenses and fees. Funds, particularly fixed-income funds, adopt this practice at various times to make their returns more competitive. (Description provided by Morningstar)<br />
Fund Name<br />
The fund's official name, or an abbreviation thereof, as stated in the fund's prospectus. Morningstar attempts to limit the extent to which fund name abbreviation is made by keeping the family name or first word intact<br />
whenever possible. As a general rule, the words Fund, Shares, Class, Series, Trust (not including class designation), and articles at the beginning of a fund's name are omitted. They appear, however, in cases where<br />
their omission could confuse two funds or groups. The fund name is taken directly from the prospectus. The names normally do not change, unless the fund itself changes its name. (Description provided by Morningstar)<br />
Index<br />
A collection of securities chosen to represent a specific investment area. Common indexes include the Dow Jones Industrial Average, the S&P 500, and the NASDAQ Composite. (Description provided by Morningstar)<br />
Page 16 of 19<br />
Analysis, search process, and layout are © 2000-2014, fi360, Inc. (www.fi360.com). All rights reserved. The analysis and opinions generated by fi360: (1) do not constitute professional investment advice; (2) are provided solely for informational purposes; (3) are not warranted or<br />
represented to be correct, complete, or accurate; and (4) are for the exclusive use of subscribers to fi360. The data source is © 2014 Morningstar, Inc. All rights reserved. The data contained herein: (1) is proprietary to Morningstar, Inc and/or its content providers; (2) may not be<br />
copied or distributed; and (3) is not warranted to be accurate, complete or timely. Neither Morningstar, Inc nor its content providers are responsible for any damages or losses arising from any use of this information. Past performance is no guarantee of future results.<br />
fi360_Landscape_v6_0<br />
Fund data as of 1/31/2014 | Holdings as of 01/31/2014
Glossary (Cont.)<br />
Management <strong>Fee</strong><br />
<strong>Fee</strong> charged for the management of pooled investments such as collective investment funds, insurance/annuity products, mutual funds and individually managed accounts. (Description provided by fi360)<br />
Prepared for: Fourth Ave. Associates 401k<br />
Median Mutual Fund/ETF Manager<br />
The median manager for a given data point is calculated by ranking the managers (investments) within a given peer group on a particular data point from best to worst.The manager that represents the 50th percentile<br />
of the ranking becomes the median manager for the group. (Description provided by fi360)<br />
Number of investments in Peer Group<br />
A count of the number of investments within a specific peer group for a particular data point such as 1yr return or Alpha. This number represents the total number of investments used to calculate the bar charts and<br />
rankings for each data point.(Note: Group Retirement Plan Annuities (GRPAs) are ranked in a peer group that includes GRPAs, Mutual Funds and ETFs. Prior to 9/30/2013 only Mutual Funds and ETFs were used to<br />
construct the peer group. (Description provided by fi360)<br />
Peer Group (Morningstar Category)<br />
In an effort to distinguish funds by what they own, as well as by their prospectus objectives and styles, Morningstar developed the Morningstar Categories. While the prospectus objective identifies a fund's investment<br />
goals based on the wording in the fund prospectus, the Morningstar Category identifies funds based on their actual investment styles as measured by their underlying portfolio holdings (portfolio and other statistics over<br />
the past three years). See specific category name for further details (i.e. "Peer Group - Large Value"). (Description provided by Morningstar)<br />
Redemption <strong>Fee</strong><br />
The redemption fee is an amount charged when money is withdrawn from the fund. This fee does not go back into the pockets of the fund company, but rather into the fund itself and thus does not represent a net cost<br />
to shareholders. Also, unlike contingent deferred sales charges, redemption fees typically operate only in short, specific time clauses, commonly 30, 180, or 365 days. However, some redemption fees exist for up to five<br />
years. Charges are not imposed after the stated time has passed. These fees are typically imposed to discourage market timers, whose quick movements into and out of funds can be disruptive. The charge is normally<br />
imposed on the ending share value, appreciated or depreciated from the original value. (Description provided by Morningstar)<br />
Sub-TA <strong>Fee</strong><br />
Also know as Sub-Transfer Agency <strong>Fee</strong>s, the name of this fee refers to the subcontracting of participant accounting to third parties, called Sub Transfer Agents. The transfer agent is the bank or trust company that<br />
executes, clears and settles buy or sell orders for mutual fund shares, and maintains shareholder records of ownership. When these functions are subcontracted to another recordkeeper, the fee paid to the<br />
sub-contractor is called the Sub-TA fee.Typically, Sub-TA fees are not disclosed in the prospectus and can vary depending on the client's circumstances.This fee can be rebated back to the client to offset other plan<br />
expenses. (Description provided by fi360)<br />
Ticker<br />
The NASDAQ assigned symbol commonly used to locate the fund on electronic price-quoting systems. Ticker information is provided by NASDAQ. Morningstar receives daily internet transmissions detailing ticker as well<br />
as fund-name changes, plus a listing of any funds that have been recently added or deleted from NASDAQ listings. The ticker symbol itself is designated by the fund company. Thus, tickers do not always follow a uniform<br />
pattern. (Description provided by Morningstar)<br />
Total operational fee<br />
The total operational fee represents the true cost of an investment to the investor. It includes the effective management fee plus any applicable 12b-1, wrap and other fees for the investment. (Description provided by fi360)<br />
Total Return - Funds<br />
Expressed in percentage terms, Morningstar's calculation of total return is determined each month by taking the change in monthly net asset value, reinvesting all income and capital-gains distributions during that<br />
month, and dividing by the starting NAV. Reinvestments are made using the actual reinvestment NAV, and daily payoffs are reinvested monthly. Unless otherwise noted, Morningstar does not adjust total returns for<br />
sales charges (such as front-end loads, deferred loads and redemption fees), preferring to give a clearer picture of a fund's performance. The total returns do account for management, administrative, 12b-1 fees and<br />
other costs taken out of fund assets. Total returns for periods longer than one year are expressed in terms of compounded average annual returns (also known as geometric total returns), affording a more meaningful<br />
picture of fund performance than non-annualized figures. (Description provided by Morningstar)<br />
Total Return - Percentile Rank<br />
This is the investment's total-return percentile rank relative to all funds that have the same Morningstar Category. The highest (or most favorable) percentile rank is 1 and the lowest (or least favorable) percentile rank<br />
is 100. The top-performing investment in a category will always receive a rank of 1. Rankings may vary among share classes and are based on historical total returns, which are not indicative of future results. (Description<br />
provided by Morningstar)<br />
Watch List<br />
The watch list is a list of investments that fail to meet the stated due diligence requirements used to periodically monitor the investment. The due diligence requrements are typically outlined in an Investment Policy<br />
Statement. (Description provided by fi360)<br />
Page 17 of 19<br />
Analysis, search process, and layout are © 2000-2014, fi360, Inc. (www.fi360.com). All rights reserved. The analysis and opinions generated by fi360: (1) do not constitute professional investment advice; (2) are provided solely for informational purposes; (3) are not warranted or<br />
represented to be correct, complete, or accurate; and (4) are for the exclusive use of subscribers to fi360. The data source is © 2014 Morningstar, Inc. All rights reserved. The data contained herein: (1) is proprietary to Morningstar, Inc and/or its content providers; (2) may not be<br />
copied or distributed; and (3) is not warranted to be accurate, complete or timely. Neither Morningstar, Inc nor its content providers are responsible for any damages or losses arising from any use of this information. Past performance is no guarantee of future results.<br />
fi360_Landscape_v6_0<br />
Fund data as of 1/31/2014 | Holdings as of 01/31/2014
Glossary (Cont.)<br />
Wrap <strong>Fee</strong><br />
An inclusive fee generally based on the percentage of assets in an investment program, which typically provides asset allocation, execution of transactions and other administrative services. (Description provided by fi360)<br />
Prepared for: Fourth Ave. Associates 401k<br />
Page 18 of 19<br />
Analysis, search process, and layout are © 2000-2014, fi360, Inc. (www.fi360.com). All rights reserved. The analysis and opinions generated by fi360: (1) do not constitute professional investment advice; (2) are provided solely for informational purposes; (3) are not warranted or<br />
represented to be correct, complete, or accurate; and (4) are for the exclusive use of subscribers to fi360. The data source is © 2014 Morningstar, Inc. All rights reserved. The data contained herein: (1) is proprietary to Morningstar, Inc and/or its content providers; (2) may not be<br />
copied or distributed; and (3) is not warranted to be accurate, complete or timely. Neither Morningstar, Inc nor its content providers are responsible for any damages or losses arising from any use of this information. Past performance is no guarantee of future results.<br />
fi360_Landscape_v6_0<br />
Fund data as of 1/31/2014 | Holdings as of 01/31/2014
Prepared for: Fourth Ave. Associates 401k<br />
Page 19 of 19<br />
Analysis, search process, and layout are © 2000-2014, fi360, Inc. (www.fi360.com). All rights reserved. The analysis and opinions generated by fi360: (1) do not constitute professional investment advice; (2) are provided solely for informational purposes; (3) are not warranted or<br />
represented to be correct, complete, or accurate; and (4) are for the exclusive use of subscribers to fi360. The data source is © 2014 Morningstar, Inc. All rights reserved. The data contained herein: (1) is proprietary to Morningstar, Inc and/or its content providers; (2) may not be<br />
copied or distributed; and (3) is not warranted to be accurate, complete or timely. Neither Morningstar, Inc nor its content providers are responsible for any damages or losses arising from any use of this information. Past performance is no guarantee of future results.<br />
fi360_Landscape_v6_0<br />
Fund data as of 1/31/2014 | Holdings as of 01/31/2014


