404(a)(5) Participant Fee Disclosure - Fi360
404(a)(5) Participant Fee Disclosure - Fi360
404(a)(5) Participant Fee Disclosure - Fi360

You also want an ePaper? Increase the reach of your titles
YUMPU automatically turns print PDFs into web optimized ePapers that Google loves.
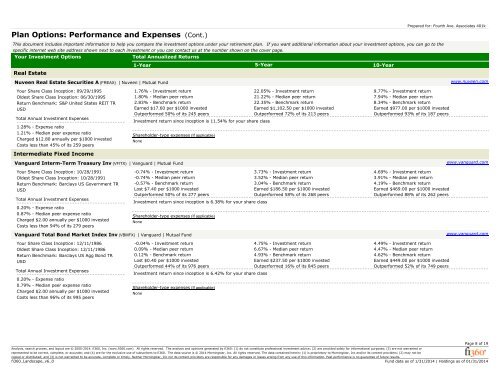
Plan Options: Performance and Expenses (Cont.)<br />
This document includes important information to help you compare the investment options under your retirement plan. If you want additional information about your investment options, you can go to the<br />
specific internet web site address shown next to each investment or you can contact us at the number shown on the cover page.<br />
Your Investment Options<br />
Total Annualized Returns<br />
Real Estate<br />
Nuveen Real Estate Securities A (FREAX) | Nuveen | Mutual Fund<br />
Your Share Class Inception: 09/29/1995<br />
Oldest Share Class Inception: 06/30/1995<br />
Return Benchmark: S&P United States REIT TR<br />
USD<br />
Total Annual Investment Expenses<br />
1.28% - Expense ratio<br />
1.21% - Median peer expense ratio<br />
Charged $12.80 annually per $1000 invested<br />
Costs less than 45% of its 259 peers<br />
Intermediate Fixed Income<br />
1-Year 5-Year 10-Year<br />
1.76% - Investment return<br />
1.80% - Median peer return<br />
2.83% - Benchmark return<br />
Earned $17.60 per $1000 invested<br />
Outperformed 50% of its 245 peers<br />
Investment return since inception is 11.54% for your share class<br />
Shareholder-type expenses (If applicable)<br />
None<br />
Vanguard Interm-Term Treasury Inv (VFITX) | Vanguard | Mutual Fund<br />
Your Share Class Inception: 10/28/1991<br />
Oldest Share Class Inception: 10/28/1991<br />
Return Benchmark: Barclays US Government TR<br />
USD<br />
Total Annual Investment Expenses<br />
0.20% - Expense ratio<br />
0.87% - Median peer expense ratio<br />
Charged $2.00 annually per $1000 invested<br />
Costs less than 94% of its 279 peers<br />
-0.74% - Investment return<br />
-0.74% - Median peer return<br />
-0.57% - Benchmark return<br />
Lost $7.40 per $1000 invested<br />
Outperformed 50% of its 277 peers<br />
Investment return since inception is 6.38% for your share class<br />
Shareholder-type expenses (If applicable)<br />
None<br />
Vanguard Total Bond Market Index Inv (VBMFX) | Vanguard | Mutual Fund<br />
Your Share Class Inception: 12/11/1986<br />
Oldest Share Class Inception: 12/11/1986<br />
Return Benchmark: Barclays US Agg Bond TR<br />
USD<br />
Total Annual Investment Expenses<br />
0.20% - Expense ratio<br />
0.79% - Median peer expense ratio<br />
Charged $2.00 annually per $1000 invested<br />
Costs less than 96% of its 995 peers<br />
-0.04% - Investment return<br />
0.09% - Median peer return<br />
0.12% - Benchmark return<br />
Lost $0.40 per $1000 invested<br />
Outperformed 44% of its 976 peers<br />
Investment return since inception is 6.42% for your share class<br />
Shareholder-type expenses (If applicable)<br />
None<br />
22.05% - Investment return<br />
21.22% - Median peer return<br />
22.35% - Benchmark return<br />
Earned $1,102.50 per $1000 invested<br />
Outperformed 72% of its 213 peers<br />
3.73% - Investment return<br />
3.52% - Median peer return<br />
3.04% - Benchmark return<br />
Earned $186.50 per $1000 invested<br />
Outperformed 58% of its 268 peers<br />
4.75% - Investment return<br />
6.67% - Median peer return<br />
4.93% - Benchmark return<br />
Earned $237.50 per $1000 invested<br />
Outperformed 16% of its 845 peers<br />
Prepared for: Fourth Ave. Associates 401k<br />
9.77% - Investment return<br />
7.94% - Median peer return<br />
8.34% - Benchmark return<br />
Earned $977.00 per $1000 invested<br />
Outperformed 93% of its 187 peers<br />
4.69% - Investment return<br />
3.91% - Median peer return<br />
4.19% - Benchmark return<br />
Earned $469.00 per $1000 invested<br />
Outperformed 88% of its 262 peers<br />
4.49% - Investment return<br />
4.47% - Median peer return<br />
4.62% - Benchmark return<br />
Earned $449.00 per $1000 invested<br />
Outperformed 52% of its 749 peers<br />
www.nuveen.com<br />
www.vanguard.com<br />
www.vanguard.com<br />
Analysis, search process, and layout are © 2000-2014, fi360, Inc. (www.fi360.com). All rights reserved. The analysis and opinions generated by fi360: (1) do not constitute professional investment advice; (2) are provided solely for informational purposes; (3) are not warranted or<br />
represented to be correct, complete, or accurate; and (4) are for the exclusive use of subscribers to fi360. The data source is © 2014 Morningstar, Inc. All rights reserved. The data contained herein: (1) is proprietary to Morningstar, Inc and/or its content providers; (2) may not be<br />
copied or distributed; and (3) is not warranted to be accurate, complete or timely. Neither Morningstar, Inc nor its content providers are responsible for any damages or losses arising from any use of this information. Past performance is no guarantee of future results.<br />
fi360_Landscape_v6_0<br />
Fund data as of 1/31/2014 | Holdings as of 01/31/2014<br />
Page 8 of 19