404(a)(5) Participant Fee Disclosure - Fi360
404(a)(5) Participant Fee Disclosure - Fi360
404(a)(5) Participant Fee Disclosure - Fi360

Create successful ePaper yourself
Turn your PDF publications into a flip-book with our unique Google optimized e-Paper software.
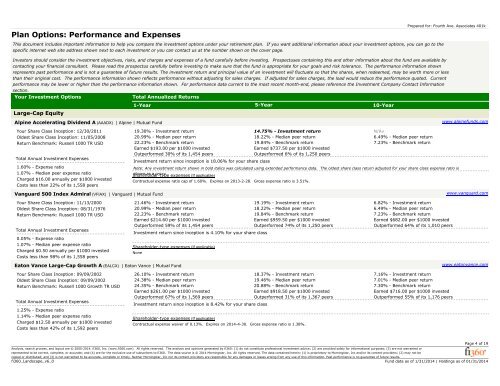
Plan Options: Performance and Expenses<br />
This document includes important information to help you compare the investment options under your retirement plan. If you want additional information about your investment options, you can go to the<br />
specific internet web site address shown next to each investment or you can contact us at the number shown on the cover page.<br />
Prepared for: Fourth Ave. Associates 401k<br />
Investors should consider the investment objectives, risks, and charges and expenses of a fund carefully before investing. Prospectuses containing this and other information about the fund are available by<br />
contacting your financial consultant. Please read the prospectus carefully before investing to make sure that the fund is appropriate for your goals and risk tolerance. The performance information shown<br />
represents past performance and is not a guarantee of future results. The investment return and principal value of an investment will fluctuate so that the shares, when redeemed, may be worth more or less<br />
than their original cost. The performance information shown reflects performance without adjusting for sales charges. If adjusted for sales charges, the load would reduce the performance quoted. Current<br />
performance may be lower or higher than the performance information shown. For performance data current to the most recent month-end, please reference the Investment Company Contact Information<br />
section.<br />
Your Investment Options<br />
Total Annualized Returns<br />
Large-Cap Equity<br />
Alpine Accelerating Dividend A (AAADX) | Alpine | Mutual Fund<br />
Your Share Class Inception: 12/30/2011<br />
Oldest Share Class Inception: 11/05/2008<br />
Return Benchmark: Russell 1000 TR USD<br />
Total Annual Investment Expenses<br />
1.60% - Expense ratio<br />
1.07% - Median peer expense ratio<br />
Charged $16.00 annually per $1000 invested<br />
Costs less than 22% of its 1,558 peers<br />
Vanguard 500 Index Admiral (VFIAX) | Vanguard | Mutual Fund<br />
Your Share Class Inception: 11/13/2000<br />
Oldest Share Class Inception: 08/31/1976<br />
Return Benchmark: Russell 1000 TR USD<br />
Total Annual Investment Expenses<br />
0.05% - Expense ratio<br />
1.07% - Median peer expense ratio<br />
Charged $0.50 annually per $1000 invested<br />
Costs less than 98% of its 1,558 peers<br />
1-Year 5-Year 10-Year<br />
19.30% - Investment return<br />
20.99% - Median peer return<br />
22.23% - Benchmark return<br />
Earned $193.00 per $1000 invested<br />
Outperformed 30% of its 1,454 peers<br />
Investment return since inception is 18.06% for your share class<br />
14.75% - Investment return<br />
18.22% - Median peer return<br />
19.84% - Benchmark return<br />
Earned $737.50 per $1000 invested<br />
Outperformed 6% of its 1,250 peers<br />
N/Av<br />
6.49% - Median peer return<br />
7.23% - Benchmark return<br />
Note: Any investment return shown in bold italics was calculated using extended performance data. The oldest share class return adjusted for your share class expense ratio is<br />
shown as a proxy.<br />
Shareholder-type expenses (If applicable)<br />
Contractual expense ratio cap of 1.60%. Expires on 2013-2-28. Gross expense ratio is 3.51%.<br />
21.46% - Investment return<br />
20.99% - Median peer return<br />
22.23% - Benchmark return<br />
Earned $214.60 per $1000 invested<br />
Outperformed 59% of its 1,454 peers<br />
Investment return since inception is 4.10% for your share class<br />
Shareholder-type expenses (If applicable)<br />
None<br />
Eaton Vance Large-Cap Growth A (EALCX) | Eaton Vance | Mutual Fund<br />
Your Share Class Inception: 09/09/2002<br />
Oldest Share Class Inception: 09/09/2002<br />
Return Benchmark: Russell 1000 Growth TR USD<br />
Total Annual Investment Expenses<br />
1.25% - Expense ratio<br />
1.14% - Median peer expense ratio<br />
Charged $12.50 annually per $1000 invested<br />
Costs less than 42% of its 1,592 peers<br />
26.10% - Investment return<br />
24.38% - Median peer return<br />
24.35% - Benchmark return<br />
Earned $261.00 per $1000 invested<br />
Outperformed 67% of its 1,569 peers<br />
Investment return since inception is 8.42% for your share class<br />
Shareholder-type expenses (If applicable)<br />
19.19% - Investment return<br />
18.22% - Median peer return<br />
19.84% - Benchmark return<br />
Earned $959.50 per $1000 invested<br />
Outperformed 74% of its 1,250 peers<br />
18.37% - Investment return<br />
19.46% - Median peer return<br />
20.88% - Benchmark return<br />
Earned $918.50 per $1000 invested<br />
Outperformed 31% of its 1,367 peers<br />
Contractual expense waiver of 0.13%. Expires on 2014-4-30. Gross expense ratio is 1.38%.<br />
6.82% - Investment return<br />
6.49% - Median peer return<br />
7.23% - Benchmark return<br />
Earned $682.00 per $1000 invested<br />
Outperformed 64% of its 1,010 peers<br />
7.16% - Investment return<br />
7.01% - Median peer return<br />
7.30% - Benchmark return<br />
Earned $716.00 per $1000 invested<br />
Outperformed 55% of its 1,176 peers<br />
www.alpinefunds.com<br />
www.vanguard.com<br />
www.eatonvance.com<br />
Analysis, search process, and layout are © 2000-2014, fi360, Inc. (www.fi360.com). All rights reserved. The analysis and opinions generated by fi360: (1) do not constitute professional investment advice; (2) are provided solely for informational purposes; (3) are not warranted or<br />
represented to be correct, complete, or accurate; and (4) are for the exclusive use of subscribers to fi360. The data source is © 2014 Morningstar, Inc. All rights reserved. The data contained herein: (1) is proprietary to Morningstar, Inc and/or its content providers; (2) may not be<br />
copied or distributed; and (3) is not warranted to be accurate, complete or timely. Neither Morningstar, Inc nor its content providers are responsible for any damages or losses arising from any use of this information. Past performance is no guarantee of future results.<br />
fi360_Landscape_v6_0<br />
Fund data as of 1/31/2014 | Holdings as of 01/31/2014<br />
Page 4 of 19