Demo problem: Turek & Hron's FSI benchmark problem - Oomph-lib
Demo problem: Turek & Hron's FSI benchmark problem - Oomph-lib
Demo problem: Turek & Hron's FSI benchmark problem - Oomph-lib

Create successful ePaper yourself
Turn your PDF publications into a flip-book with our unique Google optimized e-Paper software.
4 <strong>Demo</strong> <strong>problem</strong>: <strong>Turek</strong> & Hron’s <strong>FSI</strong> <strong>benchmark</strong> <strong>problem</strong><br />
1.3 Results<br />
The test cases <strong>FSI</strong>2 and <strong>FSI</strong>3 are the most interesting because the system develops large-amplitude selfexcited<br />
oscillations<br />
1.3.1 <strong>FSI</strong>2<br />
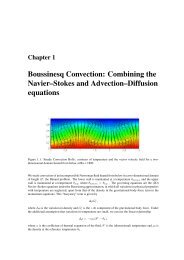
Following an initial transient period the system settles into large-amplitude self-excited oscillations during<br />
which the oscillating flag generates a regular vortex pattern that is advected along the channel. This is<br />
illustrated in the figure below which shows a snapshot of the flow field (pressure contours and instantaneous<br />
streamlines) at t = 6.04.<br />
Figure 1.3: Snapshot of the flow field (instantaenous streamlines and pressure contours)<br />
The constantly adapted mesh contains and average of 65,000 degrees of freedom. A relatively large<br />
timestep of ∆t = 0.01 – corresponding to about 50 timesteps per period of the oscillation – was used<br />
in this computation. With this discretisation the system settles into oscillations with a period of ≈ 0.52 and<br />
an amplitude of the tip-displacement of 0.01 ± 0.83.<br />
Figure 1.4: Time trace of the tip displacement.<br />
1.3.2 <strong>FSI</strong>3<br />
The figures below shows the corresponding results for the case <strong>FSI</strong>3 in which the fluid and solid densities<br />
are equal and the Reynolds number twice as large as in the <strong>FSI</strong>2 case. The system performs oscillations<br />
of much higher frequency and smaller amplitude. This is illustrated in the figure below which shows a<br />
snapshot of the flow field (pressure contours and instantaneous streamlines) at t = 3.615.<br />
Generated on Mon Aug 10 11:44:25 2009 by Doxygen