The Housing & Mortgage Market Review ... - PMI Group, Inc.
The Housing & Mortgage Market Review ... - PMI Group, Inc.
The Housing & Mortgage Market Review ... - PMI Group, Inc.

Create successful ePaper yourself
Turn your PDF publications into a flip-book with our unique Google optimized e-Paper software.
ISSUE 12 VOLUME 4 Dec 2011<br />
Inside this Issue<br />
• <strong>The</strong> Outlook<br />
• Special Topic:<br />
<strong>The</strong> Relationship<br />
between <strong>Housing</strong><br />
Demand and Jobs<br />
• <strong>Housing</strong> <strong>Market</strong><br />
Indicators<br />
• <strong>Mortgage</strong> <strong>Market</strong><br />
Indicators<br />
• Regional Roundup<br />
• Region in Focus:<br />
<strong>The</strong> Midwest<br />
• <strong>The</strong> <strong>PMI</strong> Forecast<br />
Contributors<br />
• David W. Berson, Ph.D.<br />
Chief Economist and<br />
Strategist<br />
• Ralph DeFranco, Ph.D.<br />
Senior Director of<br />
Economics<br />
• Brett G. Soares,<br />
Economic Analyst<br />
• Melanie Postich,<br />
Executive Assistant II<br />
<strong>The</strong> Outlook<br />
<strong>PMI</strong> MORTGAGE INSURANCE CO’S MONTHLY ANALYSIS OF<br />
ECONOMIC, HOUSING, AND MORTGAGE MARKET CONDITIONS<br />
Once again, most measures of economic activity accelerated over the past month and it now looks as if<br />
real GDP growth in the fourth quarter will be around 3.0 percent – the strongest pace in more than a<br />
year. <strong>The</strong> severe sovereign debt problems plaguing the Eurozone nations remain, however. While there<br />
has been some progress toward a solution, this is still the key risk to the outlook. As a result, the odds of<br />
a downturn in the U.S. economy are around 20-30 percent. Moreover, low business/consumer confidence,<br />
household deleveraging, significant borrowing constraints, and an overhang of distressed housing units<br />
remain impediments to a more normal economic expansion. Still, growth in the U.S. appears to be<br />
moving modestly upward toward trend rates, but it will probably take at least some rebound in the<br />
housing market for growth to move sustainably above trend.<br />
Most of the data in the November employment report were positive and point to a continued modest<br />
improvement in the job market.<br />
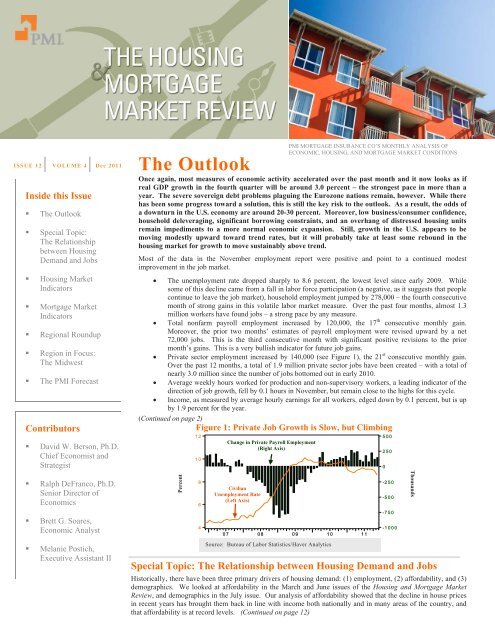
• <strong>The</strong> unemployment rate dropped sharply to 8.6 percent, the lowest level since early 2009. While<br />
some of this decline came from a fall in labor force participation (a negative, as it suggests that people<br />
continue to leave the job market), household employment jumped by 278,000 – the fourth consecutive<br />
month of strong gains in this volatile labor market measure. Over the past four months, almost 1.3<br />
million workers have found jobs – a strong pace by any measure.<br />
• Total nonfarm payroll employment increased by 120,000, the 17 th consecutive monthly gain.<br />
Moreover, the prior two months’ estimates of payroll employment were revised upward by a net<br />
72,000 jobs. This is the third consecutive month with significant positive revisions to the prior<br />
month’s gains. This is a very bullish indicator for future job gains.<br />
• Private sector employment increased by 140,000 (see Figure 1), the 21 st consecutive monthly gain.<br />
Over the past 12 months, a total of 1.9 million private sector jobs have been created – with a total of<br />
nearly 3.0 million since the number of jobs bottomed out in early 2010.<br />
• Average weekly hours worked for production and non-supervisory workers, a leading indicator of the<br />
direction of job growth, fell by 0.1 hours in November, but remain close to the highs for this cycle.<br />
• <strong>Inc</strong>ome, as measured by average hourly earnings for all workers, edged down by 0.1 percent, but is up<br />
by 1.9 percent for the year.<br />
(Continued on page 2)<br />
Figure 1: Private Job Growth is Slow, but Climbing<br />
Percent<br />
12<br />
10<br />
8<br />
6<br />
4<br />
07<br />
Change in Private Payroll Employment<br />
(Right Axis)<br />
Civilian<br />
Unemployment Rate<br />
(Left Axis)<br />
08<br />
Source: Bureau of Labor Statistics/Haver Analytics<br />
Special Topic: <strong>The</strong> Relationship between <strong>Housing</strong> Demand and Jobs<br />
09<br />
Historically, there have been three primary drivers of housing demand: (1) employment, (2) affordability, and (3)<br />
demographics. We looked at affordability in the March and June issues of the <strong>Housing</strong> and <strong>Mortgage</strong> <strong>Market</strong><br />
<strong>Review</strong>, and demographics in the July issue. Our analysis of affordability showed that the decline in house prices<br />
in recent years has brought them back in line with income both nationally and in many areas of the country, and<br />
that affordability is at record levels. (Continued on page 12)<br />
10<br />
11<br />
500<br />
250<br />
0<br />
-250<br />
-500<br />
-750<br />
-1000<br />
Thousands
<strong>The</strong> Outlook (Continued from cover page)<br />
As we noted last month, the strong pickup in employment from the<br />
household survey may be a leading indicator of better gains in the payroll<br />
numbers. With four months of strong gains, the evidence is improving but<br />
another couple of months would be more conclusive. Part of the reason for<br />
the leading-indicator nature of the household survey is that it better captures<br />
newer and smaller firms that the payroll survey initially misses. <strong>The</strong> most<br />
recent figures from the National Federation for Independent Business (NFIB,<br />
the trade association for small firms) suggest that the job market for small<br />
businesses is improving. If that continues, then we should continue to see<br />
strong household employment increases – which will eventually be captured<br />
in the monthly payroll employment figures.<br />
Much of the other economic data released over the past month has also been<br />
positive. Retail sales rose by 0.5 percent in October and are up by 7.3<br />
percent over the past 12 months. Strikingly, light vehicle sales (autos and<br />
light trucks, including pickups and SUVs) increased to a 13.6 million unit<br />
annualized pace in November – the strongest sales pace (other than the one<br />
month of “cash for clunkers”) since the bottom fell out of the economy in<br />
mid-2008 (see Figure 2). This bodes well for another strong gain in retail<br />
sales for November. Measures of consumer confidence also were positive,<br />
with the November Conference Board index jumping by the largest onemonth<br />
increase since 2003.<br />
Manufacturing continues to help boost the overall economy as well, with the<br />
Institute of Supply Management’s (ISM) manufacturing survey index<br />
climbing to the highest level in five months in November. More<br />
importantly, the orders component of the ISM survey – which can be viewed<br />
as a leading indicator of the overall index – rose sharply in November and<br />
has moved above the total index, suggesting that the ISM index will rise<br />
further in coming months (at least if orders stay strong – see Figure 3).<br />
Unless something bad happens in Europe, it is unlikely that the U.S.<br />
economy will slip into recession. Moreover, the stronger readings from<br />
much of the recent economic data suggest that the economy is<br />
accelerating. Unless housing activity picks up, however, there is a limit<br />
to how much more rapidly the economy can expand. But with the<br />
pickup in job growth, better demographics, and continued record-low<br />
mortgage rates, leading indicators of home sales look better – and if<br />
they lead to stronger housing activity, they could allow even faster<br />
economic growth in 2012. In fact, the economy may be facing a<br />
trifurcated outlook: (1) very slow growth, and perhaps recession, if the<br />
sovereign debt problems of Europe mushroom; (2) modest-to-trend<br />
growth if housing remains stable at current weak levels and Europe’s<br />
debt problems don’t worsen further; and (3) modestly above-trend<br />
growth if housing begins to rebound and Europe is OK. Even if<br />
everything goes well, there are still impediments that will hold down<br />
economic activity, so the odds of strong economic growth (as we would<br />
usually see coming out of a downturn) are still low.<br />
<strong>Housing</strong>: Current housing activity remains relatively stable at low levels,<br />
but leading indicators have improved. New home sales edged up by 1.3<br />
percent in October to 307,000 units (seasonally adjusted annual rate, or<br />
SAAR), after a downward revision in September – but the data over the past<br />
year have been remarkably stable, showing little trend. Total existing home<br />
sales (single-family plus condominiums), which are a lagging indicator of<br />
buying activity since they are counted when purchase contracts are closed,<br />
rose by 1.4 percent in October to 4.97 million units (SAAR). While existing<br />
sales have been somewhat more volatile than new sales over the past year,<br />
they also haven’t exhibited much trend over that period. <strong>Housing</strong> starts<br />
edged down by a miniscule 0.3 percent in October to 628,000 units (SAAR),<br />
although the prior month was revised down by 4.3 percent. While singlefamily<br />
starts climbed by 3.9 percent, the volatile multifamily sector dropped<br />
by 8.3 percent – after a 35 percent pop in the prior month.<br />
Leading indicators of home sales were up strongly over the past month. <strong>The</strong><br />
National Association of Realtors’ (NAR) pending home sales index had one<br />
of the largest one-month gains in the short history of the survey, jumping to<br />
the highest level of the year. <strong>The</strong>re has been significant fallout of potential<br />
buyers over the past year – perhaps caused by buyers who didn’t qualify for<br />
a mortgage after signing a purchase contract, or who pulled out of the<br />
contract when appraised values fell short. As a result, caution needs to be<br />
exercised with respect to the rise in pending sales. <strong>The</strong> National Association<br />
of Homebuilders’ (NAHB) housing market index continued its recent<br />
upward move, climbing in November to the highest level since the second<br />
homebuyer tax credit was in effect in early 2010. <strong>The</strong> absolute level of the<br />
index remains low, however, as the new home sales market continues to face<br />
significant competition from distressed properties. Finally, the purchase<br />
applications component of the <strong>Mortgage</strong> Bankers Association’s (MBA)<br />
weekly applications survey jumped in the second half of November to the<br />
highest levels since April. Taken together, these indicators suggest that<br />
home sales should improve in coming months, but further increases in these<br />
indicators would be a stronger signal.<br />
Measures of house prices were mostly lower over the past month, with<br />
seasonal factors starting to hurt prices. <strong>The</strong> median price of existing homes<br />
sold fell by 2.0 percent in October, down by 4.8 percent from a year earlier.<br />
<strong>The</strong> monthly 20-city S&P/Case-Shiller repeat-transaction house price index<br />
(HPI), which doesn’t suffer from the change in the mix of homes sold<br />
problems of median and average price measures, slipped by 0.6 percent in<br />
September – its first decline in six months. (Continued on page 3)<br />
Figure 2: Light Vehicle Sales at Strongest Pace<br />
since Cash for Clunkers<br />
Figure 3: Manufacturing Continues to Boost<br />
Economy<br />
Million Units, SAAR<br />
18<br />
16<br />
14<br />
12<br />
10<br />
18<br />
16<br />
14<br />
12<br />
10<br />
Million Units, SAAR<br />
Index, 50+ = Econ Expanding<br />
70<br />
60<br />
50<br />
40<br />
30<br />
New Orders<br />
Total<br />
Manufacturing<br />
70<br />
60<br />
50<br />
40<br />
30<br />
Index, 50+ = Econ Expanding<br />
8<br />
07<br />
08<br />
09<br />
10<br />
11<br />
8<br />
20<br />
07<br />
08<br />
09<br />
10<br />
11<br />
20<br />
Source: Autodata / Haver Analytics<br />
Source: Institute for Supply Management / Haver Analytics<br />
Page 2
<strong>The</strong> Outlook (Continued from page 2)<br />
This measure of house values is down by 3.6 percent from a year earlier.<br />
<strong>The</strong> CoreLogic HPI (including distressed sales) fell by 1.1 percent in<br />
September, the second consecutive monthly drop as seasonal factors helped<br />
to push it down. Excluding distressed sales, however, the CoreLogic HPI<br />
continued to move upward, rising by 0.3 percent in September, despite<br />
unfavorable seasonal factors. <strong>The</strong> value of non-distressed homes is down by<br />
only 1.1 percent from year-ago levels. Finally, the monthly purchase-only<br />
HPI from the Federal <strong>Housing</strong> Finance Agency surprisingly jumped by 0.9<br />
percent in September on a seasonally adjusted basis, and is down by 2.2<br />
percent from year-ago levels.<br />
Home sales have been roughly flat for the past year, as the modest gains<br />
in the economy and job market (along with record-high levels of<br />
affordability) have not been able to offset the effects of extremely tight<br />
underwriting, large numbers of underwater borrowers, and concerns<br />
about future house price declines. That may be changing, however, as<br />
the job market is strengthening, consumer confidence is rising, and<br />
household formations are finally accelerating (see Figure 4). <strong>The</strong><br />
impediments remain in place, so even if jobs, confidence, and<br />
demographics improve, potential gains in housing demand are likely to<br />
be modest in the near term. Still, the recent economic data are more<br />
positive and leading indicators of home sales are responding. It is too<br />
soon to say that housing trends are finally moving upward, but if the<br />
economic data continue upward, then housing activity should be<br />
somewhat stronger in 2012. We expect home sales to increase by 7.1<br />
percent next year, the best performance since 2004. In addition, we<br />
project house values to be up a smidge in 2012, which would be the first<br />
time since 2006 that values didn’t decline on a year-over-year basis.<br />
Trend increases in house values (3-4 percent annual gains) are still<br />
probably several years away, however.<br />
Interest Rates and Financial <strong>Market</strong>s: Despite signs of stronger economic<br />
growth, interest rates in the U.S. remain historically low as the Federal<br />
Reserve continues its zero interest rate policy (ZIRP) and concerns with the<br />
stability of the European Union (E.U.) cause repeated flights to quality into<br />
safe assets – most notably U.S. Treasury securities. This increased<br />
uncertainty in financial markets has caused credit spreads to widen over the<br />
past few months, and measures of market volatility have increased. Equity<br />
prices have also been affected, with significant moves both up and down as<br />
news from the E.U. is either better or worse – depending on the day.<br />
<strong>The</strong> Fed, along with other major central banks, has recently moved to<br />
improve liquidity in the E.U. so that European banks continue to have access<br />
to U.S. dollar-denominated funds. This is yet another way in which the<br />
world’s central banks have loosened monetary policy, and there is little risk<br />
of that changing in the near-term. Indeed, any additional signs of economic<br />
slowing or financial market distress will almost certainly lead to further nontraditional<br />
central bank easing. It is possible that the Fed will conduct yet<br />
another round of quantitative easing (this would be QE III), purchasing<br />
longer-term Treasury securities along with mortgage-backed securities. If<br />
economic activity continues to accelerate, however, then the odds of QE III<br />
will decline. It is also possible that the Fed could move to ease further in<br />
response to fiscal tightening in 2012, in order to keep economic activity from<br />
slipping.<br />
Short-term interest rates that were unimaginably low just a few years<br />
ago appear likely to remain so at least into 2013. Even with moderately<br />
faster economic growth in 2012, we don’t expect any Fed tightening<br />
until the middle of 2013. How quickly the Fed moves then will depend<br />
upon the pace of economic growth and inflation and how concerned the<br />
Fed is about the potential for the economy to stall given the tightening of<br />
policy. But it is the case that a 0 percent federal funds rate is not<br />
sustainable – while something closer to 4 percent is. Long-term rates<br />
should slowly edge upward over the next year as economic activity picks<br />
up a bit more speed, but any increases should be modest. By the end of<br />
next year, we project that the yield on the 10-year Treasury note will<br />
climb to around 3.00 percent – still a historically low rate, but up by less<br />
than 100 basis points from today. By the end of 2013, with continued<br />
economic growth, it should still be less than 4.00 percent – but closer to<br />
its long-term sustainable level of 4.50-5.00 percent.<br />
<strong>Mortgage</strong> <strong>Market</strong>s: While not quite at their lows for this cycle, yields on<br />
30-year fixed-rate mortgages (FRMs) are around 4.00 percent – essentially<br />
the lowest levels in the post-war period. Yields on 1-year Treasury-indexed<br />
adjustable-rate mortgages (ARMs) have dropped to their lowest levels ever<br />
in the past few weeks, as have yields on the most common type of<br />
intermediate-term ARMs (those fixed for five years before becoming<br />
annually adjustable). It is likely that mortgage rates will remain near historic<br />
lows for a while, although FRM rates may edge upward a bit in 2012 as<br />
other long-term rates move modestly higher.<br />
Although applications for the refinancing of existing mortgage loans have<br />
increased as a result of the record-low mortgage rates in recent months, the<br />
rise has been surprisingly small. Indeed, a lesser drop in mortgage rates last<br />
year resulted in a bigger increase in refinancing activity. Why this only<br />
modest pickup in refinancings in response to the drop in mortgage rates? It’s<br />
hard to know for sure, but FRM rates are only about 25-35 basis points lower<br />
today than they were at their lows in 2010 – so they may not be low enough<br />
to make it worth the time and expense to refinance. Additionally, further<br />
declines in house values have resulted in more underwater (or nearunderwater)<br />
mortgages – and thus have reduced the number of potential<br />
refinancers. Finally, the continued ratcheting up of credit standards and fees<br />
in order to qualify for a mortgage have made it increasingly difficult for even<br />
credit-worthy households to get a loan – including those who want to<br />
refinance. As a result of these factors, we don’t expect refinance activity to<br />
increase, unless mortgage rates fall meaningfully further.<br />
Our forecast of mortgage originations for 2011 is unchanged from last<br />
month at $1.30 trillion – down by almost 20 percent from 2010. We<br />
estimate that about 69 percent of mortgage originations this year will<br />
come from refinancings, as mortgage rates have declined to record lows.<br />
Our forecast for 2012 mortgage originations is also unchanged from our<br />
prior estimate, with more balance between purchase and refinance. At<br />
$1.01 trillion, total originations would fall by an additional 22 percent<br />
from this year’s level, with refi activity falling sharply as mortgage rates<br />
finally start to edge upward. Despite the sharp decline in total<br />
originations, stronger home sales, modest increases in house prices, and<br />
perhaps slightly easier underwriting standards should allow purchase<br />
originations to climb by about 25 percent.<br />
Annual Change in Households<br />
3000<br />
2500<br />
2000<br />
1500<br />
1000<br />
Figure 4: Household Formations are Accelerating<br />
(Thousands)<br />
500<br />
0<br />
95<br />
00<br />
Source: Census Bureau / Haver Analytics<br />
05<br />
10<br />
3000<br />
2500<br />
2000<br />
1500<br />
1000<br />
500<br />
0<br />
Annual Change in Households<br />
Page 3
<strong>Housing</strong> <strong>Market</strong> Indicators<br />
HOME SALES<br />
( THOUSANDS OF UNITS)<br />
MEDIAN HOME PRICES<br />
($)<br />
6750<br />
6000<br />
Total Existing<br />
(Left Axis)<br />
1200<br />
1000<br />
240000<br />
220000<br />
Total Existing<br />
(Left Axis)<br />
280000<br />
260000<br />
800<br />
200000<br />
5250<br />
240000<br />
600<br />
180000<br />
4500<br />
3750<br />
New<br />
(Right Axis)<br />
07<br />
08<br />
09<br />
10<br />
11<br />
400<br />
200<br />
160000<br />
140000<br />
07<br />
New<br />
(Right Axis)<br />
08<br />
09<br />
10<br />
11<br />
220000<br />
200000<br />
Source: National Association of Realtors/ Census Bureau/ Haver Analytics<br />
Source: National Association of Realtors/ Census Bureau/ Haver Analytics<br />
% Change Existing New<br />
Oct-10 to Oct-11 13.5 8.9<br />
Sept-11 to Oct-11 1.4 1.3<br />
% Change Existing New<br />
Oct-10 to Oct-11 -4.8 4.0<br />
Sept-11 to Oct-11 -2.0 -0.5<br />
NOTES:<br />
• Sales of both new and existing homes have stabilized, but new sales remain exceptionally low.<br />
• Median house prices are declining in line with normal seasonal patterns.<br />
• Months’ Supply, a leading indicator of prices, is clearly improving, but remains elevated.<br />
14<br />
12<br />
MONTHS’ SUPPLY OF HOMES<br />
Total Existing<br />
14<br />
12<br />
400<br />
300<br />
HOUSING STARTS<br />
(THOUSANDS OF UNITS)<br />
Multifamily<br />
(Left Axis)<br />
1400<br />
1200<br />
1000<br />
10<br />
10<br />
200<br />
800<br />
600<br />
8<br />
New<br />
8<br />
100<br />
Single-Family<br />
(Right Axis)<br />
400<br />
6<br />
07<br />
08<br />
09<br />
10<br />
11<br />
6<br />
0<br />
07<br />
08<br />
09<br />
10<br />
11<br />
200<br />
Source: National Association of Realtors/ Census Bureau /Haver Analytics<br />
Months Existing New<br />
October 2010 10.6 8.5<br />
October 2011 8.0 6.3<br />
Source: U.S. Census Bureau / Haver Analytics<br />
% Change<br />
Single<br />
Family<br />
Multi<br />
Family<br />
Oct-10 to Oct-11 -0.9 88.6<br />
Sept-11 to Oct-11 3.9 -8.3<br />
Page 4
<strong>Mortgage</strong> <strong>Market</strong> Indicators<br />
MORTGAGE APPLICATIONS<br />
(INDEX: MARCH 16, 1990 = 100)<br />
MORTGAGE RATES<br />
(%)<br />
8000<br />
525<br />
6.75<br />
6.75<br />
6000<br />
Refinance<br />
(Left Axis)<br />
450<br />
6.00<br />
30-Year<br />
Fixed Rate<br />
6.00<br />
5.25<br />
5.25<br />
4000<br />
Purchase<br />
(Right Axis)<br />
375<br />
300<br />
4.50<br />
3.75<br />
1-Year<br />
Adjustable<br />
Rate<br />
4.50<br />
3.75<br />
2000<br />
225<br />
3.00<br />
3.00<br />
0<br />
150<br />
2.25<br />
2.25<br />
07<br />
08<br />
09<br />
10<br />
11<br />
07<br />
08<br />
09<br />
10<br />
11<br />
Source: <strong>Mortgage</strong> Bankers Association / Haver Analytics<br />
Source: Freddie Mac / Haver Analytics<br />
% Change Purchase Refinance<br />
Nov-10 to Nov-11 -4.2 -10.3<br />
Oct-11 to Nov-11 9.2 -6.4<br />
Percent<br />
30-Year<br />
Fixed<br />
1-Year<br />
Adjustable<br />
November 2010 4.30 3.25<br />
November 2011 3.99 2.90<br />
NOTES:<br />
• <strong>Mortgage</strong> rates are at post-war lows, encouraging relatively stronger mortgage application activity.<br />
• <strong>Mortgage</strong> applications for home purchases have jumped to the highest levels since last April.<br />
• New delinquencies continue to slowly drop, but the foreclosure inventory remains high.<br />
REFI/ARM SHARES<br />
(%)<br />
DELINQUENT MORTGAGE LOANS<br />
(SHARE OF MORTGAGES, %)<br />
24<br />
20<br />
ARM Share<br />
(Left Axis)<br />
Refinance Share<br />
(Right Axis)<br />
90<br />
80<br />
5.25<br />
4.50<br />
─ Foreclosure Inventory<br />
─ 90+ Days Delinquent<br />
─ 60-89 Days Delinquent<br />
5.25<br />
4.50<br />
16<br />
70<br />
3.75<br />
3.75<br />
12<br />
60<br />
3.00<br />
3.00<br />
8<br />
50<br />
2.25<br />
2.25<br />
4<br />
40<br />
1.50<br />
1.50<br />
0<br />
07<br />
08<br />
09<br />
10<br />
11<br />
30<br />
0.75<br />
07<br />
08<br />
09<br />
10<br />
11<br />
0.75<br />
Source: <strong>Mortgage</strong> Bankers Association / Haver Analytics<br />
Source: <strong>Mortgage</strong> Bankers Association / Haver Analytics<br />
Percent Refinance ARM<br />
November 2010 78.9 5.4<br />
November 2011 76.4 5.9<br />
Percent<br />
Foreclosure<br />
Inventory<br />
90+ Days<br />
Delinquent<br />
60-89 Days<br />
Delinquent<br />
3 rd Quarter 2010 4.39 4.34 1.44<br />
3 rd Quarter 2011 4.43 3.50 1.30<br />
Page 5
Regional Roundup<br />
Source: Bureau of Labor Statistics / Haver Analytics<br />
12-MONTH CHANGE IN PAYROLL EMPLOYMENT<br />
OCTOBER 2011<br />
-0.9% to 0.0%<br />
0.0% to 1.0%<br />
1.0% to 2.0%<br />
2.0% to 4.9%<br />
Georgia -0.9% Mississippi 1.0%<br />
Indiana -0.4% South Carolina 1.0%<br />
Arkansas -0.1% Hawaii 1.0%<br />
Delaware 0.0% Kentucky 1.1%<br />
Rhode Island 0.0% New Hampshire 1.1%<br />
Missouri 0.0% Illinois 1.1%<br />
District of Columbia 0.1% Nevada 1.1%<br />
Alabama 0.2% United States 1.1%<br />
Wisconsin 0.2% Ohio 1.3%<br />
Maine 0.3% Michigan 1.3%<br />
North Carolina 0.3% Florida 1.3%<br />
Kansas 0.3% Colorado 1.5%<br />
Maryland 0.4% Oregon 1.5%<br />
South Dakota 0.4% Washington 1.5%<br />
New Jersey 0.6% Massachusetts 1.6%<br />
New Mexico 0.6% Vermont 1.7%<br />
Connecticut 0.6% California 1.7%<br />
West Virginia 0.6% Wyoming 1.7%<br />
Virginia 0.7% Arizona 1.9%<br />
Minnesota 0.7% Montana 1.9%<br />
New York 0.7% Nebraska 2.0%<br />
Alaska 0.7% Texas 2.2%<br />
Idaho 0.7% Louisiana 2.3%<br />
Iowa 0.9% Utah 2.6%<br />
Tennessee 0.9% Oklahoma 3.1%<br />
Pennsylvania 1.0% North Dakota 4.9%<br />
NOTES:<br />
• Payroll employment continues to improve, except in five states, where it has declined or is unchanged over the past year.<br />
• House price growth, including distressed sales, varies dramatically by state, with 16 states having year-over-year growth.<br />
• House price declines remain widespread, with the worst declines in the West, parts of the manufacturing belt (but not Michigan), Georgia and<br />
Rhode Island.<br />
12-MONTH GROWTH IN HOUSE PRICES<br />
OCTOBER 2011<br />
Page 6<br />
-12.5% to -10.0%<br />
-10.0% to -5.0%<br />
-5.0% to 0.0%<br />
0.0% to 4.8%<br />
Source: CoreLogic<br />
Note: Single-family detached + single-family attached including distressed sales<br />
Nevada -12.1% Hawaii -1.2%<br />
Illinois -9.4% Colorado -1.2%<br />
Arizona -8.1% Maine -1.0%<br />
Minnesota -7.9% Montana -0.9%<br />
Georgia -7.3% Maryland -0.8%<br />
Rhode Island -6.8% New Jersey -0.8%<br />
Idaho -6.5% North Carolina -0.6%<br />
California -6.3% Tennessee -0.2%<br />
Utah -6.1% Arkansas -0.1%<br />
New Mexico -6.1% Iowa 0.0%<br />
Ohio -6.1% Virginia 0.1%<br />
Delaware -5.4% Oklahoma 0.1%<br />
Washington -5.0% Pennsylvania 0.6%<br />
Connecticut -4.5% Wyoming 0.8%<br />
Wisconsin -4.2% Indiana 0.9%<br />
United States -3.9% North Dakota 1.2%<br />
Massachusetts -3.9% Vermont 1.6%<br />
Alabama -3.7% South Carolina 1.7%<br />
Missouri -3.7% Nebraska 1.9%<br />
New Hampshire -3.5% Mississippi 2.0%<br />
Florida -3.4% Alaska 2.0%<br />
Oregon -3.1% Kansas 2.1%<br />
Louisiana -2.5% District of Columbia 2.4%<br />
Kentucky -2.2% New York 3.0%<br />
Texas -1.6% South Dakota 3.2%<br />
Michigan -1.4% West Virginia 4.8%
Source: <strong>Mortgage</strong> Bankers Association / Haver Analytics<br />
SHARE OF SERIOUSLY DELINQUENT MORTGAGES<br />
3 RD QUARTER 2011<br />
1.9% to 5.0%<br />
5.0% to 7.5%<br />
7.5% to 10.0%<br />
10.0% to 18.9%<br />
NOTES:<br />
• <strong>The</strong> Great Plains states have the lowest share of seriously delinquent loans.<br />
Regional Roundup<br />
North Dakota 1.9% Tennessee 6.3%<br />
Alaska 2.3% Pennsylvania 6.5%<br />
Wyoming 2.4% Washington 6.5%<br />
South Dakota 2.7% Massachusetts 6.7%<br />
Nebraska 3.2% Louisiana 6.8%<br />
Montana 3.3% Kentucky 6.8%<br />
Virginia 4.2% Delaware 7.1%<br />
Colorado 4.2% Hawaii 7.3%<br />
Minnesota 4.6% Michigan 7.3%<br />
Texas 4.7% South Carolina 7.4%<br />
Iowa 4.8% Arizona 7.5%<br />
West Virginia 4.8% California 7.7%<br />
Kansas 4.8% Georgia 7.7%<br />
Missouri 4.9% Connecticut 7.9%<br />
New Hampshire 5.0% Rhode Island 7.9%<br />
Vermont 5.0% United States 7.9%<br />
Arkansas 5.2% Mississippi 8.0%<br />
Idaho 5.3% Indiana 8.3%<br />
Utah 5.5% Maryland 8.5%<br />
Alabama 5.5% Maine 8.6%<br />
Oklahoma 5.7% Ohio 8.6%<br />
Wisconsin 5.9% New York 9.3%<br />
New Mexico 6.0% Illinois 11.0%<br />
District of Columbia 6.1% New Jersey 11.9%<br />
North Carolina 6.1% Nevada 13.9%<br />
Oregon 6.1% Florida 18.9%<br />
• Florida, Nevada, New Jersey, and Illinois continue to have the worst share of serious delinquencies – with all in double-digits.<br />
• Some of the states hardest hit by the housing bust (e.g. Nevada, California) are seeing the most improvement in serious delinquency rates (even if<br />
those rates are still high).<br />
1-YEAR CHANGE IN SHARE OF SERIOUSLY DELINQUENT MORTGAGES<br />
3 RD QUARTER 2011<br />
Source: <strong>Mortgage</strong> Bankers Association / Haver Analytics<br />
-3.9% to -1.0%<br />
-1.0% to -0.5%<br />
-0.5% to 0.0%<br />
0.0% to 1.2%<br />
Nevada -3.9% Ohio -0.3%<br />
Arizona -3.3% South Dakota -0.3%<br />
California -2.7% Indiana -0.3%<br />
Michigan -2.0% Iowa -0.3%<br />
Utah -1.3% Wisconsin -0.2%<br />
Georgia -1.1% Delaware -0.2%<br />
Idaho -0.9% Tennessee -0.1%<br />
Wyoming -0.9% Oklahoma -0.1%<br />
Minnesota -0.9% North Dakota 0.0%<br />
Colorado -0.8% Kansas 0.0%<br />
United States -0.8% District of Columbia 0.0%<br />
Rhode Island -0.8% Washington 0.1%<br />
Louisiana -0.7% New Mexico 0.1%<br />
Florida -0.7% Pennsylvania 0.1%<br />
Massachusetts New Hampshire<br />
-0.6%<br />
-0.6%<br />
South Carolina<br />
Arkansas<br />
0.1%<br />
0.1%<br />
Hawaii -0.6% Vermont 0.2%<br />
Virginia -0.6% Illinois 0.2%<br />
Texas -0.5% Oregon 0.2%<br />
Montana -0.5% North Carolina 0.2%<br />
Nebraska -0.5% Maryland 0.2%<br />
West Virginia -0.4% Connecticut 0.3%<br />
Alabama -0.4% Kentucky 0.3%<br />
Mississippi -0.4% New York 0.3%<br />
Missouri -0.3% Maine 0.4%<br />
Alaska -0.3% New Jersey 1.2%<br />
Page 7
Region in Focus: <strong>The</strong> Midwest<br />
Unemployment rates in the Midwest region have fallen at a faster pace than the other Census regions, and seem to<br />
have resumed their descent after stalling in the summer as a result of slower national growth, concerns about the<br />
U.S. debt ceiling, and European Union (E.U.) sovereign debt problems. After recovering in late-2010 in the wake<br />
of the downturn following the expiration of the homebuyer tax credit, homes sold have stagnated throughout 2011.<br />
Median house prices have not shown any significant improvement above the usual seasonal gains. <strong>Mortgage</strong> credit<br />
quality in the Midwest is better than the national average, with lower foreclosure and delinquency rates.<br />
Labor market conditions in the Midwest have generally improved. <strong>The</strong> average unemployment rate in the region<br />
fell to 8.5 percent in October, but that was still above its post-recession low of 8.1 percent. <strong>The</strong> Midwest is the<br />
only region where the unemployment rate has fallen by more than a full percentage point below its post-recession<br />
peak, dropping by 1.6 percentage points. <strong>The</strong> unemployment rates in the region vary significantly by state.<br />
Michigan had the highest unemployment rate at 10.1 percent, while North Dakota had the lowest at 3.5 percent.<br />
Job growth has been especially strong in states with larger concentrations in the energy sector.<br />
REGION IN FOCUS<br />
*<strong>The</strong> Midwest region<br />
includes IA, IL, IN, KS,<br />
MI, MN, MO, ND, NE,<br />
OH, SD, and WI.<br />
**All Region in Focus<br />
graphs contain data<br />
gathered from BLS,<br />
CoreLogic, and MBA.<br />
According to the National Association of Realtors (NAR), existing single-family home sales in the Midwest were<br />
up by 19.1 percent over the year ending in October. While sales are still up on the year, they have been relatively<br />
flat since the end of 2010. <strong>The</strong> median sales price of existing single-family homes sold in the Midwest dropped by<br />
4.4 percent in October from a year earlier – the smallest decline of all four Census regions.<br />
<strong>Mortgage</strong> credit quality in the Midwest is better on average than the U.S. as a whole. According to the <strong>Mortgage</strong><br />
Bankers Association (MBA), the rate of foreclosures started in the Midwest was 1.04 percent (non-seasonally<br />
adjusted, or NSA) in the third quarter of 2011, remaining just below the national average of 1.08 percent. Seriously<br />
delinquent loans (90+ days delinquent plus the foreclosure inventory) were 7.33 percent of the total, with only the<br />
West having a lower rate. <strong>The</strong> Midwest also had the second lowest delinquency rates on all loans at 8.09 percent.<br />
Page 8<br />
Missouri<br />
Missouri’s labor market has been mixed, with the<br />
state’s unemployment rate continuing to decline, but<br />
with very weak payroll employment growth. Home<br />
sales fell in the third quarter and are still at low levels –<br />
although they are up on the year. House prices have<br />
begun to fall again after some seasonal increases<br />
during the spring/summer. According to the U.S.<br />
Bureau of Economic Analysis, per capita personal<br />
income in the state rose by 1.0 percent in the second<br />
quarter, and was up by 4.0 percent from a year earlier.<br />
<strong>Mortgage</strong> credit quality in Missouri is better than the<br />
national average, with a much lower share of seriously<br />
delinquent loans.<br />
<strong>The</strong> two monthly U.S. government surveys on<br />
employment are telling very different stories about<br />
Missouri’s labor conditions. According to the<br />
household survey, the state’s unemployment rate<br />
dropped to 8.5 percent in October, more than a<br />
percentage point below the level of a year earlier.<br />
Although the state’s labor force has increased, the<br />
unemployment rate has continued to decrease – a<br />
positive sign. <strong>The</strong> state’s largest MSA, St. Louis, has<br />
the highest unemployment rate in the state at 8.8<br />
percent, while Kansas City has a lower unemployment<br />
rate at 8.3 percent. Columbia had the lowest<br />
unemployment rate in Missouri at 5.9 percent. <strong>The</strong><br />
payroll survey shows a much weaker picture. After<br />
losing 170,300 jobs in the recession, Missouri has only<br />
gained 16,300 back. Since hitting bottom, job growth<br />
in the state has been much weaker than the national<br />
average, climbing by only 0.6 percent – only one-third<br />
of the national recovery. Even worse, job growth has<br />
trended downward recently with a 0.3 percent decline<br />
over the past six months.<br />
According to NAR, third quarter total existing home<br />
sales in the state were down by 2.7 percent from the<br />
previous quarter, up by 21.0 percent from a year<br />
earlier, and down by 40.2 percent from the peak.<br />
According to Moody’s Economy.com, existing singlefamily<br />
home sales have been mixed recently –<br />
increasing in half of the states’ MSAs in the third<br />
quarter. Still, sales were down in all eight MSAs over<br />
the past year. In St. Louis, sales increased by 8.1<br />
percent in the third quarter and were up by 19.1 percent<br />
from a year earlier. Sales in Kansas City decreased in<br />
the second quarter by 9.2 percent, but were up over the<br />
past 12 months by 35.5 percent.<br />
According to data from CoreLogic’s HPI, Missouri<br />
house prices have begun to decline again, falling by 3.4<br />
percent over the past three months, after climbing in<br />
the spring/summer. This recent dip has pushed prices<br />
down by 3.7 percent from a year earlier. Prices in both<br />
St. Louis and Kansas City also dropped over the past<br />
12 months, falling by 4.9 percent each – bigger<br />
declines than the other MSAs in the state. House<br />
prices decreased the least in Springfield, slipping by<br />
just 0.7 percent.<br />
(Continued on page 9)
Region in Focus: <strong>The</strong> Midwest<br />
Missouri (continued from page 8)<br />
<strong>Mortgage</strong> credit quality in Missouri has been better<br />
than the national average. According to the MBA, the<br />
rate of foreclosures started in the state rose to 0.90<br />
percent (NSA) during the third quarter of 2011.<br />
Despite the rise, this is below the national average of<br />
1.08 percent. <strong>The</strong> delinquency rate on all mortgages in<br />
the state was 8.36 percent, above the national average<br />
of 8.20 percent. <strong>The</strong> share of seriously delinquent<br />
loans in Missouri was only 4.94 percent, well below<br />
the national average of 7.89 percent.<br />
Percent<br />
12.0<br />
9.0<br />
6.0<br />
3.0<br />
0.0<br />
-3.0<br />
-6.0<br />
Missouri<br />
U.S.<br />
-3.7<br />
-3.9<br />
House Price<br />
Appreciation<br />
Oct 10 - Oct 11<br />
8.5<br />
9.0<br />
Unemployment<br />
Rate October 2011<br />
4.94<br />
7.89<br />
Seriously<br />
Delinquent<br />
<strong>Mortgage</strong>s 2011Q3<br />
Page 9<br />
Ohio<br />
Ohio has been recovering at a faster pace than the<br />
nation as a whole. <strong>The</strong> unemployment rate is down<br />
and job growth has been trending upward for nearly<br />
two years. Home sales have been flat in 2011, but are<br />
still above the lows seen during the second half of<br />
2010. After some gains in the spring/summer, house<br />
prices have begun to fall again in recent months in<br />
response to seasonal pressures. <strong>The</strong> state’s per capita<br />
personal income rose by 1.2 percent in the second<br />
quarter, and was up by 5.1 percent from a year earlier.<br />
<strong>Mortgage</strong> credit quality in Ohio continues to be worse<br />
than the nation as a whole, with high serious<br />
delinquency rates.<br />
Ohio’s unemployment rate fell to 9.0 percent in<br />
October, although it had been trending upward since<br />
May. A shrinking labor force, which is a negative sign<br />
for the job market, is contributing to the trend decline<br />
in unemployment from its peak rate of 10.6 percent.<br />
<strong>The</strong> unemployment rates in Cleveland-Elyria-Mentor<br />
and Columbus have been relatively low compared with<br />
the other MSAs in the state at 8.0 and 7.9 percent,<br />
respectively. On the other hand, Mansfield and<br />
Steubenville-Weirton had the highest unemployment<br />
rates in the state, each at 10.9 percent. After losing<br />
450,300 payroll jobs in the recession, 105,700 have<br />
been recovered. Employment is up by 1.3 percent over<br />
the past 12 months, while private employment is up<br />
even more, increasing by 1.7 percent. <strong>The</strong> professional<br />
and business services and the leisure and hospitality<br />
sectors are leading job growth – although the leisure<br />
and hospitality sector has taken a dive in the second<br />
half of 2011.<br />
According to NAR, third quarter total existing home<br />
sales in the state were up by 0.2 percent from the<br />
previous quarter. <strong>The</strong>y were also up by 22.6 percent<br />
from a year earlier, but were down by 21.4 percent<br />
from the peak. According to Moody’s Economy.com,<br />
single-family home sales were down in only three of<br />
the state’s thirteen MSAs in the third quarter and were<br />
up in all of them over the past year. Sales in<br />
Percent<br />
Cincinnati-Middletown climbed by 6.9 percent during<br />
the third quarter and were up by 35.1 percent over the<br />
past year. Home sales increased by less in Cleveland-<br />
Elyria-Mentor, up by 3.7 percent during the third<br />
quarter and by 25.6 percent over the past year.<br />
According to CoreLogic, house prices in Ohio were up<br />
by 7.1 percent from March to August, helped in part by<br />
positive seasonal factors. Prices have slipped by 3.0<br />
percent over the past three months, however, and are<br />
now down by 6.1 percent from a year earlier. House<br />
prices in Cincinnati-Middletown fell by 4.0 percent<br />
over the past year. Prices in Cleveland-Elyria-Mentor<br />
and Columbus decreased by more, down by 7.8 and 6.7<br />
percent, respectively. House prices decreased the least<br />
in Toledo, falling by 1.5 percent, while they dropped<br />
the most in Akron, down by 10.0 percent.<br />
<strong>Mortgage</strong> credit quality in Ohio is worse than the<br />
national average. According to the MBA, the rate of<br />
foreclosures started in the state fell to 1.11 percent<br />
(NSA) during the third quarter of 2011. This is slightly<br />
above the national average of 1.08 percent. Seriously<br />
delinquent loans were 8.61 percent, also above the<br />
national average of 7.89 percent. <strong>The</strong> delinquency rate<br />
on all mortgages in the state was 9.29 percent, above<br />
the national average of 8.20 percent.<br />
12.0<br />
9.0<br />
6.0<br />
3.0<br />
0.0<br />
-3.0<br />
-6.0<br />
-9.0<br />
Ohio<br />
U.S.<br />
-6.1<br />
-3.9<br />
House Price<br />
Appreciation<br />
Oct 10 - Oct 11<br />
9.0 9.0<br />
8.61 7.89<br />
Unemployment<br />
Rate October 2011<br />
Seriously<br />
Delinquent<br />
<strong>Mortgage</strong>s 2011Q3
Region in Focus: <strong>The</strong> Midwest<br />
South Dakota<br />
South Dakota’s unemployment rate continues to be one<br />
of the lowest in the nation and the state has added back<br />
almost two-thirds of the jobs lost in the recession. <strong>The</strong><br />
state’s per capita personal income rose by 2.0 percent<br />
in the second quarter and was up by 6.3 percent from a<br />
year earlier. Home sales have climbed over the past<br />
year. House prices in South Dakota are also up and<br />
nearing an all-time high. <strong>Mortgage</strong> credit quality is far<br />
better than the country as a whole, with much lower<br />
mortgage foreclosure and delinquency rates.<br />
South Dakota’s unemployment rate fell to 4.5 percent<br />
in October. Only North Dakota and Nebraska had<br />
lower rates. <strong>The</strong> unemployment rate has continued to<br />
fall even with a growing labor force – a positive sign.<br />
<strong>The</strong> unemployment rate in Rapid City was just 4.8<br />
percent in October. Sioux Falls’ rate was even lower at<br />
4.5 percent. According to the October payroll<br />
employment survey, after losing 17,300 payroll jobs in<br />
the recession, 11,400 have been recovered. Job gains<br />
have slowed a bit recently, however, and payroll<br />
employment is up by only 0.4 percent over the past 12<br />
months, with the strongest growth in the professional<br />
and business services sector.<br />
According to NAR, third quarter total existing home<br />
sales in the state were up by 5.6 percent. Home sales<br />
were also up over the past year, increasing by 26.7<br />
percent. Interestingly, home sales in the state hit a new<br />
high during the fourth quarter of 2009, likely<br />
influenced by the homebuyer tax credit; however, they<br />
have fallen by 26.9 percent since. According to<br />
Moody’s Economy.com, single-family home sales in<br />
Sioux Falls were also positive, increasing by 7.7<br />
percent in the third quarter and by 45.2 percent over<br />
the past year. Sales in Rapid City were much weaker,<br />
falling during the third quarter by 5.0 percent, while<br />
they were flat over the past year.<br />
According to data from CoreLogic’s HPI, house prices<br />
in South Dakota are up by 3.2 percent over the past 12<br />
months. Over the past eight months, they have jumped<br />
by 6.1 percent – helped, but only in part, by positive<br />
seasonal factors. Now that seasonal factors are a<br />
negative, price gains have slowed in the past two<br />
months – although they are still rising. Prices in Rapid<br />
City rose by 2.9 percent over the past 12 months.<br />
Prices also increased in Sioux Falls, up by 3.7 percent.<br />
<strong>Mortgage</strong> credit quality in South Dakota is much better<br />
than the national average. According to the MBA, the<br />
rate of foreclosures started in the state fell to 0.39<br />
percent (NSA) during the third quarter of 2011,<br />
significantly below the national average of 1.08<br />
percent. <strong>The</strong> delinquency rate on all mortgages in the<br />
state was 3.66 percent, well below the national average<br />
of 8.20 percent. <strong>The</strong> share of seriously delinquent<br />
loans in South Dakota was 2.70 percent, far lower than<br />
the national average of 7.89 percent.<br />
12.0<br />
9.0<br />
South Dakota<br />
U.S.<br />
9.0<br />
7.89<br />
Percent<br />
6.0<br />
3.0<br />
0.0<br />
3.2<br />
4.5<br />
2.70<br />
-3.0<br />
-6.0<br />
-3.9<br />
House Price<br />
Appreciation<br />
Oct 10 - Oct 11<br />
Unemployment<br />
Rate October 2011<br />
Seriously<br />
Delinquent<br />
<strong>Mortgage</strong>s 2011Q3<br />
Page 10
Region in Focus: <strong>The</strong> Midwest –<br />
Selected <strong>Housing</strong> / Economic Indicators<br />
State MSA Oct-11 Jul-11 3rd Qtr 11 2nd Qtr 11 3rd Qtr 11 2nd Qtr 11<br />
Illinois 10.1 9.5 12.1 -0.1 3.5 3.1<br />
Indiana<br />
Iowa<br />
Kansas<br />
Michigan<br />
Minnesota<br />
Missouri<br />
Nebraska<br />
North Dakota<br />
Ohio<br />
South Dakota<br />
Wisconsin<br />
House Price Appreciation<br />
Unemployment Rate Annualized Quarterly Rate Homeowner Vacancy Rate<br />
Chicago-Naperville-Joliet 10.6 9.9 16.3 -4.4 3.1 3.6<br />
Lake County-Kenosha County 9.6 9.0 1.3 4.5 3.1 3.6<br />
Peoria 8.6 8.0 12.8 -1.1 - -<br />
9.0 8.5 10.6 7.5 2.3 2.9<br />
Evansville 7.8 7.3 17.9 7.4 - -<br />
Fort Wayne 8.8 8.0 18.9 14.2 - -<br />
Gary 9.8 9.3 6.0 -2.1 3.1 3.6<br />
Indianapolis-Carmel 8.5 8.0 10.6 9.6 1.7 5.2<br />
6.0 6.0 5.4 9.1 2.3 2.4<br />
Des Moines-West Des Moines 5.9 6.1 4.5 11.9 - -<br />
6.7 6.5 8.6 4.2 2.7 1.7<br />
Witchita 7.8 7.4 -14.1 3.3 - -<br />
10.6 10.9 38.6 1.2 2.3 2.4<br />
Ann Arbor 6.5 6.6 21.2 -1.8 - -<br />
Detroit-Livornia-Dearborn 13.4 13.8 42.4 -2.7 1.6 2.4<br />
Flint 11.1 10.9 38.6 2.1 - -<br />
Grand Rapids-Wyoming 8.2 8.3 33.3 -0.9 3.8 2.6<br />
Lansing-East Lansing 7.9 8.1 38.5 1.4 - -<br />
Warren-Troy-Farmington Hills 11.2 11.7 37.5 -5.6 1.6 2.4<br />
6.4 7.2 8.7 -1.8 2.1 1.6<br />
Minneapolis-St. Paul-Bloomington 6.3 7.0 9.1 -0.2 1.4 1.8<br />
8.5 8.7 9.3 9.3 1.9 2.5<br />
Kansas City 8.3 8.3 9.5 3.0 2.4 3.7<br />
St. Louis 8.8 8.8 9.6 9.7 2.9 3.3<br />
Springfield 7.7 7.9 4.8 2.9 - -<br />
4.2 4.2 9.0 8.7 2.5 2.1<br />
Omaha-Council Bluffs 4.8 4.7 7.7 8.6 2.8 1.6<br />
3.5 3.3 4.3 -2.0 1.5 1.0<br />
9.0 9.0 14.1 2.0 1.8 3.0<br />
Akron 8.6 8.5 13.4 -1.1 2.8 6.6<br />
Cincinnati-Middletown 9.0 9.0 11.2 4.1 1.5 2.9<br />
Cleveland-Elyria-Mentor 8.0 7.9 15.6 -0.9 0.9 1.9<br />
Columbus 7.9 7.7 11.6 3.6 2.2 3.7<br />
Dayton 9.6 9.6 11.5 -0.1 6.5 4.7<br />
Toledo 10.0 9.8 21.3 9.7 2.8 3.6<br />
Youngstown-Warren-Boardman 9.6 9.6 2.8 3.8 - -<br />
4.5 4.7 14.5 4.8 2.6 1.7<br />
7.7 7.8 6.4 8.3 2.5 1.9<br />
Madison 5.6 5.5 7.9 8.7 - -<br />
Milwaukee-Waukesha-West Allis 8.1 8.1 11.5 3.6 2.6 1.7<br />
United States 9.0 9.1 7.2 6.9 2.4 2.5<br />
Source: Bureau of Labor Statistics / CoreLogic, LoanPerformance HPI / U.S. Census Bureau / Haver Analytics<br />
Page 11
Special Topic (Continued from cover page)<br />
Of course, while housing may be affordable, to the extent that falling<br />
house prices cause expectations of future declines, potential home buyers<br />
may pass on purchases until they are sure that prices have truly<br />
bottomed. Additionally, our discussion on demographics suggested that<br />
vacancy rates were lower than many analysts assume, so there is<br />
somewhat less downward pressure on house prices as a result. In this<br />
issue, we turn to the relationship between employment and house price<br />
changes (which depends not only on the demand factors mentioned<br />
above, but also on supply factors). State-level data suggest that stronger<br />
job growth could drive a pickup in house prices, especially in states that<br />
have seen the biggest house price declines. Unfortunately, excess supply<br />
factors in many of those markets will likely keep downward pressure on<br />
house prices, at least in the near term.<br />
Many factors are contributing to the current negative momentum in<br />
house prices. Among these are significant numbers of distressed sales,<br />
restrictive lending guidelines, and cautious potential buyers. One of the<br />
major factors, however, appears to be weak job growth. Roughly 8.8<br />
million nonfarm payroll jobs were lost during the 2007-2010 period, and<br />
only about 2.5 million have come back so far. Since some of the job<br />
losses were in the housing construction, home sales, and mortgage<br />
finance sectors, the relationship between jobs and housing demand is<br />
direct. Moreover, this can be a self-reinforcing process, as declines in<br />
house prices lead to lower housing demand (if this causes buyers to<br />
expect further price declines), which lead in turn to additional drops in<br />
construction, sales, and finance jobs – and thus to even lower housing<br />
demand, which places further downward pressure on house prices, etc.<br />
From the peak in residential construction and real estate-related financial<br />
employment (which occurred before the start of the Great Recession) to<br />
the trough, 583,000 jobs have been lost. This direct count certainly<br />
understates the full impact of the decline in residential real estate on<br />
employment, as spillover effects into other sectors stemming from the<br />
housing bust are hard to estimate but are likely large.<br />
How much of the weak employment situation is coming from the<br />
housing sector? According to Moody’s Ecomomy.com, the direct<br />
contributions of housing construction and renovations are typically closer<br />
to 5 percent of GDP than the current 2 percent. Given that real GDP is<br />
around 7 percent below the Congressional Budget Office’s estimate of<br />
potential real GDP, this suggests that the 3 percentage-point shortfall in<br />
residential housing construction (relative to GDP) accounts for somewhat<br />
more than 40 percent of the economic shortfall. In a normal recovery,<br />
housing construction comes back quickly as interest rates fall.<br />
Unfortunately, housing construction has yet to recover from the fallout of<br />
the housing boom/bust. Given the overhang of vacant units and the<br />
current slow pace of housing demand, it may be a while before housing<br />
construction accelerates to normal levels.<br />
<strong>The</strong> importance of state-level employment conditions on house prices is<br />
borne out by comparing job growth to the House Price Appreciation<br />
(HPA) rate. Figure 1 shows the relationship between the cumulative<br />
percent change in total nonfarm payrolls for each state versus the<br />
cumulative change in house prices, both starting at the beginning of the<br />
recession in December 2007. <strong>The</strong> curved line in the figure is the best<br />
quadratic fit to the data, which clearly shows a strong positive<br />
relationship between job growth and HPA. Common goodness-of-fit<br />
measures indicate that significantly more than half of the variation in<br />
HPAs can be explained by variation in employment growth over this<br />
time period.<br />
<strong>The</strong> data behind Figure 1 appear in Table 1. <strong>The</strong> second and third<br />
columns of the table show the cumulative change in nonfarm payroll<br />
employment from December 2007 to October 2011 and the cumulative<br />
change in the CoreLogic house price index (including distressed sales)<br />
over the same time period. North Dakota has had both the best<br />
employment growth and HPA, thanks to a boom in energy exploration<br />
(making it the top right-hand dot in Figure 1). Nevada (the bottom lefthand<br />
dot in Figure 1) had both the worst employment and house price<br />
declines.<br />
<strong>The</strong> HPA forecasts in columns 4 and 5 of Table 1 are simple<br />
extrapolations based on the fitted relationship in Figure 1 and Moody’s<br />
Economy.com’s state-level employment growth forecasts for 2012 and<br />
2013. <strong>The</strong>se simple projections of house prices assume that the other<br />
factors affecting housing supply and demand remain unchanged from<br />
their average values over the December 2007 - October 2011 period. On<br />
a national basis, Moody’s projections are for 1.0 percent payroll<br />
employment growth in 2012 (about the same as this year) and 1.5 percent<br />
for 2013.<br />
15%<br />
Figure 1: A Positive Relationship between Job and<br />
House Price Growth<br />
HPA Dec 2007-Oct 2011<br />
5%<br />
-5%<br />
-15%<br />
-25%<br />
-35%<br />
-45%<br />
-55%<br />
R 2 = 0.61<br />
-15. 0% -10.0% -5.0% 0.0% 5.0% 10.0%<br />
Change in Job Growth Dec 2007-Oct 2011<br />
Source: CoreLogic / Bureau of Labor Statistics / <strong>PMI</strong><br />
Page 12
<strong>The</strong> good news from this simple forecast is that house prices should only<br />
decline in seven states (plus the District of Columbia) in the coming year,<br />
with gains everywhere but DC for 2013. This even includes 2.0 and 4.0<br />
percent increases for hard-hit Nevada in 2012 and 2013, respectively.<br />
<strong>The</strong> bad news is that the other factors that affect house prices aren’t<br />
included. Perhaps the most important of these missing inputs is supply<br />
conditions, especially vacant units. Figure 2 shows 2010 vacancy rates<br />
from the Decennial Census, indicating that many of the states with the<br />
Special Topic (Continued from page 12)<br />
worst price performance in recent years have the highest vacancy rates.<br />
(Note that Maine and Vermont have the highest vacancy rates, but this is<br />
because they have large numbers of second/vacation homes – which by<br />
Census Bureau definition are counted as vacant – relative to the total size<br />
of the housing stock in those states.) What the simple forecast shows,<br />
however, is that in the absence of supply conditions, even many of what<br />
are thought to be the worst states would see house price gains as a result<br />
of job growth.<br />
Table 1: Changes in Employment and House Price Appreciation<br />
Change in<br />
Employment<br />
Dec07-Oct11<br />
HPA<br />
Dec07-<br />
Oct11<br />
2012 Simple<br />
HPA<br />
Forecast<br />
2013 Simple<br />
HPA<br />
Forecast<br />
Change in<br />
Employment<br />
Dec07-Oct11<br />
HPA<br />
Dec07-<br />
Oct11<br />
2012 Simple<br />
HPA<br />
Forecast<br />
2013 Simple<br />
HPA<br />
Forecast<br />
Alabama -7.0% -19% 2% 2%<br />
Alaska 3.6% -3% 1% 2%<br />
Arizona -9.6% -44% 2% 3%<br />
Arkansas -3.0% -4% 1% 1%<br />
California -6.8% -32% 1% 1%<br />
Colorado -4.1% -8% 2% 2%<br />
Connecticut -4.5% -18% -1% 1%<br />
Delaware -6.1% -18% 1% 2%<br />
District of Columbia 2.3% -6% -3% -1%<br />
Florida -8.6% -39% 3% 2%<br />
Georgia -8.4% -25% 2% 3%<br />
Hawaii -5.0% -23% 0% 1%<br />
Idaho -7.2% -37% 1% 2%<br />
Illinois -5.0% -27% 0% 1%<br />
Indiana -6.5% -10% -1% 1%<br />
Iowa -2.7% -1% 0% 1%<br />
Kansas -4.3% -9% 1% 1%<br />
Kentucky -3.8% -7% 2% 1%<br />
Louisiana -0.1% -7% 2% 1%<br />
Maine -3.9% -11% 0% 1%<br />
Maryland -3.2% -23% -2% 1%<br />
Massachusetts -1.6% -12% 0% 1%<br />
Michigan -7.5% -28% -1% 1%<br />
Minnesota -3.5% -22% 1% 1%<br />
Mississippi -4.9% -6% 0% 1%<br />
Missouri -5.2% -18% 0% 1%<br />
Montana -2.4% -15% -1% 1%<br />
Nebraska -0.1% -1% 1% 1%<br />
Nevada -13.2% -50% 2% 4%<br />
New Hampshire -2.8% -11% 1% 1%<br />
New Jersey -5.3% -18% -1% 1%<br />
New Mexico -5.1% -24% 3% 3%<br />
New York -1.6% -10% 1% 1%<br />
North Carolina -7.2% -9% 1% 2%<br />
North Dakota 10.2% 13% 4% 1%<br />
Ohio -5.8% -15% 0% 1%<br />
Oklahoma -0.3% -1% 1% 1%<br />
Oregon -6.5% -26% 1% 1%<br />
Pennsylvania -2.0% -8% 0% 1%<br />
Rhode Island -6.0% -24% 0% 1%<br />
South Carolina -6.4% -13% 1% 1%<br />
South Dakota -0.5% 3% 0% 1%<br />
Tennessee -5.6% -10% 1% 1%<br />
Texas 0.9% -10% 2% 2%<br />
Utah -3.7% -31% 1% 1%<br />
Vermont -1.7% -5% -2% 1%<br />
Virginia -2.8% -14% 1% 2%<br />
Washington -4.7% -25% 2% 2%<br />
West Virginia -0.8% -24% 1% 1%<br />
Wisconsin -4.9% -14% 0% 1%<br />
Wyoming -1.6% -8% 0% 1%<br />
Figure 2: 2010 Vacancy Rates from the Decennial<br />
Percent Vacant 2010<br />
Census<br />
9.2%<br />
9.3%<br />
14.3%<br />
8.1%<br />
15.6%<br />
20.5% 22.8%<br />
15.2%<br />
11.4%<br />
11.1%<br />
9.3%<br />
13.2%<br />
13.1%<br />
9.7%<br />
11.3%<br />
13.4%<br />
14.6%<br />
10.7%<br />
7.9%<br />
8.6%<br />
9.9%<br />
9.5% 9.5%<br />
10.2%<br />
15.7%<br />
10.4% 8.7% 10.5%<br />
10.8%<br />
13.4%<br />
9.3%<br />
9.8%<br />
9.2%<br />
12.4%<br />
10.8%<br />
10.1%<br />
16.3%<br />
12.2%<br />
12.3%<br />
12.9%<br />
11.3%<br />
13.5%<br />
15.7%<br />
12.5%<br />
13.3%<br />
12.3%<br />
10.6%<br />
12.0%<br />
15.9%<br />
12.4%<br />
7.0% to 10.0%<br />
10.0% to 13.0%<br />
13.0% to 18.0%<br />
18.0% to 25.0%<br />
17.5%<br />
Source: 2010 Decennial Census / <strong>PMI</strong><br />
Page 13
<strong>The</strong> <strong>PMI</strong> Forecast<br />
Economic Outlook<br />
2010 2011<br />
Q1 Q2 Q3 Q4 Q1 Q2 Q3 Q4 Q1 Q2 Q3 Q4 2010 2011 2012 2013<br />
Real GDP Growth 1 3.9 3.8 2.5 2.4 0.4 1.3 2.0 2.9 3.0 3.1 3.3 3.5 3.1 1.8 3.2 3.6<br />
Consumer Price Inflation 2 1.5 -0.7 1.5 2.6 5.2 4.1 3.1 1.5 1.4 1.9 2.0 2.2 1.7 3.2 2.0 2.3<br />
Civilian Unemployment Rate 9.7 9.6 9.6 9.6 8.9 9.1 9.1 8.8 8.9 8.9 8.8 8.7 9.6 9.0 8.8 8.2<br />
2012<br />
Interest Rates<br />
30-year Fixed Rate <strong>Mortgage</strong> (%) 5.00 4.91 4.45 4.41 4.88 4.66 4.31 4.02 4.07 4.17 4.35 4.55 4.69 4.47 4.29 5.14<br />
1-year Adjustable Rate <strong>Mortgage</strong> (%) 4.25 4.01 3.57 3.31 3.26 3.11 2.91 2.88 2.95 3.00 3.10 3.20 3.79 3.04 3.06 3.70<br />
10-year Treasury Note (%) 3.72 3.49 2.79 2.86 3.46 3.21 2.43 2.07 2.15 2.30 2.60 2.90 3.21 2.79 2.49 3.53<br />
<strong>Housing</strong> <strong>Market</strong><br />
Existing Sales (Thousands of Units) 5183 5570 4170 4747 5137 4883 4877 5000 5100 5250 5350 5450 4908 4975 5288 5650<br />
New Sales (Thousands of Units) 360 335 291 300 299 309 297 310 325 350 375 410 322 304 365 500<br />
Median Existing Home Price Change (%) 3 -2.6 6.2 0.2 -4.0 -7.0 6.8 0.4 -4.2 -2.8 6.9 2.9 -2.0 0.2 -4.5 1.8 2.3<br />
<strong>Mortgage</strong> <strong>Market</strong><br />
Single Family Originations (Billions of $) 355 385 415 465 330 300 330 340 240 280 280 210 1620 1 300 1010 1200<br />
Refinancing Share (%) 69 60 70 73 66 64 70 74 68 55 40 35 68 6 9 50 33<br />
ARM Share (%) 5 6 6 6 6 8 9 10 11 12 13 14 6 8 12 15<br />
All forecasted values are in bold<br />
1 Quarterly = annualized percent change ; Annual = Q4 / Q4<br />
2 Quarterly = annualized percent change ; Annual = Year Avg. / Year Avg.<br />
3 Quarterly = percent change ; Annual = Year Avg. / Year Avg.<br />
Cautionary Statement:<br />
Statements in this document that relate to future plans, events or performance are "forward-looking" statements within the meaning of the Private Securities Litigation Refo rm Act of 1995.<br />
<strong>The</strong>se forward-looking statements include our expectations with respect to national and regional economic activity, the risk of recession, inflation, employment trends, consum er spending and<br />
borrowing, interest rates, home sales and price trends, governmental policy, as well as other trends in housing, financial, and mortgage markets. Readers are cautioned that forward-looking<br />
statements by their nature involve risk and uncertainty because they relate to events and circumstances that will occur in the future. Many factors could cause actual re sults and de velopments to<br />
differ materially from those expressed or implied by forward-looking statements, such as different than expected levels and growth rates of national or regional economic activity; changes in<br />
monetary and fiscal policy, sources and uses of bank liquidity, and credit and other market disruptions; political tensions and unrest in certain foreign nations; fluctu ations in oil prices; natural<br />
and manmade disasters; changes in international economic and financial conditions, particularly financial and fiscal volatility, and the risks of national debt default in Europe; changes in interest<br />
rates, lending standards, housing prices and employment rates; foreclosure trends; and regulatory and legislative developments. Other risks and uncertainties are discussed in the SEC filings of<br />
the <strong>PMI</strong> <strong>Group</strong>, <strong>Inc</strong>., including its Annual Report on Form 10-K for the year ended December 31, 2010 (in Part I, Item 1A), filed on March 15, 2011 and its Quarterly Repor Form 10-Q for<br />
ts on<br />
es no obligatio<br />
the quarters ended March 31, 2011 (in Part II, Item 1A), filed on May 10, 2011 and June 30, 2011 (in Part II, Item 1A), filed on August 4, 2011. <strong>PMI</strong> undertak n to update<br />
forward-looking statements.<br />
Page 14<br />
© 2011 <strong>PMI</strong> <strong>Mortgage</strong> Insurance Co., <strong>PMI</strong> <strong>Mortgage</strong> Assurance Co.