Permafrost Terrain Stability and Thermokarst Monitoring: - Arctic LCC
Permafrost Terrain Stability and Thermokarst Monitoring: - Arctic LCC
Permafrost Terrain Stability and Thermokarst Monitoring: - Arctic LCC

You also want an ePaper? Increase the reach of your titles
YUMPU automatically turns print PDFs into web optimized ePapers that Google loves.
Compiled for the <strong>Arctic</strong> L<strong>and</strong>scape Conservation Cooperative<br />
<strong>Thermokarst</strong> <strong>and</strong> Thaw-Related L<strong>and</strong>scape Dynamics—<br />
An Annotated Bibliography with an Emphasis on<br />
Potential Effects on Habitat <strong>and</strong> Wildlife<br />
Open-File Report 2013–1161<br />
U.S. Department of the Interior<br />
U.S. Geological Survey
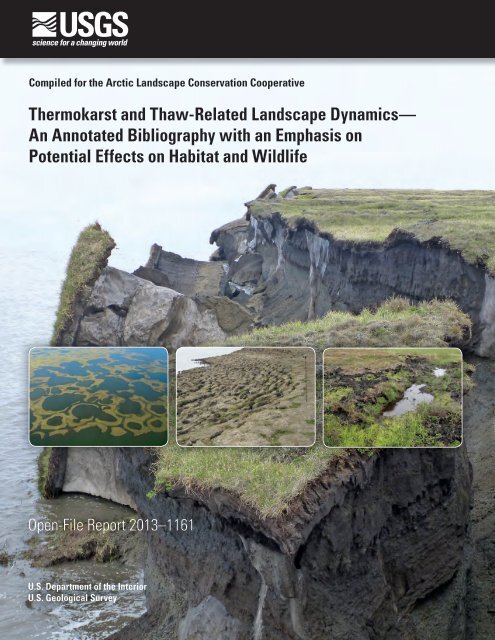
Cover:<br />
Background image: Collapse of large blocks of permafrost as a result of thermal abrasion along<br />
the Beaufort Sea Coast.<br />
Inset 1: Coalescing low-centered, ice-wedge polygon ponds <strong>and</strong> inundated ice wedge<br />
troughs near the Ikpikpuk River Delta.<br />
Inset 2: A slumping bluff on the margin of a thermokarst lake.<br />
Inset 3: A newly forming pit in the trough of an ice wedge following a tundra fire.<br />
All photographs were taken by Benjamin Jones, U.S. Geological Survey.
<strong>Thermokarst</strong> <strong>and</strong> Thaw-Related L<strong>and</strong>scape<br />
Dynamics—An Annotated Bibliography with an<br />
Emphasis on Potential Effects on Habitat <strong>and</strong> Wildlife<br />
By Benjamin M. Jones, Courtney L. Amundson, <strong>and</strong> Joshua C. Koch, U.S. Geological Survey; <strong>and</strong> Guido<br />
Grosse, University of Alaska–Fairbanks<br />
Compiled for the <strong>Arctic</strong> L<strong>and</strong>scape Conservation Cooperative<br />
Open-File Report 2013–1161<br />
U.S. Department of the Interior<br />
U.S. Geological Survey
U.S. Department of the Interior<br />
SALLY JEWELL, Secretary<br />
U.S. Geological Survey<br />
Suzette M. Kimball, Acting Director<br />
U.S. Geological Survey, Reston, Virginia: 2013<br />
For more information on the USGS—the Federal source for science about the Earth,<br />
its natural <strong>and</strong> living resources, natural hazards, <strong>and</strong> the environment—visit<br />
http://www.usgs.gov or call 1–888–ASK–USGS<br />
For an overview of USGS information products, including maps, imagery, <strong>and</strong> publications,<br />
visit http://www.usgs.gov/pubprod<br />
To order this <strong>and</strong> other USGS information products, visit http://store.usgs.gov<br />
Suggested citation:<br />
Jones, B.M., Amundson,C.L., Koch, J.C., <strong>and</strong> Grosse, Guido, 2013, <strong>Thermokarst</strong> <strong>and</strong> thaw-related<br />
l<strong>and</strong>scape dynamics—An annotated bibliography with an emphasis on potential effects on habitat <strong>and</strong><br />
wildlife: U.S. Geological Survey Open-File Report 2013-1161, 60 p., http://pubs.usgs.gov/of/2013/1161.<br />
Any use of trade, product, or firm names is for descriptive purposes only <strong>and</strong> does not imply<br />
endorsement by the U.S. Government.<br />
Although this report is in the public domain, permission must be secured from the individual<br />
copyright owners to reproduce any copyrighted material contained within this report.
Contents<br />
English-Language Literature .............................................................................................................................. 3<br />
Russian-Language Literature ............................................................................................................................58<br />
Acknowledgments .............................................................................................................................................59<br />
Conversion Factors<br />
Inch/Pound to SI<br />
Multiply By To obtain<br />
Length<br />
foot (ft) 0.3048 meter (m)<br />
Flow rate<br />
inch per year (in/yr) 25.4 millimeter per year (mm/yr)<br />
SI to Inch/Pound<br />
Length<br />
centimeter (cm) 0.3937 inch (in.)<br />
millimeter (mm) 0.03937 inch (in.)<br />
meter (m) 3.281 foot (ft)<br />
kilometer (km) 0.6214 mile (mi)<br />
Area<br />
square meter (m 2 ) 0.0002471 acre<br />
hectare (ha) 2.471 acre<br />
square meter (m 2 ) 10.76 square foot (ft 2 )<br />
hectare (ha) 0.003861 square mile (mi 2 )<br />
square kilometer (km 2 ) 0.3861 square mile (mi 2 )<br />
Volume<br />
cubic meter (m 3 ) 264.2 gallon (gal)<br />
cubic meter (m 3 ) 1.308 cubic yard (yd 3 )<br />
cubic kilometer (km 3 ) 0.2399 cubic mile (mi 3 )<br />
cubic meter (m 3 ) 0.0008107 acre-foot (acre-ft)<br />
cubic hectometer (hm 3 ) 810.7 acre-foot (acre-ft)<br />
Flow rate<br />
centimeter per day (cm/d) 0.3937 inch per day (in/d)<br />
centimeter per year (cm/yr) 0.3937 inch per year (in/yr)<br />
meter per day (m/d) 3.281 foot per day (ft/d)<br />
meter per year (m/yr) 3.281 foot per year ft/yr)<br />
millimeter per year (mm/yr) 0.03937 inch per year (in/yr)<br />
Biomass<br />
metric ton per hectare (t/ha) 0.446 ton per acre (ton/acre)<br />
Temperature in degrees Celsius (°C) may be converted to degrees Fahrenheit (°F) as follows:<br />
°F=(1.8×°C)+32.<br />
iii
This page left intentionally blank<br />
iv
<strong>Thermokarst</strong> <strong>and</strong> Thaw-Related L<strong>and</strong>scape Dynamics—<br />
An Annotated Bibliography with an Emphasis on<br />
Potential Effects on Habitat <strong>and</strong> Wildlife<br />
By Benjamin M. Jones, Courtney L. Amundson, <strong>and</strong> Joshua C. Koch, U.S. Geological Survey; <strong>and</strong> Guido<br />
Grosse, University of Alaska–Fairbanks<br />
<strong>Permafrost</strong> has warmed throughout much of the Northern Hemisphere since the 1980s, with<br />
colder permafrost sites warming more rapidly (Romanovsky <strong>and</strong> others, 2010; Smith <strong>and</strong> others,<br />
2010). Warming of the near-surface permafrost may lead to widespread terrain instability in ice-rich<br />
permafrost in the <strong>Arctic</strong> <strong>and</strong> the Subarctic, <strong>and</strong> may result in thermokarst development <strong>and</strong> other<br />
thaw-related l<strong>and</strong>scape features (Jorgenson <strong>and</strong> others, 2006; Gooseff <strong>and</strong> others, 2009).<br />
<strong>Thermokarst</strong> <strong>and</strong> other thaw-related l<strong>and</strong>scape features result from varying modes <strong>and</strong> scales of<br />
permafrost thaw, subsidence, <strong>and</strong> removal of material. An increase in active-layer depth, water<br />
accumulation on the soil surface, permafrost degradation <strong>and</strong> associated retreat of the permafrost<br />
table, <strong>and</strong> changes to lake shores <strong>and</strong> coastal bluffs act <strong>and</strong> interact to create thermokarst <strong>and</strong> other<br />
thaw-related l<strong>and</strong>scape features (Shur <strong>and</strong> Osterkamp, 2007). There is increasing interest in the<br />
spatial <strong>and</strong> temporal dynamics of thermokarst <strong>and</strong> other thaw-related features from diverse<br />
disciplines including l<strong>and</strong>scape ecology, hydrology, engineering, <strong>and</strong> biogeochemistry. Therefore,<br />
there is a need to synthesize <strong>and</strong> disseminate knowledge on the current state of near-surface<br />
permafrost terrain.<br />
The term “thermokarst” originated in the Russian literature, <strong>and</strong> its scientific use has varied<br />
substantially over time (Shur <strong>and</strong> Osterkamp, 2007). The modern definition of thermokarst refers to<br />
the process by which characteristic l<strong>and</strong>forms result from the thawing of ice-rich permafrost or the<br />
melting of massive ice (van Everdingen, 1998), or, more specifically, the thawing of ice-rich<br />
permafrost <strong>and</strong> (or) or melting of massive ice that result in consolidation <strong>and</strong> deformation of the soil<br />
surface <strong>and</strong> formation of specific forms of relief (Shur, 1988). Jorgenson (2013) identifies 23<br />
distinct thermokarst <strong>and</strong> other thaw-related features in the <strong>Arctic</strong>, Subarctic, <strong>and</strong> Antarctic based<br />
primarily on differences in terrain condition, ground-ice volume, <strong>and</strong> heat <strong>and</strong> mass transfer<br />
processes. Typical <strong>Arctic</strong> thermokarst l<strong>and</strong>forms include thermokarst lakes, collapsed pingos,<br />
sinkholes, <strong>and</strong> pits. <strong>Thermokarst</strong> is differentiated from thermal erosion, which refers to the erosion<br />
of the l<strong>and</strong> surface by thermal <strong>and</strong> mechanical processes (Mackay, 1970; van Everdingen, 1998).<br />
Typical thermal erosional features include thermo-erosional gullies. Thermal abrasion is further<br />
differentiated from thermokarst <strong>and</strong> thermal erosion by association with the reworking of ocean,<br />
river, <strong>and</strong> lake bluffs (Are, 1988). Typical thermo-abrasion features include erosional niches at the<br />
1
ase of bluffs. Thermal denudation is another distinct term that refers to the effect of incoming solar<br />
energy on the thaw of frozen slopes <strong>and</strong> permafrost bodies that subsequently become transported<br />
downhill by gravity (Shur <strong>and</strong> Osterkamp, 2007). Active layer detachment slides <strong>and</strong> thaw slumps<br />
are typical thermal denudation features. Shur <strong>and</strong> Osterkamp (2007) noted that these various<br />
transport processes may occur together with thermokarst or in instances that would not be<br />
considered thermokarst.<br />
This compilation of references regarding thermokarst <strong>and</strong> other thaw-related features is<br />
focused on the <strong>Arctic</strong> <strong>and</strong> the Subarctic. References were drawn from North America as well as<br />
Siberia. English-language literature mostly was targeted, with 167 references annotated in version<br />
1.0; however, an additional 28 Russian-language references were taken from Shur <strong>and</strong> Osterkamp<br />
(2007) <strong>and</strong> are provided at the end of this document. This compilation may be missing key<br />
references <strong>and</strong> inevitably will become outdated soon after publication. We hope that this document,<br />
version 1.0, will serve as the foundation for a comprehensive compilation of thermokarst <strong>and</strong><br />
permafrost-terrain stability references, <strong>and</strong> that it will be updated continually over the coming years.<br />
2
English-Language Literature<br />
1. Agafonov, L., Strunk, H., <strong>and</strong> Nuber, T., 2004, <strong>Thermokarst</strong> dynamics in western<br />
Siberia: Insights from dendrochronological research: Palaeogeography,<br />
Palaeoclimatology, Palaeoecology, v. 209, p. 183–196.<br />
This paper describes the use of dendrochronological techniques for reconstructing the<br />
formation of one thermokarst depression in the boreal forest region of western Siberia.<br />
Wood samples were collected from the Siberian stone pine from three different settings: a<br />
steep frozen slope that showed several leaning trees, a thermokarst depression where most<br />
trees had been killed owing to submergence, <strong>and</strong> a control site on the plain above the slope.<br />
A total of approximately 40 trees were sampled among the three sites. Based on the timing<br />
of tree mortality from the center of the depression outwards, the thermokarst was determined<br />
to have been formed in the early 1900s <strong>and</strong> had exp<strong>and</strong>ed laterally at rates ranging from 4 to<br />
8 cm/yr with the highest rates occurring during the 1920s <strong>and</strong> 1930s <strong>and</strong> associated with<br />
some of warmest air temperatures of the 20th century. However, during the second half of<br />
the 20th century, rates of 7 cm/yr have been inferred, a result of increased precipitation<br />
rather than increase air temperature.<br />
2. Allard, M., 1996, Geomorphological changes <strong>and</strong> permafrost dynamics—Key factors in<br />
changing arctic ecosystems—An example from Bylot Isl<strong>and</strong>, Nunavut, Canada:<br />
Geoscience Canada, v. 23, no. 4, p. 205-212.<br />
This paper summarizes several soil <strong>and</strong> geomorphological factors formed since the<br />
Holocene that may affect <strong>Arctic</strong> ecosystems <strong>and</strong> possibly could be used to inform a<br />
permafrost monitoring program. Bylot Isl<strong>and</strong>, Nunavut, Canada, is used as an example site.<br />
Peat-rich soils can assist in interpreting past changes related to the intensity of<br />
geomorphological processes. Accumulation of peat <strong>and</strong> s<strong>and</strong> is closely related to<br />
aggradation of permafrost <strong>and</strong> frost cracking, leading to tundra polygons. Buried vegetation<br />
layers beneath drained lake sediments show changes to lake inundation <strong>and</strong> drainage, <strong>and</strong><br />
pingo formation. Eolian activity may increase in colder <strong>and</strong> drier periods. Based on soil core<br />
samples obtained from many sites on Bylot Isl<strong>and</strong>, areas of the isl<strong>and</strong> support a dynamic <strong>and</strong><br />
sensitive assemblage of polygons, thaw lakes, <strong>and</strong> pingos that have changed continuously<br />
over the last 3,000 years. Surface changes including geomorphology <strong>and</strong> vegetation in a<br />
network of sensitive sites, along with climate <strong>and</strong> permafrost temperature monitoring,<br />
constitute a comprehensive method to assess the affect of climatic changes on l<strong>and</strong> systems.<br />
However, precision mapping of polygon <strong>and</strong> vegetation types, <strong>and</strong> measurements of peat<br />
thickness <strong>and</strong> composition are vital components for adequately monitoring permafrost<br />
feature changes.<br />
3. Are, F.E., 1988, Thermal abrasion of sea coasts: Polar geography <strong>and</strong> geology, v. 12,<br />
no. 1, p. 1-81, no. 2, p. 87-157.<br />
These papers present information on the thermal abrasion of ice-rich permafrost coasts in<br />
Siberia. The author focuses on the shape <strong>and</strong> height of the coastal bluffs, coastal retreat<br />
rates, <strong>and</strong> subsequent lowering of the sea bed. He finds that erosion rates along these ice-rich<br />
coastal bluffs are 3–4 times higher than along comparable non-frozen sediments. The longterm<br />
mean retreat rate for ice-rich coastal bluffs is 10 m/yr <strong>and</strong> maximum observed rates are<br />
about 50 m/yr in some extreme cases.<br />
3
4. Arp, C.D., Jones, B.M., Schmutz, J.A., Urban, F.E., <strong>and</strong> Jorgenson, M.T., 2010, Two<br />
mechanisms of aquatic <strong>and</strong> terrestrial habitat change along an Alaskan <strong>Arctic</strong><br />
coastline: Polar biology, v. 33, no. 12, p. 1629-1640.<br />
This paper examines how coastal erosion <strong>and</strong> storm-surge flooding are affecting coastal<br />
<strong>Arctic</strong> ecosystems in the Teshekpuk Lake Special Area, Alaska (N-TLSA). Long-term<br />
observational records <strong>and</strong> recent short-term monitoring data were analyzed to quantify<br />
erosion rates, coastal lake drainage, <strong>and</strong> amount of salt-burned tundra in the N-TLSA. They<br />
used remote sensing, Systeme Pour l’Observation de la Terre (SPOT) data, <strong>and</strong> aerial<br />
photographs to examine erosion rates <strong>and</strong> habitat changes. Nearby weather data were used to<br />
examine the history of storm events. Pressure transducers were placed at lakes <strong>and</strong> nearshore<br />
ocean locations to record water levels <strong>and</strong> water temperature in 2007. Water-quality<br />
surveys <strong>and</strong> soil-temperature thermistors also were used intermittently at a subset of lakes<br />
from 1977 to 2009 to monitor water levels <strong>and</strong> temperatures. The erosion rate of the<br />
coastline has accelerated, ranging from 6 m/yr during 1955–1979 to 17 m/yr during 2007–<br />
2009. Intensive monitoring indicates high interannual variability in erosion <strong>and</strong> flooding<br />
events. The frequency <strong>and</strong> magnitude of storm events is increasing <strong>and</strong> corresponds to more<br />
lake tapping (draining) <strong>and</strong> flooding events since 2000. The paper estimates that 6 percent of<br />
the l<strong>and</strong>scape consists of salt-burned tundra, while 41 percent is vulnerable to storm-surge<br />
flooding. Westerly storms create extensive flooding, while easterly storms have negligible<br />
effects on lakes <strong>and</strong> coastal tundra. Flooding <strong>and</strong> storm surges are converting coastal<br />
freshwater lakes into brackish lakes <strong>and</strong> estuaries, which affects vegetation <strong>and</strong> aquatic<br />
communities near the coast.<br />
5. Arp, C.D., Jones, B.M., Urban, F.E., <strong>and</strong> Grosse, G., 2011, Hydrogeomorphic processes<br />
of thermokarst lakes with grounded ice <strong>and</strong> floating ice regimes on the <strong>Arctic</strong> coastal<br />
plain, Alaska: Hydrological Processes, v. 25, no. 15, p. 2422–2438.<br />
This paper uses field surveys, remote sensing, <strong>and</strong> hydrological modeling to assess the<br />
relative role of lake expansion <strong>and</strong> water balance on the surface area change of 13<br />
thermokarst lakes north of Teshekpuk, on the <strong>Arctic</strong> Coastal Plain of northern Alaska over a<br />
35-year period. The 13 lakes were distinguished based on depth <strong>and</strong> whether the lake<br />
experienced grounded-ice or floating-ice conditions during the winter period. Shoreline<br />
expansion rates were determined by comparing late-1970s aerial photography with a 2002<br />
orthophoto dataset. Expansion rates ranged from a mean of less than 0.2 m/yr in shallow<br />
lakes to 1.8 m/yr in the deeper lakes, while the mean annual expansion rate for all lakes was<br />
0.9 m/yr. Mean lake depth <strong>and</strong> mean shoreline erosion rate were correlated (coefficient of<br />
determination [R 2 ] is 0.73, p-value is less than 0.01) in this region. The erosion of the 13<br />
lake basins resulted in an increase in surface area of 3.2 percent. A multi-temporal time<br />
series of L<strong>and</strong>sat Thematic Mapper <strong>and</strong> Enhanced Thematic Mapper Plus images at 30-<br />
meter resolution also were assessed for these 13 lakes in an attempt to link changes in<br />
surface area to specific conductance measures <strong>and</strong> modeling of water balance. However, this<br />
analysis was limited because of the relatively coarse resolution associated with the L<strong>and</strong>sat<br />
imagery <strong>and</strong> the inability to accurately resolve feature edges. It was generally determined<br />
that the expansion of these lakes owing to permafrost degradation masked the changes in<br />
water balance, with the exception of two shallow lakes with a stable basin. Based on the<br />
modeling results of water balance, divergent longer-term patterns of water balance were<br />
indicated in shallow lakes compared to deep lakes in the region.<br />
4
6. Arp, C.D., Whitman, M.S., Jones, B.M., Kemnitz, R., Grosse, G., <strong>and</strong> Urban, F.E.,<br />
2012, Drainage network structure <strong>and</strong> hydrologic behavior of three lake-rich<br />
watersheds on the <strong>Arctic</strong> Coastal Plain, Alaska: <strong>Arctic</strong>, Antarctic, <strong>and</strong> Alpine<br />
Research, v. 44, no. 4, p. 385–398.<br />
This paper highlights the importance of lakes <strong>and</strong> drained-lake basins on the hydrological<br />
response in watersheds located on the low-lying <strong>Arctic</strong> Coastal Plain of northern Alaska.<br />
The study area consisted of three primary watersheds, Fish Creek, Judy Creek, <strong>and</strong> the<br />
Ublutuoch River, with a total drainage basin area of about 4,600 km 2 . Most streams in these<br />
watersheds initiate from lake basins, about one-third of the lakes are connected to the fluvial<br />
drainage network, <strong>and</strong> between 17 <strong>and</strong> 26 percent of the watershed drainage density is in<br />
lake basins. Rainfall runoff <strong>and</strong> drought responses also were affected by the proportion of<br />
the l<strong>and</strong>scape covered by lakes relative to drained thaw lake basins (DTLBs). Comparison of<br />
snowmelt <strong>and</strong> base flow recession from a broader set of Alaskan North Slope watersheds<br />
showed little relationship to drainage area, but significant variation was accounted for by<br />
static lake area extent. This high <strong>and</strong> varied level of stream-lake connectivity likely plays a<br />
role in the distribution of aquatic ecosystems <strong>and</strong> fish communities across this l<strong>and</strong>scape.<br />
7. Balser, A.W., Gooseff, M.N., Jones, J.B., <strong>and</strong> Bowden, W.B., 2009, <strong>Thermokarst</strong><br />
distribution <strong>and</strong> relationships to l<strong>and</strong>scape characteristics in the Feniak Lake region,<br />
Noatak National Preserve, Alaska: Final Report to the National Park Service, <strong>Arctic</strong><br />
Network, Fairbanks, Alaska, December 31, 2009, p. 1-12.<br />
This gray literature report details the distribution of thermokarst features for a 3,600-squarekilometer<br />
area centered on Feniak Lake in the Noatak National Park <strong>and</strong> Preserve in the<br />
Brooks Range of Alaska. This region represents a transitional l<strong>and</strong>scape between arctic <strong>and</strong><br />
alpine tundra, <strong>and</strong> boreal shrubl<strong>and</strong>. The methods used in this study were low-altitude<br />
helicopter surveys, ground surveys, low-altitude vertical aerial photography, <strong>and</strong> analysis of<br />
historical Alaska high-altitude photography (AHAP) program images. Mapping of<br />
thermokarst features in the field involved measures of length, width, depth at headwall,<br />
aspect, <strong>and</strong> slope, <strong>and</strong> description of vegetation in <strong>and</strong> around thermokarst features.<br />
Mapping of thermokarst features in the recent <strong>and</strong> historical aerial photographs was done<br />
manually following georectification of the photography to a L<strong>and</strong>sat 7 Enhanced Thematic<br />
Mapper Plus image of the study region. The accuracy of the rectification <strong>and</strong> the horizontal<br />
location of mapped thermokarst features were about 4 meters. Based on the aerial photo<br />
mission from 2006, the authors mapped 503 thermokarst features in the Feniak Lake study<br />
area that included active layer detachment slides (389), retrogressive thaw slumps (79),<br />
thermokarst gullies (28), <strong>and</strong> glacial thermokarst features (7). When comparing the features<br />
from 2006 to the features apparent aerial photography from about the 1980s period, the<br />
authors observed a twofold increase in the number of thermokarst’ features over the 25-year<br />
period. The distribution of the thermokarst features aligned well with various l<strong>and</strong>scape<br />
associations based on slope, l<strong>and</strong> cover, <strong>and</strong> lithology. In particular, thermokarst features<br />
were observed almost exclusively on non-carbonate lithologies <strong>and</strong> in wet sedge meadow<br />
<strong>and</strong> low shrub-tussock tundra. The increase in thermokarst features was attributed to more<br />
frequent periods of hot, sunny summer weather. The authors also noted the presence of<br />
several stabilized thermokarst features that likely represented past periods of permafrost<br />
thaw in the region.<br />
5
8. Benninghoff, W.S., 1952, Interaction of vegetation <strong>and</strong> soil frost phenomena: <strong>Arctic</strong>,<br />
v. 5, no. 1, p. 34–44.<br />
This paper describes the influence of frozen soils on the establishment <strong>and</strong> propagation of<br />
vegetation communities, <strong>and</strong> the converse of this. Frozen soils exert great force <strong>and</strong> trauma<br />
on root systems of plants through repeated freeze-thaw cycles, differential frost heaving,<br />
cracks caused by rapid freezing, <strong>and</strong> so on. Plants have adapted shallow root systems to<br />
adapt to impervious permafrost, which make trees <strong>and</strong> shrubs easy to overturn in inclement<br />
weather or wind storms. Insufficient depth for the proper functioning of roots limits spruce<br />
forest, <strong>and</strong> species with flexibility of their root habits are most likely to establish themselves<br />
in permafrost areas. Furthermore, plants may be subjected to severe water loss by exposure<br />
to drying winds while roots are encased in frozen soil <strong>and</strong> cannot absorb water, which may<br />
also be a contributing factor that limits tree growth in permafrost terrain. <strong>Thermokarst</strong><br />
features caused by the melting of variable amounts of ice in the soil change the physical<br />
environment for vegetation occupying a site. Margins of lakes with high permafrost tables<br />
are particularly susceptible to destruction, In the Nebesna, Chisana, <strong>and</strong> Tanana River<br />
valleys of eastern Alaska, previous research estimated mean shore retreat of 2.3–7.5 in./yr.<br />
The oriented lakes of the <strong>Arctic</strong> Coastal Plain were shown as constantly changing, owing to<br />
caving of shores, draining, filling with peat, <strong>and</strong> initiation of new thaw cycles. All<br />
permafrost areas are characterized by the instability of the surface <strong>and</strong> consequent transience<br />
of site conditions. Vegetation also influences frozen soils. It shields the soil from maximum<br />
penetration of heat through shading, decreases air circulation, retains moisture in <strong>and</strong> just<br />
above the soil, prevents thaw through root systems, intercepts rain, <strong>and</strong> cools the soil<br />
through evaporation of moisture on plant surfaces. Mosses may play an important part in<br />
this effect. Removal of moss, thick turf, <strong>and</strong> surface peat greatly hastens thawing of frozen<br />
ground. However, vegetation also can warm soils by impeding heat radiation from the soil to<br />
the cold air <strong>and</strong> retaining snow cover, which insulates the ground from lower temperatures.<br />
Vegetation may be important for reducing frost disturbance in tundra through anchoring<br />
roots to the soil <strong>and</strong> the insulating effects of the aboveground plant parts. Because of soil<br />
frost changes following disturbance, the affected surface <strong>and</strong> the local environment may<br />
change so much that entirely different communities occupy the site for unknown time<br />
periods.<br />
9. Billings, W.D., <strong>and</strong> Peterson, K.M., 1980, Vegetational change <strong>and</strong> ice-wedge polygons<br />
through the thaw-lake cycle in arctic Alaska: <strong>Arctic</strong> <strong>and</strong> Alpine Research, p. 413–432.<br />
This paper provides an overview of the thermokarst lake cycle through the study of<br />
vegetation succession in a chronosequence of drained thermokarst lake basins near Barrow,<br />
Alaska. Pioneer species in recently drained lake basins consisted of Dupontia fischerii <strong>and</strong><br />
Arctophila fulva. As time passes since drainage, Carex aquatilis becomes more abundant as<br />
does the development of ice-wedge polygonal networks.<br />
6
10. Bilodeau, F., Reid, D.G., Gauthier, G., Krebs, C.J., Berteaux, D., <strong>and</strong> Kenney, A.J.,<br />
2012, Demographic response of tundra small mammals to a snow fencing experiment:<br />
Oikos, doi:10.1111/j.1600-0706.2012.00220.x.<br />
Models predict snow cover will increase in the <strong>Arctic</strong> with warmer temperatures. Brown <strong>and</strong><br />
collared lemmings, which prefer deep snow for winter nesting <strong>and</strong> to avoid predation, may<br />
benefit from additional snow depth. However, foxes could focus on areas with greater small<br />
mammal abundance <strong>and</strong> counteract any gains for small mammals from deeper snow cover.<br />
This study experimentally manipulated snow cover using snow fences to examine potential<br />
effects of deeper snow cover on small mammal populations in the Canadian <strong>Arctic</strong>. Small<br />
mammal nest density was 1.5 times greater in experimental areas, but gains did not mean<br />
larger populations, more lactating females or signs of reproduction in winter nests, or greater<br />
numbers of juveniles in the spring. The authors speculate that once snow melted, lemmings<br />
redistributed themselves to take advantage of summer forage. Results on predation were<br />
inconclusive.<br />
11. Black, R.F., 1969, Geology, especially geomorphology, of northern Alaska: <strong>Arctic</strong>,<br />
v. 22, p. 3, p. 283–299.<br />
This paper provides a broad overview of the geomorphology of northern Alaska from the<br />
Brooks Range to the <strong>Arctic</strong> Coastal Plain, with an emphasis on the role of the Naval <strong>Arctic</strong><br />
Research Laboratory in the region. Because much of this early work was concentrated<br />
around Barrow, Alaska, the two most important l<strong>and</strong>forms studied were the oriented lakes<br />
<strong>and</strong> ice-wedge polygons. Many hypotheses about the oriented lakes near Barrow were<br />
reviewed. The author helped resolve a debate on the formation of ice wedges with the help<br />
of his wife Herelda. The paper offers many suggestions for future geomorphological studies<br />
in the region.<br />
12. Black, R.F., 1969, Thaw depressions <strong>and</strong> thaw lakes, a review: Biuletyn Peryglacjalny,<br />
v. 19, p. 131–150.<br />
This review paper provides an overview on the state of knowledge regarding thermokarst<br />
depressions <strong>and</strong> thermokarst lakes in the late 1960s. Much effort was spent studying<br />
thermokarst lakes in the late-1950s <strong>and</strong> throughout the 1960s, based primarily in Barrow,<br />
Alaska. Instead of citing all this literature, we have chosen to cite this review paper because<br />
it references all this literature. This paper provides details on the background of thermokarst<br />
lake-related research, a synopsis of the processes responsible for their formation <strong>and</strong><br />
drainage, <strong>and</strong> suggestions for future study.<br />
13. Bowden, W.B., 2010, Climate change in the <strong>Arctic</strong>–<strong>Permafrost</strong>, thermokarst, <strong>and</strong> Why<br />
They Matter to the Non-<strong>Arctic</strong> World: Geography Compass, v. 4, no. 10, 1553-1566,<br />
doi: 10.1111/j.1749-8198.2010.00390.x.<br />
This paper presents an overview on the arctic environment, permafrost characteristics, <strong>and</strong><br />
the role of thermokarst features as indicators of current climate change <strong>and</strong> as possible<br />
agents of future change. The paper presents information on a few thermokarst l<strong>and</strong>forms<br />
however there is no information on rates of change or spatial distribution. The paper<br />
concludes with a section on thermokarst in a changing <strong>Arctic</strong> from a systems perspective. A<br />
diagram of the role of thermokarst in the evolution of an <strong>Arctic</strong> l<strong>and</strong>scape in a warmer <strong>and</strong><br />
wetter climate is shown in figure 5 of the paper. This paper is geared to the non-<strong>Arctic</strong><br />
community.<br />
7
14. Bowden, W.B., Gooseff, M.N., Balser, A., Green, A., Peterson, B.J., <strong>and</strong> Bradford, J.,<br />
2008, Sediment <strong>and</strong> nutrient delivery from thermokarst features in the foothills of the<br />
North Slope, Alaska—Potential impacts on headwater stream ecosystems: Journal of<br />
Geophysical Research, v. 113, G02026, doi: 10.1029/2007JG000470.<br />
<strong>Thermokarst</strong> features are increasing near the Toolik Lake Natural Research Area, <strong>and</strong> these<br />
features are delivering nutrients <strong>and</strong> sediments to headwater streams. These additions are at<br />
levels that are well above background levels, <strong>and</strong> at concentrations that have been found to<br />
significantly affect primary <strong>and</strong> secondary production in water bodies. Although thermokarst<br />
features only affect a finite area on the terrestrial l<strong>and</strong>scape, their effects may be felt<br />
throughout a very large fraction of the stream network. <strong>Thermokarst</strong>ing increased smallstream<br />
total suspended sediments (TSS) by several orders of magnitude, <strong>and</strong> increased<br />
Toolik River TSS by about one order of magnitude. Nutrients increased downstream of<br />
thermokarst features, <strong>and</strong> remained elevated for several hundred meters downstream.<br />
Sampling of another nearby feature indicated that nutrient outflows from thermokarst<br />
features have elevated stream concentrations of nutrients during the period of record (1999–<br />
2005).<br />
15. Burn, C.R., 1992, <strong>Thermokarst</strong> lakes: Canadian Geographer-Le Géographe Canadien,<br />
v. 36, no. 1, p. 81–85.<br />
This paper provides an overview of thermokarst lakes as a primary example of thermokarst<br />
l<strong>and</strong>forms in regions that contain ice-rich permafrost. Information is provided on lake<br />
initiation <strong>and</strong> development, the thermal regime of lakes <strong>and</strong> its effects on permafrost<br />
temperature, <strong>and</strong> the cessation of lake growth <strong>and</strong> ultimately lake drainage. Lake expansion<br />
rates of about 0.7 m/yr were noted from a previous study focused on lakes near Mayo,<br />
Canada. The author noted the extensive Russian literature on the subject, much of which has<br />
not been translated, <strong>and</strong> the usefulness of monitoring <strong>and</strong> studying thermokarst lakes as they<br />
are a surface expression of the response of permafrost to climate change.<br />
16. Burn, C.R., 2000, The thermal regime of a retrogressive thaw slump near Mayo,<br />
Yukon Territory: Canadian Journal of Earth Sciences, v. 37, no. 7, p. 967–981.<br />
This paper presents details on the formation <strong>and</strong> stabilization of a retrogressive thaw slump<br />
in Canada through the use of detailed field studies <strong>and</strong> instrumentation. Date loggers were<br />
installed in the slump floor <strong>and</strong> in undisturbed terrain. The temperature of the slump floor<br />
was warmer in both the summer <strong>and</strong> winter, <strong>and</strong> the net result was 4°C warming of the<br />
ground. The dominant mode of heat transfer in the thaw slump was conduction. Information<br />
also was presented on permafrost aggradation in a stabilized thaw slump in the region.<br />
8
17. Burn, C.R., 2002, Tundra lakes <strong>and</strong> permafrost, Richards Isl<strong>and</strong>, western <strong>Arctic</strong> coast,<br />
Canada: Canadian Journal of Earth Sciences, p. 39, no. 8, p. 1281–1298.<br />
This paper describes the role of tundra lakes on permafrost conditions for a location on<br />
Richards Isl<strong>and</strong> in the western Canadian <strong>Arctic</strong>. The author reports water <strong>and</strong> lake-bottom<br />
temperature measurements, the configuration of permafrost, <strong>and</strong> active layer thicknesses<br />
from 1992 to 1997 for one site. The lake study site consists of a deep central pool with<br />
shallow littoral shelves. The annual mean temperature measured at the lake bottom in the<br />
central pool ranged from 1.5°C to 4.8°C, depending on depth, <strong>and</strong> from -0.2°C to -5°C on<br />
the terraces, owing to differences in snow cover <strong>and</strong> nearness to the central pool. Therefore,<br />
the temperature of permafrost at a depth of 7 m in the terraces also varied, from -2°C near<br />
shore to -5°C in mid-terrace. The active layer in the terraces was uniformly 1.4 m deep.<br />
Geothermal modeling based on the field data indicates that there likely is a through-going<br />
talik below the central pool. Scaling this observation to the rest of the isl<strong>and</strong>, at least 10–15<br />
percent of the isl<strong>and</strong> was underlain by a talik.<br />
18. Burn, C.R., 2005, Lake‐bottom thermal regimes, western <strong>Arctic</strong> coast, Canada:<br />
<strong>Permafrost</strong> <strong>and</strong> Periglacial Processes, v. 16, no. 4, p. 355–367.<br />
This paper presents lake-bottom temperature data for two lakes with littoral shelves, a<br />
residual pond in a drained lake basin, <strong>and</strong> a lake located in the taiga. Temperature data were<br />
collected over several years. Lake-bottom annual mean temperatures were greatest for the<br />
taiga lake (5°C) owing to the lack of ice growth in the winter. The tundra lakes with littoral<br />
shelves had mean annual temperatures of about 3°C in the deep central part of the lake <strong>and</strong> -<br />
2°C in the littoral shelves. Given projected warming in the region, the tundra lakes may<br />
transition to resemble the thermal regime of taiga lakes, <strong>and</strong> this will affect<br />
talik configuration.<br />
19. Burn, C.R., <strong>and</strong> Friele, P.A., 1989, Geomorphology, vegetation succession, soil<br />
characteristics <strong>and</strong> permafrost in retrogressive thaw slumps near Mayo, Yukon<br />
Territory: <strong>Arctic</strong>, p. 31–40.<br />
This paper describes two active <strong>and</strong> one stable retrogressive thaw slumps formed along a<br />
river-cut bank that flows through ice-rich, glaciolacustrine sediments in the Yukon Territory.<br />
Field surveys were combined with aerial photography to document the development of the<br />
two active thaw slumps since 1949, vegetation succession on the floors of all three slumps,<br />
<strong>and</strong> the short-term soil development on surfaces of various ages in the slumps. All slumps<br />
were thought to have been formed after riverbank erosion exposed the ice-rich sediment.<br />
Since the start of the two active thaw slumps, mean headwall retreat has varied between 12<br />
<strong>and</strong> 14 m/yr, with maximum retreat rates of 16 m/yr. Measured retreat rates of thaw slump<br />
headwalls for various locations in the <strong>Arctic</strong> range from 1 to 18 m/yr (table 2 in this paper).<br />
The reestablishment of plant communities is associated with the initiation of soil<br />
development in fresh soil substrata <strong>and</strong> is well advanced after 40 years succession of closedspruce<br />
forest.<br />
9
20. Burn, C.R., <strong>and</strong> Smith, M.W., 2006, Development of thermokarst lakes during the<br />
Holocene at sites near Mayo, Yukon Territory: <strong>Permafrost</strong> <strong>and</strong> Periglacial Processes,<br />
v. 1, no. 2, p. 161–175.<br />
This paper describes the formation of thermokarst lakes in the boreal forest region of the<br />
Yukon Territory using ground surveys, remote sensing, <strong>and</strong> dendrochronology. The paper<br />
describes the growth of thermokarst lakes through analysis of aerial photography <strong>and</strong> treering<br />
series obtained from submerged trees in the exp<strong>and</strong>ing lake margins. The mean axial<br />
growth rate of 16 thermokarst lakes is presented in table 1. The mean growth of lakes was<br />
0.7 m/yr along their long axis <strong>and</strong> 0.5 m/yr along their short axis. The maximum observed<br />
expansion rate was 1.2 m/yr. The expansion rate of lakes likely is not constant from year to<br />
year <strong>and</strong>, during particularly warm summers, stable banks may be reactivated <strong>and</strong> lake<br />
expansion may accelerate. Tree-ring analysis <strong>and</strong> measurements of lake talik thickness<br />
indicate that the lakes likely formed in the mid-1800s. Estimates of talik formation indicated<br />
vertical degradation of permafrost of about 0.5 to 1 m/yr. The authors provided a context in<br />
which to interpret the formation of thermokarst lakes in the region throughout the Holocene<br />
<strong>and</strong> suggested that these lakes likely were formed following a forest fire.<br />
21. Cabot, E.C., 1947, The northern Alaskan coastal plain interpreted from aerial<br />
photographs: Geographical Review, v. 37, no. 4, p. 639–648.<br />
This paper describes the utility of black <strong>and</strong> white, vertical <strong>and</strong> oblique aerial photography<br />
for describing permafrost-related l<strong>and</strong>forms in northern Alaska. There is a brief discussion<br />
on the formation of lakes <strong>and</strong> ponds in the region, elongation of lakes, drainage of lakes, <strong>and</strong><br />
a lake cycle. The author noted the role of floating lake ice pans <strong>and</strong> mechanical erosion of<br />
shorelines in the expansion of lakes <strong>and</strong> the role of bank overflow during breakup as a key<br />
process for lake drainage.<br />
22. Chen, W., Chen, W., Li, J., Zhang, Y., Fraser, R., Olthof, I., .<strong>and</strong> Chen, Z., 2012,<br />
Mapping Aboveground <strong>and</strong> Foliage Biomass Over the Porcupine Caribou Habitat in<br />
Northern Yukon <strong>and</strong> Alaska Using L<strong>and</strong>sat <strong>and</strong> JERS-1/SAR Data, Remote Sensing of<br />
Biomass - Principles <strong>and</strong> Applications, Dr. Lola Fatoyinbo (Ed.), ISBN: 978-953-51-<br />
0313-4, InTech, DOI: 10.5772/19219.<br />
This article used L<strong>and</strong>sat imagery <strong>and</strong> remote sensing techniques to map the aboveground<br />
biomass <strong>and</strong> foliage biomass of the range of the Porcupine caribou herd. The area includes<br />
part of the <strong>Arctic</strong> Wildlife Refuge on the <strong>Arctic</strong> Coastal Plain, Alaska, <strong>and</strong> western Yukon<br />
<strong>and</strong> Northwest Territories, Canada. Field studies were done to ground-truth satellite images<br />
in the middle of the growing season. Habitat characteristics were measured <strong>and</strong> those<br />
characteristics were related to satellite images of the same area to predict biomass across the<br />
entire range. Measured aboveground biomass ranged from 10 to 100 t/ha for sparsely<br />
forested woodl<strong>and</strong>s, 1 to 100 t/ha for low-high shrub sites, <strong>and</strong> 0.5 to 10 t/ha for mixed<br />
graminoids-dwarf shrub-herb sites. Biomass was similar on the calving <strong>and</strong> breeding<br />
grounds for the Porcupine caribou herd, which was greater than what is available to the<br />
Bathurst caribou herd. This may explain partially why the Bathurst herd leaves their calving<br />
grounds soon after giving birth, while the Porcupine herd stays at their calving grounds<br />
much longer, <strong>and</strong> Porcupine herd calves grow faster <strong>and</strong> weigh more than Bathurst herd<br />
calves.<br />
10
23. Chen, M., Rowl<strong>and</strong>, J.C., Wilson, C.J., Altmann, G.L., <strong>and</strong> Brumby, S.P., 2012,<br />
Temporal <strong>and</strong> spatial pattern of thermokarst lake area changes at Yukon Flats,<br />
Alaska: Hydrological Processes, online publication, 10.1002/hyp.9642.<br />
This paper provides further evidence that lakes in the Yukon Flats region of Alaska have<br />
dynamic surface areas. Closed-basin lakes were selected from L<strong>and</strong>sat data acquired<br />
between 1984 <strong>and</strong> 2009 for a 422-km 2 study area. Eighty percent of the variation in surface<br />
water area was explained by local water balance <strong>and</strong> mean temperature following snowmelt.<br />
Nearly 14 percent of the change during the study period was determined to represent longterm<br />
change. The authors hypothesized that most of the lake change resulted from the<br />
presence or absence of ice-jam flooding.<br />
24. Christensen, T. R., Johansson, T., Åkerman, H. J., Mastepanov, M., Malmer, N.,<br />
Friborg, T., Crill, P., <strong>and</strong> Svensson, B. H., 2004, Thawing sub-arctic permafrost—<br />
Effects on vegetation <strong>and</strong> methane emissions, Geophysical Research Letters, v. 31,<br />
no. 4, L04501.<br />
This paper examines changes in methane fluxes from 1970 to 2000 associated with<br />
increasing active-layer depths <strong>and</strong> a change in vegetation type <strong>and</strong> distribution. Vegetation<br />
shifted from shrub-dominated, elevated, ombrotrophic conditions to wet, graminoiddominated,<br />
nutrient-rich, minerotrophic conditions, corresponding to changes in the<br />
underlying permafrost distribution. Historical methane fluxes were estimated given fieldmeasured<br />
methane fluxes determined from individual vegetation types using chamber<br />
fluxes. The microtopographical <strong>and</strong> hydrological changes indicated by vegetation change<br />
have increased the l<strong>and</strong>scape scale methane emissions by 22–66 percent over this 30-year<br />
period. Regional differences may be important, as permafrost thaw may lead to drying <strong>and</strong>,<br />
therefore, decreased methane emissions in some locations.<br />
25. Costard, F., Gautier, E., Brunstein, D., Hammadi, J., Fedorov, A., Yang, D., <strong>and</strong><br />
Dupeyrat, L., 2007, Impact of the global warming on the fluvial thermal erosion over<br />
the Lena River in Central Siberia: Geophysical Research Letters, v. 34, no. 14, L14501.<br />
This paper links climatic changes in Central Siberia to fluvial erosion of the Lena River.<br />
Three major changes since the 1980s are noted: reduced winter ice thickness, increased<br />
spring water temperature (up to 2°C), <strong>and</strong> a slight increase in spring discharge. Areal <strong>and</strong><br />
satellite maps were used to observe the effects of these fluvial changes on the riverbanks <strong>and</strong><br />
vegetated isl<strong>and</strong>s. The most obvious change was accelerated head retreat in vegetated<br />
isl<strong>and</strong>s, which increased by 21–24.5 percent. These rates are consistent with predictions<br />
from an ablation model, from which it was determined that the water temperature increase<br />
was a 4-times-more important explanatory variable than the discharge increase. Deposition<br />
of sediments on wide bars <strong>and</strong> long isl<strong>and</strong>s suggests that eroded sediment is not transported<br />
far, but means that isl<strong>and</strong>s migrate faster.<br />
11
26. Czudek, T., <strong>and</strong> Demek, J., 1970, <strong>Thermokarst</strong> in Siberia <strong>and</strong> its influence on the<br />
development of lowl<strong>and</strong> relief: Quaternary Research, v. 1, no. 1), p. 103–120.<br />
This paper presents an overview on the development of thermokarst l<strong>and</strong>forms <strong>and</strong> their role<br />
in lowering the elevation of the regional l<strong>and</strong> surface in the Siberian lowl<strong>and</strong>s. Two modes<br />
of thermokarst development are distinguished: (1) back-wearing <strong>and</strong> (2) down-wearing.<br />
Back-wearing refers to the lateral development of thermokarst features <strong>and</strong> results in the<br />
formation of gullies, thermocirques, <strong>and</strong> slump head walls. Down-wearing refers to<br />
formation of thermokarst through an increase in the active-layer thickness or the top-down<br />
thaw of permafrost that leads to development of “alas” terrain. Back-wearing features tend<br />
to be more local in nature <strong>and</strong> down-wearing features tend to be more regional in nature.<br />
The extent of the geomorphic changes for all thermokarst features depends on the tectonic<br />
regime of the region (stable, rising, or lowering), the ice content of the soil <strong>and</strong> the presence<br />
of epigenetic or syngenetic permafrost, <strong>and</strong> the rate of disequilbrium disturbance or the<br />
disturbance to the ground thermal regime. The paper has several diagrams showing the<br />
formation of various thermokarst features. This paper is mostly descriptive in nature <strong>and</strong><br />
does not contain information on the rates of thermokarst formation nor the regional<br />
distribution.<br />
27. Daanen, R.P., Grosse, G., Darrow, M.M., Hamilton, T.D., <strong>and</strong> Jones, B.M., 2012,<br />
Rapid movement of frozen debris-lobes—Implications for permafrost degradation <strong>and</strong><br />
slope instability in the south-central Brooks Range, Alaska. Natural Hazards <strong>and</strong><br />
Earth System Sciences, v. 12, p. 1521–1537.<br />
This paper describes reconnaissance-level investigations of unusual debris mass movement<br />
features (referred to as “frozen debris-lobes”) in the south-central Brooks Range of Alaska.<br />
A combination of ground-surveys, remote sensing, <strong>and</strong> field <strong>and</strong> laboratory measurements,<br />
<strong>and</strong> time-lapse observations were used to document the movement indicators that include<br />
toppling trees, slumps <strong>and</strong> scarps, detachment slides, striation marks on frozen sediment<br />
slabs, buried trees <strong>and</strong> other vegetation, mudflows, <strong>and</strong> large cracks in the lobe surface.<br />
Some of the frozen debris lobe features are greater than 100 m in width, 20 m in height, <strong>and</strong><br />
1,000 m in length. The features have responded to climate change by increasing in their<br />
downslope movement during the last several decades. Mean annual rates of movement were<br />
from 2 to 4 m/yr over decadal time periods. The features showed signs of creep, slumping,<br />
viscous flow, blockfall <strong>and</strong> leaching of fines in warm seasons; <strong>and</strong> creep <strong>and</strong> sliding of<br />
frozen sediment slabs in cold seasons. The potential hazard of one frozen debris lobe feature<br />
as it encroached on the Dalton Highway was highlighted.<br />
28. Dallimore, S.R., Wolfe, S.A., <strong>and</strong> Solomon, S.M., 1996, Influence of ground ice <strong>and</strong><br />
permafrost on coastal evolution, Richards Isl<strong>and</strong>, Beaufort Sea coast, NWT: Canadian<br />
Journal of Earth Sciences, v. 33, no. 5, p. 664–675.<br />
This paper provides information on the role of ground ice on coastal change for Richards<br />
Isl<strong>and</strong>, Canada. Excess ice content for the coastal segment was estimated at 20 percent <strong>and</strong>,<br />
when this was considered, the balance between headl<strong>and</strong> erosion <strong>and</strong> coastal deposition was<br />
in near equilibrium. The coastal part eroded by thermo-mechanical niche erosion <strong>and</strong> block<br />
collapse as well as permafrost slumping. Parts of the coast with higher ice content tended to<br />
erode faster than less ice-rich coastal area. Mean annual coastal erosion rates ranged from 1<br />
to 2 m/yr between 1947 <strong>and</strong> 1985.<br />
12
29. Dupeyrat, L., Costard, F., R<strong>and</strong>riamazaoro, R., Gailhardis, E., Gautier, E., <strong>and</strong><br />
Fedorov, A., 2011, Effects of ice content on the thermal erosion of permafrost—<br />
Implications for coastal <strong>and</strong> fluvial erosion: <strong>Permafrost</strong> <strong>and</strong> Periglacial Processes,<br />
v. 22, no. 2, p. 179–187.<br />
This paper considers the relative importance of thaw versus ablation in eroding frozen, noncohesive<br />
riverbanks using mathematical models <strong>and</strong> laboratory experiments. The<br />
experimental results of the authors can be matched by a purely ablational model above a<br />
critical ice content threshold (depending on the Reynolds number of the water). Below this<br />
threshold, sediments will thaw, but may or may not move depending on the erosive power of<br />
the water <strong>and</strong> the strength of the medium. The main factor controlling thermal erosion is<br />
usually water temperature, as opposed to ground temperature. This model may explain the<br />
apparently contradictory field observations of erosion potential of the banks of the Lena<br />
River.<br />
30. Eisner, W. R., <strong>and</strong> Peterson, K. M., 1998, High-resolution pollen analysis of tundra<br />
polygons from the North Slope of Alaska: Journal of Geophysical Research, v. 103,<br />
no. D22, p. 28929–28937.<br />
This paper uses palynology along a transect of ice-wedge polygon centers adjacent to the<br />
Meade River near the village of Atqasuk, Alaska. The authors showed the ability of pollen<br />
analysis to detect long- <strong>and</strong> short-term changes in vegetation associated with climate as well<br />
as l<strong>and</strong>scape change.<br />
31. Fedorov, A., <strong>and</strong> Konstantinov, P., 2003, Observations of surface dynamics with<br />
thermokarst initiation, Yukechi site, Central Yakutia, in Proceedings of the Eighth<br />
International Conference on <strong>Permafrost</strong>, July 21–25, 2003, Zurich, Switzerl<strong>and</strong>,<br />
p. 239–243.<br />
This paper summarizes thermokarst activity <strong>and</strong> rates of permafrost thaw <strong>and</strong> subsidence for<br />
ice-rich, flat, inter-alas meadows <strong>and</strong> shallow thermokarst depressions near Yakutsk, Siberia<br />
from 1992 to 2001. In the years of monitoring, the bottom of thermokarst lakes in the area<br />
deepened <strong>and</strong> exp<strong>and</strong>ed <strong>and</strong> separate lakes joined together. Before the authors’ observations,<br />
the studied sites had maintained their original shapes for 50 years. Intense warming during<br />
the 1990s <strong>and</strong> the high ice content of the soils in the area may explain the observed rapid<br />
changes. Surface subsidence on flat areas from 1993 to 2001 was 7–8 cm, <strong>and</strong> up to 14–15<br />
cm on the edges of small thaw lakes. Surface subsidence may not always be correlated with<br />
individual elements of climate, but, rather, multiple factors acting together may either<br />
enhance or inhibit thawing <strong>and</strong> thermokarst formation. For example, in 1998, there were<br />
high summer temperatures in Yakutia, but these temperatures did not affect subsidence,<br />
which could be explained by enhanced biota productivity. An index of larch tree-ring<br />
growth for that year was 43 percent higher than the long-term norm.<br />
13
32. Fortier, D., Allard, M., <strong>and</strong> Shur, Y., 2007, Observation of rapid drainage system<br />
development by thermal erosion of ice wedges on Bylot Isl<strong>and</strong>, Canadian <strong>Arctic</strong><br />
Archipelago: <strong>Permafrost</strong> <strong>and</strong> Periglacial Processes, v. 18, no. 3, p. 229–243.<br />
This paper describes the rapid development of a 750-m-long drainage system through the<br />
process of thermal erosion of ice wedges over a 4-year period on Bylot Isl<strong>and</strong>, Canada. The<br />
gully system was created by the formation of sinkholes in ice wedges, which resulted from<br />
water flowing through open frost cracks. The sinkholes evolved into underground tunnels<br />
that subsequently widened <strong>and</strong> led to the collapse of the overlying roof of tundra peat <strong>and</strong><br />
vegetation. Over the 4-year period, open gully headwalls retreated at a mean rate of 15.5<br />
m/yr with maximum rates of about 5 m/d following snowmelt <strong>and</strong> subsequent runoff. The<br />
drainage gully stabilized after a period of 4 years. Development of this new drainage<br />
network affected the local hydrology of the hillslope in which it formed. Towards the end of<br />
the thaw season, the gully system provided a channel in which to route drainage from the<br />
active layer, melting ice wedges, <strong>and</strong> thawing permafrost to the proglacial river at the base<br />
of the slope. Further studies on a regional scale are recommended to assess whether these<br />
features <strong>and</strong> processes are widespread or the result of rare local factors encountered on Bylot<br />
Isl<strong>and</strong>.<br />
33. Francis, J.A., White, D.M., Cassano, J.J., Gutowski Jr., W.J., Hinzman, L.D., Holl<strong>and</strong>,<br />
M.M., Steele, M.A., <strong>and</strong> Vörösmarty, C.J,. 2009, An arctic hydrologic system in<br />
transition—Feedbacks <strong>and</strong> impacts on terrestrial, marine, <strong>and</strong> human life: Journal of<br />
Geophysical Research, v. 114, no. G4, G04019.<br />
This paper divides the arctic hydrologic system into interrelated components <strong>and</strong><br />
heuristically (that is, graphically) shows their relationship with the biological system<br />
(marine <strong>and</strong> terrestrial). The paper also shows feedback loops <strong>and</strong> visually assesses the<br />
arctic hydrologic system in a seasonally ice free state. Specifically, the hydrologic system<br />
was divided into subsystems emphasizing interactions that occur primarily within the<br />
atmospheric, oceanic, terrestrial, or global systems. Hydrological subsystems include factors<br />
such as cloud cover, total column water vapor, surface air temperature, annual-mean net<br />
precipitation, <strong>and</strong> sea-ice thickness <strong>and</strong> area. Biological subsystems include human wellbeing,<br />
marine primary productivity, <strong>and</strong> l<strong>and</strong> cover-ecosystem-vegetation. The paper found<br />
that the atmosphere drives much of the arctic hydrological cycle, both directly through net<br />
precipitation <strong>and</strong> indirectly through energy-transfer processes that affect the surface.<br />
Furthermore, at least three of these subsystems have changed demonstrably since the 1970s,<br />
affecting all components of the system. The paper also provides tables of the overall effect<br />
(with direction) of each physical feedback on a biological component of the system. Some<br />
notable relationships include possible increases in nutrients to coastal water <strong>and</strong> marine<br />
productivity resulting from freshwater runoff from l<strong>and</strong> but also increases in surface<br />
stratification, which reduces mixing of nutrients from below. Similarly, increased surface<br />
freshwater increases stratification, which keeps organisms near light sources but blocks<br />
upwelling of nutrients from deeper layers. Warmer air temperatures will benefit some<br />
species of phytoplankton <strong>and</strong> zooplankton <strong>and</strong> reduce others.<br />
14
34. French, H.M., 1974, Active thermokarst processes, eastern Banks Isl<strong>and</strong>, western<br />
Canadian arctic: Canadian Journal of Earth Sciences, v. 11, no. 6, p. 785–794.<br />
This paper describes various active thermokarst processes occurring on Banks Isl<strong>and</strong> in the<br />
western Canadian <strong>Arctic</strong>, a region underlain by ice-rich glacial silt, s<strong>and</strong>, <strong>and</strong> gravel. The<br />
primary features in this area are ground-ice slumps (thaw slumps). The mean retreat rate of<br />
thaw slump headwalls was observed at between 8 <strong>and</strong> 10 cm/d <strong>and</strong>, assuming a duration of<br />
75 days in the thaw season, maximum retreat rates of 6 to 8 m/yr were possible. Initiation of<br />
the thaw slumps is thought to result from local geomorphic factors, together with rapid<br />
thermal erosion along ice wedges. The headwall retreat rate primarily was a function of<br />
ground-ice content, <strong>and</strong> the ultimate stabilization of the slump was related to the balance<br />
between the rate at which debris is supplied to, <strong>and</strong> removed from, the base of the headwall.<br />
Based on these estimated rates of retreat <strong>and</strong> analysis of slumps in aerial photographs, the<br />
author speculated that the slumps likely stabilize in 30 to 50 years after their initiation.<br />
35. French, H.M., 1975, Man-induced thermokarst, Sachs Harbour Airstrip, Banks Isl<strong>and</strong>,<br />
Northwest Territories: Canadian Journal of Earth Sciences, v. 12, no. 2, p. 132–144.<br />
This paper describes the degradation of ice wedges associated with the installation of an<br />
airstrip on Banks Isl<strong>and</strong>, Canada. The silts, s<strong>and</strong>s, <strong>and</strong> gravel that underlie the surface are<br />
ice-rich, with values ranging from 20 to 95percent excess ice content. Degradation of ice<br />
wedges <strong>and</strong> development of thermokarst occurred rapidly in the first 3 years following<br />
construction of the airstrip, <strong>and</strong> subsidence of about 10 cm was measured using survey<br />
equipment. Repeat surveys at the site in the first decade following disturbance indicated that<br />
thermokarst is still progressing actively at the site. In one summer, a 22-m-long gully<br />
formed that bisected the airstrip.<br />
36. French, H., <strong>and</strong> Shur, Y., 2010, The principles of cryostratigraphy: Earth-Science<br />
Reviews, v. 101, no. 3, p. 190–206.<br />
This paper provides background information related to the field of cryostratigraphy, which<br />
adopts concepts from Russian geocryology as well as modern sedimentology. The primary<br />
objective of cryostratigraphy is to provide information on the genesis of perennially frozen<br />
sediments. Various layers or distinct zones in permafrost can be distinguished as being<br />
representative of different cryostructures. Cryostructures are defined as structures formed by<br />
the amount <strong>and</strong> distribution of ice within sediment <strong>and</strong> rock. Information on cryostructures<br />
is essential for determining the amount of potential thaw settlement at a given site <strong>and</strong> the<br />
likelihood of thermokarst formation. A schematic of the North American cryostructure<br />
classification system is shown in figure 5 of the paper.<br />
37. Frey, K.E., <strong>and</strong> McClell<strong>and</strong>, J.W., 2009, Impacts of permafrost degradation on arctic<br />
river biogeochemistry: Hydrological Processes, v. 23, no. 1, p. 169–182.<br />
This paper presents a review of studies linking permafrost dynamics to river<br />
biogeochemistry. An overarching theme is that these systems may evolve from surface<br />
water- to groundwater-dominated systems as permafrost thaws. This likely will have<br />
consequences for solute <strong>and</strong> nutrient delivery; however, there is little consensus on how<br />
river solute concentrations will change. There also are uncertainties in the magnitude of<br />
these changes because we are unable to accurately predict how river hydrographs will<br />
change in the future. Little consideration is given to the effect of increased river loads on<br />
aquatic biogeochemistry, except to say that, as more nitrogen <strong>and</strong> phosphorus are leached<br />
from previously frozen mineral soils, primary productivity may be bolstered.<br />
15
38. Frohn, R.C., Hinkel, K.M., <strong>and</strong> Eisner, W.R., 2005, Satellite remote sensing<br />
classification of thaw lakes <strong>and</strong> drained thaw-lake basins on the North Slope of Alaska:<br />
Remote Sensing of Environment, v. 97, no. 1, p. 116–126.<br />
This paper demonstrates a technique for mapping thermokarst lakes <strong>and</strong> drained lake basins<br />
on the North Slope of Alaska using L<strong>and</strong>sat satellite imagery <strong>and</strong> an object-oriented<br />
classification algorithm. Classification accuracy for identifying lakes <strong>and</strong> basins was greater<br />
than 93 percent. The end result was a map showing that the western <strong>Arctic</strong> Coastal Plain was<br />
covered with 20 percent lakes <strong>and</strong> 25 percent drained basins.<br />
39. Gooseff, M.N., Balser, A., Bowden, W.B., <strong>and</strong> Jones, J.B., 2009, Effects of hillslope<br />
thermokarst in northern Alaska: Eos, Transactions American Geophysical Union,<br />
v. 90, no. 4, p. 29–36.<br />
This paper describes the possible physical, chemical, <strong>and</strong> biological changes as a result of<br />
hillslope thermokarst in areas of continuous <strong>and</strong> discontinuous permafrost. Possible changes<br />
include increased sediment <strong>and</strong> nutrient loading into streams <strong>and</strong> rivers <strong>and</strong> changes in<br />
vegetation composition near affected areas. Hillslope thermokarst, or thawing of permafrost<br />
on hillslopes, results in the failure <strong>and</strong> mass wasting (downslope movement) of overlying<br />
soil <strong>and</strong> vegetation. Recent hillslope features observed include active layer detachments,<br />
thermokarst gullies, <strong>and</strong> retrogressive thaw slumps. Hillslope thermokarst events are<br />
increasing, <strong>and</strong> remote sensing <strong>and</strong> aerial photographs suggest that, in some areas of the<br />
<strong>Arctic</strong> Coastal Plain, a greater than 200-percent increase in hillslope permafrost failures has<br />
occurred since the 1980s.<br />
40. Grenier, C., Régnier, D., Mouche, E., Benabderrahmane, H., Costard, F., <strong>and</strong> Davy, P.,<br />
2013, Impact of permafrost development on groundwater flow patterns—A numerical<br />
study considering freezing cycles on a two-dimensional vertical cut through a generic<br />
river-plain system: Hydrogeology Journal, v. 21, no. 1, p. 257–270.<br />
This paper used a coupled water <strong>and</strong> heat flux model to consider the importance of advective<br />
flux to talik closure associated with a future glacial maximum. The study concerns a deep,<br />
alluvial basin in Europe, <strong>and</strong> shows that advective transport of heat through the subsurface<br />
prevents talik closure. This may be applicable to several settings on the <strong>Arctic</strong> Coastal Plain,<br />
including near-stream environments, deep connections between thaw lakes, <strong>and</strong>, sometime<br />
in the future, the duration of subsurface connections through an open talik network.<br />
41. Grosse, G., Harden, J., Turetsky, M., McGuire, A.D., Camill, P., Tarnocai, C.,<br />
Frolking, S., Schuur, E.A.G., Jorgenson, M.T., Marchenko, S., Romanovsky, V.E.,<br />
Wickl<strong>and</strong>, K.P., French, N., Waldrop, M., Bourgeau-Chavez, L., <strong>and</strong> Striegl, R.G.,<br />
2011, Vulnerability of high-latitude soil organic carbon in North America to<br />
disturbance: Journal of Geophysical Research, v. 116, no. G4, G00K06.<br />
Although the authors focus on the vulnerability of soil organic carbon, important<br />
thermokarst <strong>and</strong> thermo-erosion processes are summarized <strong>and</strong> their effects on soils <strong>and</strong><br />
ecosystem characteristics are described. The authors quantify areas of 73,000 km 2 <strong>and</strong><br />
814,000 km 2 with Cryosols underlain by ice-rich permafrost in Alaska <strong>and</strong> Canada,<br />
respectively. Pulse disturbances affecting soils as rapid processes such as thermokarst,<br />
thermo-erosion, <strong>and</strong> wildfires are defined <strong>and</strong> differentiated from press disturbances<br />
representing more gradual changes such as slow active layer deepening or changes in soil<br />
wetness. Approaches for predicting soil <strong>and</strong> soil carbon changes owing to such disturbances<br />
are shown <strong>and</strong> research <strong>and</strong> data gaps also are highlighted.<br />
16
42. Grosse, G., Jones, B.M., <strong>and</strong> Arp, C.D., 2013, <strong>Thermokarst</strong> lakes, drainage, <strong>and</strong><br />
drained basins, in Shroder, J.F., <strong>and</strong> others, eds., Treatise on geomorphology, v. 8: San<br />
Diego, Academic Press, p. 325–353.<br />
The authors summarize the literature on thermokarst lake dynamics, particularly how they<br />
form, their panarctic distribution, <strong>and</strong> their morphometric, physical, <strong>and</strong> hydrological<br />
characteristics <strong>and</strong> dynamics. Additionally, thermokarst lake drainage is highlighted as an<br />
important process in the thermokarst lake cycle of many lake-rich permafrost l<strong>and</strong>scapes.<br />
Processes that may result in drainage <strong>and</strong> that occur after drainage in basins are defined. A<br />
new map of potential thermokarst lake distribution in the <strong>Arctic</strong> <strong>and</strong> a map of lake<br />
orientation are presented.<br />
43. Grosse G., Romanovsky V.E., Nelson F.E., Brown, J., <strong>and</strong> Lewkowicz, A.G., 2010, Why<br />
permafrost is thawing, not melting: Eos, Transactions American Geophysical Union,<br />
v. 91, no. 9, p. 87.<br />
The authors highlight the importance of terminology when describing the process of<br />
permafrost thaw. In the literature, the incorrect phrase–“melting permafrost” –often is used.<br />
The correct terminology is “thawing permafrost”. “Melting” describes a phase transition<br />
from solid to liquid, which is the case for melting ground ice. However, because permafrost<br />
usually is composed of a mixture of ground ice, sediments, organic matter, <strong>and</strong> other<br />
materials, it does not melt entirely (become a liquid). The correct term– “thaw” –describes<br />
the transition from below 0°C to above 0°C.<br />
44. Grosse, G., Romanovsky, V., Walter, K., Morgenstern, A., Lantuit, H., <strong>and</strong> Zimov, S.,<br />
2008, Distribution of thermokarst lakes <strong>and</strong> ponds at three yedoma sites in Siberia, in<br />
Proceedings of the Ninth International Conference on <strong>Permafrost</strong>, June 2008,<br />
Fairbanks, AK, p. 551–556.<br />
The authors of this paper present a GIS-based analysis of lake extraction from three<br />
thermokarst lake sites in North Siberia using high-resolution SPOT <strong>and</strong> Ikonos satellite<br />
imagery. The authors found a dramatic difference between their high-resolution lake-derived<br />
data layer <strong>and</strong> global <strong>and</strong> regional estimates of lake surface area in their study regions. At all<br />
three study sites, small <strong>and</strong> medium sized lakes were abundant but missing in global lake<br />
databases. Between 21 <strong>and</strong> 82 percent of the total lake area in three of the study regions was<br />
missing. The authors suggest that these findings have implications for upscaling<br />
biogeochemical processes associated with small water bodies, that is, thermokarst ponds <strong>and</strong><br />
lakes in lake-rich permafrost regions.<br />
45. Grosse, G., Schirrmeister, L., Kunitsky, V.V., <strong>and</strong> Hubberten, H.W., 2005, The use of<br />
CORONA images in remote sensing of periglacial geomorphology—An illustration<br />
from the NE Siberian coast: <strong>Permafrost</strong> <strong>and</strong> Periglacial Processes, v. 16, no. 2,<br />
p. 163–172.<br />
This paper describes the use of high-resolution, declassified satellite photography from the<br />
U.S. CORONA program (1963–1980) for mapping periglacial l<strong>and</strong>forms in a 250-km 2 area<br />
in northeastern Siberia. Imagery resolution in this program ranged from 0.6 to 150 m;<br />
however, this paper focused on images with a resolution of about 2. The authors were able<br />
to map lakes, depressions, lagoons, gullies, slumps, <strong>and</strong> pingos using a combination of<br />
automated <strong>and</strong> manual mapping techniques. The use of the CORONA imagery for the<br />
Bykovsky Peninsula in northeastern Siberia showed that more than 50 percent of the area<br />
had been affected by thermokarst processes during the Holocene.<br />
17
46. Grosse, G., Schirrmeister, L., <strong>and</strong> Malthus, T.J., 2006, Application of L<strong>and</strong>sat‐7<br />
satellite data <strong>and</strong> a DEM for the quantification of thermokarst‐affected terrain types in<br />
the periglacial Lena–Anabar coastal lowl<strong>and</strong>: Polar Research, v. 25, no. 1, p. 51–67.<br />
This paper describes the use of L<strong>and</strong>sat-7 satellite data <strong>and</strong> a digital elevation model for the<br />
quantification <strong>and</strong> description of an approximately 3,500-km 2 thermokarst-affected region<br />
in northern Siberia. A supervised classification approach was used to determine various<br />
thermokarst l<strong>and</strong>forms that relied primarily on relief forms <strong>and</strong> the spectral response of<br />
various tundra vegetation types. The final terrain type classification was composed of eight<br />
major classes (seven l<strong>and</strong> classes <strong>and</strong> one water class). These were divided into 37<br />
subclasses, <strong>and</strong> the class composition for some of these subclasses was categorized based on<br />
thermokarst depressions, pingos, river valleys, thermo-erosional valleys, <strong>and</strong> yedoma<br />
upl<strong>and</strong>s. Thirteen surface classes ultimately were determined to provide good overall<br />
classification accuracy (79 percent), <strong>and</strong> that 78 percent of the study area was affected<br />
somewhat by thermokarst, thermo-erosion, <strong>and</strong> related slope processes.<br />
47. Harris, C., <strong>and</strong> Lewkowicz, A.G., 2000, An analysis of the stability of thawing slopes,<br />
Ellesmere Isl<strong>and</strong>, Nunavut, Canada: Canadian Geotechnical Journal, v. 37, no. 2,<br />
p. 449–462.<br />
This paper examined the potential for failure of two slopes showing evidence of previous<br />
active layer detachment slides. Theoretically, detachment failures depend on soil <strong>and</strong> pore<br />
pressures. By measuring soil pore pressure <strong>and</strong> active layer depths, the authors were able to<br />
calculate the safety factor for the given slopes, <strong>and</strong> to estimate the pore pressures needed to<br />
facilitate a detachment slide. Although the tested slopes were in relatively safe states,<br />
changes necessary to induce slides were calculated. Depth of saturation <strong>and</strong> buried s<strong>and</strong><br />
layers were recognized as two potentially important factors. Shear strength was identified as<br />
the most sensitive parameter controlling slope stability; shear strength may decrease<br />
annually when active layers are deep, eventually weakening the soils <strong>and</strong> allowing slides to<br />
occur.<br />
48. Harris, S.A., 2002, Causes <strong>and</strong> consequences of rapid thermokarst development in<br />
permafrost or glacial terrain: <strong>Permafrost</strong> <strong>and</strong> Periglacial Processes, v. 13, no. 3,<br />
p. 237–242.<br />
This paper compares air, soil, <strong>and</strong> water temperature at one location to show that heat is<br />
adsorbed differently by soils <strong>and</strong> water. A lag time between water temperature <strong>and</strong> ground<br />
temperature was observed, <strong>and</strong> a large disconnect during cooling was noted when winter<br />
temperatures reached -3°C <strong>and</strong> -19°C in the lake <strong>and</strong> the ground, respectively. The<br />
subsurface inflows could have affected the comparison. Discussion focuses on the major<br />
differences between soil <strong>and</strong> water, including heat capacity, thermal diffusivity, <strong>and</strong> thermal<br />
conductivity. Translucency <strong>and</strong> convection are two important factors that are unique to<br />
water <strong>and</strong> heat storage <strong>and</strong> exchange. The discussion notes how the differences in thermal<br />
properties of water <strong>and</strong> soils may lead to thermokarst development <strong>and</strong> shows photographs<br />
representing the formation of an alas valley.<br />
18
49. Helbig, M., Boike, J., Langer, M., Schreiber, P., Runkle, B.R., <strong>and</strong> Kutzbach, L., 2013,<br />
Spatial <strong>and</strong> seasonal variability of polygonal tundra water balance—Lena River Delta,<br />
northern Siberia (Russia): Hydrogeology Journal, v. 21, no. 1, p. 133–147.<br />
This paper quantifies the water balance for a polygonal l<strong>and</strong>scape. Besides the obvious <strong>and</strong><br />
large vertical fluxes (precipitation <strong>and</strong> evapotranspiration), lateral fluxes are important,<br />
especially if polygonal rims <strong>and</strong> trough margins have degraded because of permafrost thaw.<br />
Early-summer snowmelt is an important source of water, <strong>and</strong> later in the summer, high<br />
hydraulic conductivity allows increased subsurface flow. The importance of soil<br />
stratification, with higher flow potential in the shallow organic layers, is also recognized.<br />
50. Hinkel, K.M., Eisner, W.R., Bockheim, J.G., Nelson, F.E., Peterson, K.M., <strong>and</strong> Dai, X.,<br />
2003, Spatial extent, age, <strong>and</strong> carbon stocks in drained thaw lake basins on the Barrow<br />
Peninsula, Alaska: <strong>Arctic</strong>, Antarctic, <strong>and</strong> Alpine Research, v. 35, no. 3, p. 291–300.<br />
This paper estimates the age of 77 drained thaw-lake basins on the Barrow Peninsula based<br />
on a predictable succession of plant communities, l<strong>and</strong>scape wetness <strong>and</strong> texture, <strong>and</strong> soil<br />
organic matter thickness. Field-based classifications were used to categorize four basin<br />
types: young, medium, old, <strong>and</strong> ancient. These determinations were supported by<br />
radiocarbon dating of material from the base of the organic layer. L<strong>and</strong>sat-7 imagery also<br />
was used to investigate the potential for classifying lakes based solely on imagery. Core<br />
samples indicated that organic layer thickness <strong>and</strong> degree of decomposition increases with<br />
basin age, but there was significant scatter related to cryoturbation, decomposition, <strong>and</strong><br />
processes leading to ice enrichment in the shallow permafrost.<br />
51. Hinkel, K.M., Frohn, R.C., Nelson, F.E., Eisner, W.R., <strong>and</strong> Beck, R.A., 2005,<br />
Morphometric <strong>and</strong> spatial analysis of thaw lakes <strong>and</strong> drained thaw lake basins in the<br />
western <strong>Arctic</strong> Coastal Plain, Alaska: <strong>Permafrost</strong> <strong>and</strong> Periglacial Processes, v. 16,<br />
no. 4, p. 327–341.<br />
Remote sensing data was examined across the western <strong>Arctic</strong> Coastal Plain, Alaska, to<br />
analyze the characteristics of permafrost thaw lakes <strong>and</strong> drained basins in three subregions<br />
that were demarcated by ancient shorelines. Subregions varied by surface age, with older<br />
subregions farther than younger subregions from the ca. 2000 coastline. All subregions had<br />
similar lake <strong>and</strong> basin orientation, suggesting summer wind direction has remained<br />
relatively constant for several thous<strong>and</strong> years. Lake coverage (percentage of area) also was<br />
similar among subregions, while drained lake basin area decreased in older surfaces. An<br />
apparent tradeoff existed between lake <strong>and</strong> basin size, <strong>and</strong> density <strong>and</strong> age of the features:<br />
older surfaces contained more, but smaller, lakes <strong>and</strong> basins than younger surfaces. Many<br />
factors may influence lake morphometry, including ground-ice content, surficial sediments,<br />
local relief, distance from the coast, <strong>and</strong> surface age.<br />
19
52. Hinkel, K.M., <strong>and</strong> Hurd, J.K., 2006, <strong>Permafrost</strong> destabilization <strong>and</strong> thermokarst<br />
following snow fence installation, Barrow, Alaska, USA: <strong>Arctic</strong>, Antarctic, <strong>and</strong> Alpine<br />
Research, v. 38, no. 4, p. 530–539.<br />
This paper describes the effect of a snow fence on permafrost temperature <strong>and</strong> l<strong>and</strong><br />
subsidence in Barrow, Alaska, from 1999 to 2005. Data loggers were installed at depths of<br />
5, 30, <strong>and</strong> 50 cm in the ground on the downwind side of the snow fence <strong>and</strong> in tundra sites<br />
not affected by the snow drifts that formed as a result of the snow fence. Active layer<br />
thickness <strong>and</strong> snow depth were measured annually in August <strong>and</strong> April, respectively. As a<br />
result of the snow fence, the ground temperature in the downwind strip has warmed by 2–<br />
14°C in the winter, <strong>and</strong> has cooled by 2–3°C in the summer because of the time it takes to<br />
melt the drifted snow (3–4 m in thickness). The net effect has been a warming of the ground<br />
surface, a thawing of the permafrost, subsidence of about 10–20 cm, <strong>and</strong> development of<br />
thermokarst ponds. This study highlights the importance of snow accumulation <strong>and</strong><br />
thickness on the ground thermal regime <strong>and</strong> potential to form thermokarst in areas where air<br />
temperatures are thought to be too cold for the formation of thermokarst.<br />
53. Hinkel, K.M., Jones, B.M., Eisner, W.R., Cuomo, C.J., Beck, R.A., <strong>and</strong> Frohn, R.,<br />
2007, Methods to assess natural <strong>and</strong> anthropogenic thaw lake drainage on the western<br />
<strong>Arctic</strong> coastal plain of northern Alaska: Journal of Geophysical Research, v. 112,<br />
no. F2, F02S16.<br />
This paper describes three methods for assessing the natural <strong>and</strong> anthropogenic drainage of<br />
thermokarst lakes on the western <strong>Arctic</strong> Coastal Plain of northern Alaska: (1) comparison of<br />
L<strong>and</strong>sat imagery between about 1970 <strong>and</strong> about 2000 for a 35,000-km 2 area, (2) comparison<br />
of historical aerial photography from 1949 to 1955 with recent high-resolution orthorectified<br />
radar derived imagery from 2002 for the Barrow Peninsula, <strong>and</strong> (3) interviews with local<br />
<strong>and</strong> traditional knowledge holders. About 50 lakes larger than 10 ha drained in the 25-year<br />
period were analyzed with an automated classification of the L<strong>and</strong>sat imagery. This analysis<br />
showed that only 0.027 percent of the extant lakes in the region had catastrophic drainage<br />
during this time period. The authors also attempted to classify the lake drainage events by a<br />
mechanism that included lake coalescence (19), coastal erosion (1), stream me<strong>and</strong>ering (8),<br />
headward erosion (13), <strong>and</strong> unresolvable (9). By extending the analysis back to 1950 with<br />
the automated classification of the aerial photography for the Barrow study region the<br />
authors showed that human activity was responsible for about 40 percent of the lake<br />
drainage events on the Barrow Peninsula. The timing <strong>and</strong> mechanism of select lake drainage<br />
events were further refined through the interviews with the traditional <strong>and</strong> local knowledge<br />
holders.<br />
20
54. Hinkel, K.M., Lenters, J.D., Sheng, Y., Lyons, E.A., Beck, R.A., Eisner, W.R., Maurer,<br />
E.F., Wang, J., <strong>and</strong> Potter, B.L., 2012, <strong>Thermokarst</strong> lakes on the <strong>Arctic</strong> Coastal Plain<br />
of Alaska—Spatial <strong>and</strong> temporal variability in summer water temperature:<br />
<strong>Permafrost</strong> <strong>and</strong> Periglacial Processes, v. 23, p. 207–217.<br />
This paper describes the rate of water warming throughout the summer <strong>and</strong> spatial variation<br />
in water temperature across the <strong>Arctic</strong> Coastal Plain, Alaska. During the summer of 2010,<br />
vertical water temperature measurements were collected in 12 thermokarst lakes across this<br />
plain. Water temperature was measured using sensor strings affixed to nylon rope with a<br />
float or weight at the end placed in lakes before or during ice decay. Water warming in the<br />
spring begins at the lakebed during ice decay. Temperatures rapidly increase after ice-off<br />
<strong>and</strong> correspond to local weather conditions. Ice-off occurs 2–4 weeks later on lakes near the<br />
coast, <strong>and</strong> coastal lakes are an average of 6°C cooler than inl<strong>and</strong> lakes. Lakes are well mixed<br />
<strong>and</strong> mostly isothermal; the average mean bottom water temperature for lakes 1.0–3.5-m<br />
deep is 0.1–0.5°C cooler than that of near-surface water. A series of detailed measurements<br />
over a short time period on a single lake showed warmer (2–3°C) temperatures on the<br />
upwind, sheltered end of the lake. These data can be used to calibrate high-resolution<br />
satellite thermal b<strong>and</strong>s <strong>and</strong> to develop classification methods to characterize thermokarst<br />
lakes according to water temperature.<br />
55. Hinkel, K.M., Sheng, Y., Lenters, J.D., Lyons, E.A., Beck, R.A., Eisner, W.R., <strong>and</strong><br />
Wang, J., 2012, <strong>Thermokarst</strong> lakes on the <strong>Arctic</strong> Coastal Plain of Alaska—<br />
Geomorphic controls on bathymetry: <strong>Permafrost</strong> <strong>and</strong> Periglacial Processes, v. 23,<br />
p. 218–230.<br />
This study summarizes the bathymetry of thermokarst lakes across the <strong>Arctic</strong> Coastal Plain,<br />
Alaska, in relation to surficial sediments (that is, soil types) <strong>and</strong> topography. Lake sensors<br />
were used to estimate water depth <strong>and</strong> GPS-enabled sonar was used to collect detailed<br />
bathymetric data during the summer months of 2008–2010. Lake depth varied with nearness<br />
to the coast. Coastal lowl<strong>and</strong> lakes that developed in marine silts tended to be shallow (about<br />
2 m deep) <strong>and</strong> of more uniform depth. Farther inl<strong>and</strong>, lakes formed in ice-poor Aeolian s<strong>and</strong><br />
deposits <strong>and</strong> generally were about 1-m deep, but had deeper central pools (2–5 m deep).<br />
Lakes in the <strong>Arctic</strong> Coastal Plain-<strong>Arctic</strong> Foothills transition zone developed in loess upl<strong>and</strong>s<br />
<strong>and</strong> were extremely ice-rich. Residual lakes inside old lake basins generally were uniformly<br />
2–4 m deep, but at times contained deeper (6–9 m deep) pools where the exp<strong>and</strong>ing lake<br />
encroached on upl<strong>and</strong>s at eroding bluffs. The authors speculate these deeper pools were<br />
formed by ground subsidence from thawing ice-rich permafrost above ice wedges. The data<br />
presented can be used to develop <strong>and</strong> calibrate models with high-resolution passive or active<br />
remote sensing systems to estimate water depth. Coarse spatial resolution of the data<br />
restricts the ability to detect deep pools <strong>and</strong> steep gradients. This need to incorporate<br />
sediment erosion <strong>and</strong> transport in bathymetry models of thermokarst lakes is also<br />
highlighted in the study.<br />
21
56. Hopkins, D.M., 1949, Thaw lakes <strong>and</strong> thaw sinks in the Imuruk Lake area, Seward<br />
Peninsula, Alaska: The Journal of Geology, p. 119–131.<br />
This paper describes thermokarst lakes <strong>and</strong> sinks (depressions left after lakes drain<br />
subterraineously) in the Imuruk Lake area on the Seward Peninsula of Alaska. The region<br />
contains frozen, silty soils with ground ice with natural porosity greater than that of the<br />
potentially unfrozen material. The melting of this ice leads to l<strong>and</strong> subsidence <strong>and</strong> ponding<br />
of water in the depressions that further promote thaw. Early English definitions are given for<br />
(1) thaw depressions–depressions that result from the subsidence following the thawing of<br />
permafrost; (2) thaw (thermokarst) lakes–lakes that occupy thaw depressions, including<br />
lakes that originated in other ways but that have been enlarged considerably by thawing at<br />
their margins; <strong>and</strong> (3) thaw sinks closed depressions with a subterranean drainage but<br />
believed to have originated as thermokarst lakes. <strong>Thermokarst</strong> lakes in the region were<br />
formed by many different processes: (1) disruption of the vegetal cover by frost heaving, (2)<br />
accelerated thaw beneath pools at the intersection of ice wedges, <strong>and</strong> (3) accelerated thaw<br />
beneath pools in small streams. Wave erosion becomes an important enlargement process<br />
when a waterbody is larger than about 30 m in diameter. Although the average expansion<br />
rates of lakes are not provided in the study, some of the faster rates of lake expansion ever<br />
recorded in the <strong>Arctic</strong> (more than 20 m/yr during a 2-yr period) were noted.<br />
57. Johnson, C.J., Boyce, M.S., Mulders, R., Gunn, A., Gau, R.J., Cluff, H.D., <strong>and</strong> Case,<br />
R.L., 2004, Quantifying patch distribution at multiple spatial scales—Applications to<br />
wildlife-habitat models: L<strong>and</strong>scape Ecology, v. 19, no. 8, p. 869–882.<br />
This paper describes an approach for examining habitat relationships for three arctic<br />
mammals in the Canadian central <strong>Arctic</strong>: gray wolf, brown bear, <strong>and</strong> caribou. A technique<br />
was used that quantifies habitat at the patch scale <strong>and</strong> the distribution of multiple patches<br />
(that is, patch density) at a larger regional scale. Most conservative models for wolves <strong>and</strong><br />
grizzly bears included characteristics at both spatial scales, but caribou were best described<br />
using only regional-scale characteristics. Caribou during the post-calving season preferred<br />
many small patches of lichen veneer, heath tundra, <strong>and</strong> rocks in a region. During denning,<br />
wolves preferred heath rock <strong>and</strong> heath tundra as well as patches of sedge, lichen veneer, <strong>and</strong><br />
rock. Resource selection by grizzly bears during early summer was best explained by esker<br />
(sparsely vegetated s<strong>and</strong> <strong>and</strong> gravel ridges) <strong>and</strong> low shrub, <strong>and</strong> a low density of forest <strong>and</strong><br />
sedge patches. Integration of environmental characteristics at multiple scales was<br />
recommended when monitoring mobile animals that range across heterogeneous areas.<br />
58. Jones, B.M., Arp, C.D., Jorgenson, M.T., Hinkel, K.M., Schmutz, J.A., <strong>and</strong> Flint, P.L.,<br />
2009, Increase in the rate <strong>and</strong> uniformity of coastline erosion in <strong>Arctic</strong> Alaska:<br />
Geophysical Research Letters, v. 36, no. 3, L03503.<br />
This study compares aerial photography along a 60-km stretch of the Beaufort Sea coastline<br />
from 1955, 1979, 2002, <strong>and</strong> 2007. The authors determined that erosion rates increased from<br />
6.8 m/yr to 8.7 m/yr to 13.6 m/yr, respectively. The rate of erosion along coastal areas with<br />
varying degrees of ice-richness became more similar over time, possibly indicating that<br />
thermal erosion had increased along this stretch of coast.<br />
22
59. Jones, B.M., Grosse, G., Arp, C.D., Jones, M.C., Anthony, K.W., <strong>and</strong> Romanovsky,<br />
V.E., 2011, Modern thermokarst lake dynamics in the continuous permafrost zone,<br />
northern Seward Peninsula, Alaska: Journal of Geophysical Research, v. 116, no. G2,<br />
G00M03.<br />
This paper describes the expansion <strong>and</strong> drainage of thermokarst lakes for a 700-km 2 area on<br />
the northern Seward Peninsula of Alaska between 1950 <strong>and</strong> 2007. The authors compared the<br />
surface area of lakes selected from aerial photography acquired in about 1950 <strong>and</strong> 1978, <strong>and</strong><br />
a high-resolution satellite image acquired in 2006 <strong>and</strong> 2007. Lakes larger than 0.1 ha were<br />
selected from each image set using an object-oriented classification algorithm <strong>and</strong> were<br />
manually adjusted where necessary. The number of waterbodies increased by 10 percent<br />
during the study period, but the total surface area associated with the waterbodies decreased<br />
by 15 percent. These changes primarily resulted from the partial drainage of several large<br />
lakes <strong>and</strong> the formation of remnant ponds. Lakes larger than 40 ha decreased in number by<br />
24- percent <strong>and</strong> in surface area by 26- percent. One likely factor responsible for lake<br />
drainage was the expansion of lakes towards a drainage gradient. <strong>Thermokarst</strong> lake<br />
expansion rates, based on analysis of about 400 waterbodies, averaged about 0.35 m/yr with<br />
maximum rates of almost 6 m/yr. <strong>Thermokarst</strong> lake expansion rates were higher for lower<br />
bluffs (0.4 m/yr) than for higher bluffs (0.2 m/yr) associated with yedoma terrain. Lake<br />
drainage rates during the study period were 2.2 lakes per year. These findings have<br />
implications at the l<strong>and</strong>scape scale, as nearly three times more l<strong>and</strong> area was gained relative<br />
to l<strong>and</strong> area lost through thermokarst lake dynamics during the study period.<br />
60. Jones, B.M., Grosse, G., Hinkel, K.M., Arp, C.D., Walker, S., Beck, R.A., <strong>and</strong><br />
Galloway, J.P., 2012, Assessment of pingo distribution <strong>and</strong> morphometry using an<br />
IfSAR derived digital surface model, western <strong>Arctic</strong> Coastal Plain, northern Alaska:<br />
Geomorphology, 138, v. 1, p. 1–14.<br />
This paper mapped the distribution <strong>and</strong> morphometry of pingos in a 40,000-km 2 area on the<br />
western <strong>Arctic</strong> Coastal Plain of northern Alaska using a digital surface model from about<br />
2005 derived from airborne Interferometric Synthetic Aperture Radar (IfSAR). The authors<br />
identified 1,247 pingo-like features between 2 <strong>and</strong> 21 m high, 400 more than previously<br />
were mapped in the region. The highest pingo density (0.18/km 2 ) occurred where streams<br />
had reworked aeolian s<strong>and</strong> deposits. Morphometric analyses indicated that most pingos were<br />
small-to-medium in size ( less than200 m in diameter), gently-to-moderately sloping (less<br />
than30°), circular–to-slightly elongate (mean circularity index of 0.88), <strong>and</strong> of relatively low<br />
height (2–5 m). However, 57 pingos were higher than 10 m, 26 had a maximum slope of<br />
greater than 30°, <strong>and</strong> 42 were larger than 200 m in diameter. Comparing the 2005-derived<br />
pingo dataset with the pingo dataset created from mid-1950s stereo-pair aerial photography,<br />
66 pingos may have partially or completely collapsed during the 50-year period. Only two<br />
pingos were positively identified as having formed over the same period. However, caution<br />
should be taken when comparing contemporary <strong>and</strong> legacy datasets derived using different<br />
techniques.<br />
23
61. Jorgenson, M.T., 2011, Coastal region of northern Alaska, Guidebook to permafrost<br />
<strong>and</strong> related features; Alaska Division of Geological <strong>and</strong> Geophysical Surveys,<br />
Guidebook 10, p. 188.<br />
This guidebook <strong>and</strong> overview of northern Alaska was developed during the Ninth<br />
International Conference on <strong>Permafrost</strong>, held in Fairbanks, Alaska, in 2008. It is organized<br />
into five sections. The first section provides an overview of the <strong>Arctic</strong> Coastal Plain with an<br />
emphasis on the role of permafrost in shaping ecological <strong>and</strong> social systems. The second<br />
section provides an overview of oil development in the region, <strong>and</strong> the remaining three<br />
sections provide information on field trips taken to the Prudhoe Bay <strong>and</strong> Kuparuk oilfields,<br />
the Colville River Delta, <strong>and</strong> the Barrow Peninsula.<br />
62. Jorgenson, M.T., 2013, <strong>Thermokarst</strong> terrains in Shroder, J.F, <strong>and</strong> others, eds., Treatise<br />
on geomorphology, v. 8: San Diego, Academic Press, p. 313–324.<br />
This book chapter provides an overview of 23 thermokarst l<strong>and</strong>forms associated with<br />
varying terrain conditions, ground ice volumes <strong>and</strong> morphologies, <strong>and</strong> heat <strong>and</strong> mass<br />
transfer processes that have been identified in <strong>Arctic</strong>, Subarctic, <strong>and</strong> Antarctic regions.<br />
These features include (1) deep thermokarst lake, (2) shallow thermokarst lake, (3) glacial<br />
thermokarst lake, (4) glacial thermokarst, (5) thermokarst basin, (6) thermokarst lake basin,<br />
(7) thaw sink, (8) thermokarst fen, (9) thermokarst bog, (10) thermokarst shore fen, (11)<br />
thaw slump, (12) detachment slide, (13) collapsed pingo, (14) beaded stream, (15) thermal<br />
erosion gully, (16) thermokarst water track, (17) collapse-block shore, (18) ice-block<br />
l<strong>and</strong>slide, (19) thermokarst troughs <strong>and</strong> pits, (20) thermokarst pits, (21) conical thermokarst<br />
mounds, (22) irregular thermokarst mounds, <strong>and</strong> (23) sink holes. The chapter focuses on (1)<br />
describing the nature of various l<strong>and</strong>forms; (2) identifying the dominant processes <strong>and</strong><br />
stages involved in permafrost degradation; <strong>and</strong> (3) discussing the climatic <strong>and</strong> terrain factors<br />
affecting regional <strong>and</strong> local thermokarst. An overview on thermokarst l<strong>and</strong>forms, typical<br />
feature size, mass transfer process, heat source, hydrologic regime, dominant ice type, depth<br />
of subsidence, <strong>and</strong> lateral rate of expansion is given in table 1 of the chapter.<br />
63. Jorgenson, M.T., <strong>and</strong> Osterkamp, T.E., 2005, Response of boreal ecosystems to varying<br />
modes of permafrost degradation: Canadian Journal of Forest Research, v. 35, no. 9,<br />
p. 2100–2111.<br />
This paper provides an overview of 16 primary modes of surface permafrost degradation<br />
based on their microtopography <strong>and</strong> vegetative characteristics for the boreal forest region of<br />
Alaska. The mode of permafrost degradation or type of thermokarst is highly variable, <strong>and</strong><br />
its topographic <strong>and</strong> ecological consequences depend on the interaction of slope position, soil<br />
texture, hydrology, <strong>and</strong> ice content. The 16 modes identified in the paper include: (1)<br />
thermokarst lakes from lateral thermo-mechanical erosion, (2) thermokarst basins after lake<br />
drainage, (3) thaw sinks from subsurface drainage of lakes, (4) glacial thermokarst of icecored<br />
moraines, (5) linear collapse-scar fens associated with shallow groundwater<br />
movement, (6) round isolated collapse-scar bogs from slow lateral degradation, (7) small<br />
round isolated thermokarst pits from surface thawing, (8) polygonal thermokarst mounds<br />
from advanced ice-wedge degradation, (9) mixed thermokarst pits <strong>and</strong> polygons from initial<br />
ice-wedge degradation, (10) irregular thermokarst mounds from thawing of ice-poor silty<br />
soils, (11) sinkholes <strong>and</strong> pipes resulting from groundwater flow, (12) thermokarst gullies<br />
<strong>and</strong> water tracks from surface-water flow, (13) thaw slumps related to slope failure <strong>and</strong><br />
thawing, (14) thermo-erosional niches from water undercutting of ice-rich shores, (15)<br />
collapsed pingos from thawing of massive ice in pingos, <strong>and</strong> (16) non-patterned ground<br />
from thawing of ice-poor soils. Information on each degradation mode related to l<strong>and</strong>scape<br />
position, hydrologic regime, soil texture, excess ice content, dominant ice morphology,<br />
24
typical size, thaw settlement, <strong>and</strong> later degradation rate is given in table 1 of this paper. The<br />
various degradation modes lead to very different ecological responses, ranging from the<br />
creation of new lakes <strong>and</strong> aquatic habitat to conversion of forests to fen <strong>and</strong> bog meadows.<br />
Although the focus of this paper is on boreal ecosystems, many of the modes occur in the<br />
<strong>Arctic</strong> as well.<br />
64. Jorgenson, M.T., Racine, C.H., Walters, J.C., <strong>and</strong> Osterkamp, T.E., 2001, <strong>Permafrost</strong><br />
degradation <strong>and</strong> ecological changes associated with a warming climate in central<br />
Alaska: Climatic change, v. 48, no. 4, p. 551–579.<br />
This paper presents studies from 1994–1998 on the Tanana Flats in central Alaska that<br />
reveal that permafrost degradation is widespread <strong>and</strong> rapid, causing large shifts in<br />
ecosystems from birch forests to fens <strong>and</strong> bogs. Fine-grained soils under the birch forest are<br />
ice-rich <strong>and</strong> thaw settlement is typically 1–2.5 m after the permafrost thaws. The collapsed<br />
areas are rapidly colonized by aquatic herbaceous plants, leading to the development of a<br />
thick, floating organic mat. Based on field sampling of soils, permafrost <strong>and</strong> vegetation, <strong>and</strong><br />
the construction of a GIS database, an estimated 17 percent of the study area (263,964 ha)<br />
was unfrozen with no previous permafrost, 48 percent had stable permafrost, 31 percent was<br />
partially degraded, <strong>and</strong> 4 percent was totally degraded. For that part of the study area that<br />
currently has, or recently had, permafrost (83 percent of the area), about 42 percent was<br />
affected by thermokarst development. Based on aerial photograph analysis, birch forests<br />
decreased by 35 percent <strong>and</strong> fens increased by 29 percent from 1949 to 1995. Overall, the<br />
area with totally degraded permafrost (collapse-scar fens <strong>and</strong> bogs) has increased from 39 to<br />
47 percent in 46 years. Based on rates of change from airphoto analysis <strong>and</strong> radiocarbon<br />
dating, an estimated 83 percent of the degradation occurred before 1949. Evidence indicates<br />
that this permafrost degradation began in the mid-1700s <strong>and</strong> is associated with relatively<br />
warm climatic periods during the mid-to-late 1700s <strong>and</strong> the 1900s. If current conditions<br />
persist, the remaining lowl<strong>and</strong> birch forests will disappear by the end of the next century.<br />
65. Jorgenson, M.T., Romanovsky, V., Harden, J., Shur, Y., O'Donnell, J., Schuur, E.A.,<br />
Kanevskiy, M., <strong>and</strong> Marchenko, S., 2010, Resilience <strong>and</strong> vulnerability of permafrost to<br />
climate change, in The Dynamics of change in Alaska's boreal forests—Resilience <strong>and</strong><br />
vulnerability in response to climate warming: Canadian Journal of Forest Research,<br />
v. 40, no. 7, p. 1219–1236.<br />
This paper examines the relations among environmental factors that influence permafrost<br />
resilience <strong>and</strong> vulnerability to disturbance through the use of field measurements, numerical<br />
modeling, <strong>and</strong> a literature review. The resilience or vulnerability of permafrost to climate<br />
change depends on the complex interaction between topography, water, soil, vegetation, <strong>and</strong><br />
snow. Changes in surface water atop permafrost were shown to have the greatest effect on<br />
permafrost thaw.<br />
25
66. Jorgenson, M.T., <strong>and</strong> Shur, Y., 2007, Evolution of lakes <strong>and</strong> basins in northern Alaska<br />
<strong>and</strong> discussion of the thaw lake cycle: Journal of Geophysical Research, v. 112, no. F2,<br />
F02S17.<br />
This paper provides a revision of the thaw-lake cycle on the <strong>Arctic</strong> Coastal Plain of northern<br />
Alaska based on topographic profiles, soil <strong>and</strong> ground-ice surveys, radiocarbon dating,<br />
photogrammetric analysis, <strong>and</strong> regional comparisons. The primary study area was located on<br />
part of the s<strong>and</strong> sheet deposits west of the Colville River Delta. The authors state that there<br />
is not enough ground ice in this surface geology unit to be able to form a thermokarst lake<br />
<strong>and</strong> that most lakes on the <strong>Arctic</strong> Coastal Plain are of non-thermokarst origin. Formation of<br />
most of the <strong>Arctic</strong> Coastal Plain lakes includes (1) initial flooding of depressions to form<br />
primary lakes, (2) lateral erosion, with sorting <strong>and</strong> redistribution of sediments, (3) lake<br />
drainage as the stream network exp<strong>and</strong>s, (4) differential ice aggradation in silty centers <strong>and</strong><br />
s<strong>and</strong>y margins, (5) formation of secondary thaw lakes in the heaved centers of ice-rich<br />
basins <strong>and</strong> infilling of ponds along the low margins, <strong>and</strong> (6) basin stabilization. These<br />
criteria led to the development of lake classification scheme for the <strong>Arctic</strong> Coastal Plain that<br />
consisted of "true" thaw lakes, depression lakes, riverine lakes, <strong>and</strong> delta lakes. Shoreline<br />
erosion rates were assessed for a small region in what was classified as “depression lakes”<br />
however for secondary lakes that formed in the ice-rich centers of drained lake basins.<br />
Maximum erosion rates were about 0.8 m/yr; however, mean erosion rates typically were<br />
less than 0.1 m/yr. Based on these estimates, the authors asserted that lakes exp<strong>and</strong> too<br />
slowly for multiple cycles of formation <strong>and</strong> drainage to have occurred during the Holocene.<br />
67. Jorgenson, M.T., Shur, Y.L., <strong>and</strong> Osterkamp, T.E., 2008, <strong>Thermokarst</strong> in Alaska, in<br />
Proceedings of the Ninth International Conference on <strong>Permafrost</strong>, June 2008,<br />
Fairbanks, AK, p. 869–76.<br />
This paper provides an overview of thermokarst features in Alaska by classifying <strong>and</strong><br />
characterizing l<strong>and</strong>forms associated with permafrost degradation, estimating the aerial<br />
extent of thermokarst in Alaska, <strong>and</strong> estimating the rate of degradation in various regions.<br />
Twenty thermokarst l<strong>and</strong>forms were identified through a combination of field surveys <strong>and</strong><br />
aerial photograph analysis that varied in relation to climate, geomorphic environments <strong>and</strong><br />
soil texture, hydrologic regime, <strong>and</strong> ice morphology <strong>and</strong> content: (1) deep <strong>and</strong> shallow<br />
thermokarst lakes, (2) drained thaw-lake basins, (3) thaw-lake sinks, (4) thermokarst pits, (5)<br />
thermokarst troughs <strong>and</strong> pits, (6) collapsed pingos, (7) thermokarst shore bogs, (8)<br />
thermokarst bogs <strong>and</strong> fens, (9) thermokarst gullies, (10) thermokarst water tracks, (11)<br />
beaded streams, (12) thaw slumps, (13) detachment slides, (14) sink holes <strong>and</strong> tunnels, (15)<br />
glacial thermokarst, (16) collapse-block shores, (17) block l<strong>and</strong>slides, (18) thermokarst<br />
conical mounds, (19) irregular mounds, <strong>and</strong> (20) non-patterned thawed ground. Information<br />
on each l<strong>and</strong>form related to mass transfer, heat source, hydrologic regime, dominant ice<br />
type, typical size, settlement, <strong>and</strong> lateral expansion rate is given in table 1 of this paper. The<br />
extent of thermokarst features was assessed through analysis of aerial photographs taken<br />
along transects in select regions of the state. Based on this analysis, the authors determined<br />
that, in the discontinuous permafrost zone, 61 percent of the area had permafrost <strong>and</strong> 5<br />
percent of the area constituted thermokarst; whereas, in the continuous permafrost zone,<br />
13.5 percent of the area constituted thermokarst. The authors also assessed the rate of<br />
change of thermokarst formation at four sites along a latitudinal gradient in Alaska <strong>and</strong><br />
determined that area affected increased from 3.5 to 8 percent.<br />
26
68. Jorgenson, M.T., Shur, Y.L., <strong>and</strong> Pullman, E.R., 2006, Abrupt increase in permafrost<br />
degradation in <strong>Arctic</strong> Alaska: Geophysical Research Letters, v. 33, no. 2, L02503.<br />
This paper describes the degradation of ice wedges between 1945 <strong>and</strong> 2001 on part of the<br />
<strong>Arctic</strong> Coastal Plain of northern Alaska west of the Colville River Delta. Ice wedges here<br />
are thought to have been stable for thous<strong>and</strong>s of years. Ice-wedge degradation was evaluated<br />
at three spatial scales: (1) field surveys at two sites (1.2 km 2 ), (2) manual change detection<br />
with aerial photography at the two intensive sites (1.2 km 2 ), <strong>and</strong> (3) automated change<br />
detection using spectral characteristics of a larger area in the same region (29 km 2 ). In the<br />
field, ice-wedge degradation was classified into six stages: (1) undegraded ice wedges with<br />
no evident surface changes; (2) initial degradation with barely evident settlement associated<br />
with thawing of the transient layer <strong>and</strong> greening of tussocks; (3) intermediate degradation<br />
with obvious settlement, shallow st<strong>and</strong>ing water, <strong>and</strong> robust green tussocks; (4) advanced<br />
degradation with deep, water-filled pits <strong>and</strong> dead submerged tussocks; (5) initial<br />
stabilization with robust aquatic sedges in shallow water; <strong>and</strong> (6) advanced stabilization<br />
associated with thick peat accumulation, reestablishment of a permafrost layer above the ice<br />
wedges, reduction of surface water, <strong>and</strong> establishment of mosses. In the photography, icewedge<br />
degradation <strong>and</strong> stabilization at the two intensive study sites was identified as the<br />
region in the study area covered by a water-filled pit. <strong>Thermokarst</strong> pits increased slowly<br />
from 0.5 percent in 1945 to 0.6 percent in 1982, <strong>and</strong> then increased abruptly to 4.4 percent<br />
by 2001. Similarly, pit density (that is, the density of pits with areas greater than12 m 2 )<br />
increased slowly from 88/km 2 in 1945 to 128/km 2 in 1982, then rapidly to 1,336/km 2 by<br />
2001. In contrast, the percent area of stabilizing pits showed only gradual changes over the<br />
three dates (1.6 percent, 2.2 percent, <strong>and</strong> 3.0 percent, respectively), as earlier degrading pits<br />
became stabilized. The automated classification of the larger area revealed similar patterns.<br />
By combining the field studies with the aerial photography, the authors showed that initial<br />
<strong>and</strong> advanced degradation can happen within 20 years <strong>and</strong> that advanced stabilization occurs<br />
within an additional 20–30 years. The authors attributed the abrupt increase in ice-wedge<br />
degradation after 1982 to warm summer temperatures between 1989 <strong>and</strong> 1998; however<br />
they did not consider potential increases to winter temperatures nor to increased snowfall.<br />
The degradation of ice wedges at the study site has caused a substantial redistribution of<br />
surface water from the adjacent tundra. These processes may affect 10–30 percent of the<br />
arctic lowl<strong>and</strong> terrestrial l<strong>and</strong>scapes.<br />
27
69. Jorgenson, M.T., Yoshikawa, K., Kanevskiy, M., Shur, Y., Romanovsky, V.,<br />
Marchenko, S., Grosse, G., Brown, J., <strong>and</strong> Jones, B., 2008, <strong>Permafrost</strong> characteristics<br />
of Alaska, in Proceedings of the Ninth International Conference on <strong>Permafrost</strong>, June<br />
2008, Fairbanks, AK, map.<br />
This map is an update to the permafrost distribution map for Alaska using a terrain-unit<br />
approach based on climate <strong>and</strong> surficial geology. It is the third iteration of the statewide<br />
map. The permafrost map is coded with information on surficial geology, mean annual air<br />
temperature, primary soil texture, permafrost extent, ground ice volume, <strong>and</strong> primary<br />
thermokarst l<strong>and</strong>forms. The main map on p. 1 shows the distribution of continuous,<br />
discontinuous, sporadic, <strong>and</strong> isolated permafrost in Alaska along with locations in which the<br />
permafrost thickness is known. On p. 2, there are six accompanying maps that show PRISMbased<br />
mean annual air temperature, surface geology, ground temperatures, ground ice,<br />
pingos, ice wedges, <strong>and</strong> thermokarst l<strong>and</strong>forms. The thermokarst l<strong>and</strong>form map shows 13<br />
types of resolvable features at the mapping scale: (1) deep thermokarst lakes, (2) shallow<br />
thermokarst lakes, (3) basins, (4) troughs, (5) pits, (6) sinks, (7) bogs, (8) fens, (9) thaw<br />
slumps, (10) gullies, (11) water tracks, (12) polygonal troughs, <strong>and</strong> (13) glacial thermokarst.<br />
The authors state that, although this map is an improvement of the prior two mapping<br />
efforts, a better surficial geology map is needed with updated information <strong>and</strong> better spatial<br />
accuracy, more information on terrain-ground ice-temperature-permafrost relationships,<br />
more temperature boreholes, <strong>and</strong> improved spatial models.<br />
70. Kanevskiy, M., Shur, Y., Fortier, D., Jorgenson, M.T., <strong>and</strong> Stephani, E., 2011,<br />
Cryostratigraphy of late Pleistocene syngenetic permafrost (yedoma) in northern<br />
Alaska, Itkillik River exposure: Quaternary Research, v. 75, no. 3, p. 584–596.<br />
This paper provides an overview on the nature <strong>and</strong> distribution of yedoma in the <strong>Arctic</strong>,<br />
describes the characteristics of a yedoma exposure in northern Alaska, <strong>and</strong> provides an<br />
overview map of the potential distribution of yedoma in Alaska. Yedoma permafrost<br />
deposits typically refer to late-Pleistocene syngenetic permafrost, which typically has very<br />
high ground-ice content. The exposure that was studied in northern Alaska represents 40,000<br />
years of undisturbed yedoma formation. The lack of yedoma in certain regions of northern<br />
Alaska forms the basis of the hypothesis that parts of the <strong>Arctic</strong> Coastal Plain were glaciated<br />
during the Pleistocene.<br />
71. Kanevskiy, M., Shur, Y., Jorgenson, M.T., Ping, C.L., Michaelson, G.J., Fortier, D.,<br />
Stephani, E., Dillon, M., <strong>and</strong> Tumskoy, V., 2013, Ground ice in the upper permafrost<br />
of the Beaufort Sea coast of Alaska: Cold Regions Science <strong>and</strong> Technology, v. 85,<br />
p. 56–70.<br />
This paper quantifies ice structures in the five dominant terrain units on the <strong>Arctic</strong> Coastal<br />
Plain: (1) primary surface (silty deposits in the west to gravelly s<strong>and</strong> in the east), (2) low<br />
yedoma foothills, (3) drained lake basins, (4) deltas <strong>and</strong> tidal flats, <strong>and</strong> (5) eolian s<strong>and</strong><br />
dunes. Wedge-ice volumes <strong>and</strong> total volumetric ice were calculated. Wedge ice was the<br />
dominant form of massive ice, ranging from 3 to 50 percent, <strong>and</strong> occurring in nearly all<br />
terrains. Other types of massive ice included thermokarst cave ice, ice core pingos, <strong>and</strong><br />
folded massive ice. Most of the soils were classified as frost-susceptible silts, resulting in<br />
extremely ice-rich permafrost dominated by ataxitic cryostructure. Ice content was notably<br />
lower in young drained lake basins, deltas, <strong>and</strong> tidal flats. The authors discussed formation<br />
<strong>and</strong> calculation of the size of the transition layer, which is the ice-rich upper part of the<br />
permafrost, the formation of which greatly elevates the l<strong>and</strong>scape.<br />
28
72. Karlsson, J.M., Bring, A., Peterson, G.D., Gordon, L.J., <strong>and</strong> Destouni, G., 2011,<br />
Opportunities <strong>and</strong> limitations to detect climate-related regime shifts in inl<strong>and</strong> <strong>Arctic</strong><br />
ecosystems through eco-hydrological monitoring: Environmental Research Letters,<br />
v. 6, no. 1, p. 014015.<br />
This study identifies <strong>and</strong> maps three climate-driven, hydrologically-mediated regime shifts<br />
in inl<strong>and</strong> <strong>Arctic</strong> ecosystems (1) tundra to shrubl<strong>and</strong> or forest, (2) terrestrial ecosystem to<br />
thermokarst lakes <strong>and</strong> wetl<strong>and</strong>s, <strong>and</strong> (3) thermokarst lakes <strong>and</strong> wetl<strong>and</strong>s to terrestrial<br />
ecosystems. Areal coverage of these shifts was compared with monitoring data based on a<br />
literature review of nearly 200 publications, recognizing the large degree of overlap in the<br />
Yukon, Mackenzie, Barents-Norwegian Sea, <strong>and</strong> Ob Rivers Basins between aerially<br />
observed changes <strong>and</strong> monitoring. Tundra-to-shrubl<strong>and</strong> <strong>and</strong> terrestrial-to-aquatic regimes<br />
were observed to occur in unmonitored areas, <strong>and</strong> carbon fluxes were observed to be<br />
undermonitored compared to nitrogen <strong>and</strong> phosphorus in areas that are drying. Most regime<br />
shifts were occurring in Alaska (67 percent), <strong>and</strong> a spatial mismatch existed between the<br />
locations of hydrological <strong>and</strong> ecological monitoring.<br />
73. Kessler, M. A., Plug, L.J., <strong>and</strong> Anthony, K.W., 2012, Simulating the decadal-to<br />
millennial-scale dynamics of morphology <strong>and</strong> sequestered carbon mobilization of two<br />
thermokarst lakes in NW Alaska: Journal of Geophysical Research, v. 117, G00M06.<br />
This paper uses a three-dimensional numerical model to combine elements of lake evolution,<br />
thermokarst thaw, <strong>and</strong> carbon mobilization to predict methane efflux from two arctic lake<br />
basins situated in yedoma permafrost. Lake growth <strong>and</strong> methane production were highly<br />
dependent on topography, indicating the need for high-resolution topographic maps to make<br />
accurate predictions. Observed <strong>and</strong> modeled methane emissions differed by about a factor of<br />
2, with the largest uncertainties in soil carbon content <strong>and</strong> actual methane emission rates.<br />
Both lakes exp<strong>and</strong>ed, merged, <strong>and</strong> drained several times during the simulation, highlighting<br />
that methane emissions depend on the expansion of thermokarst thaw lakes into virgin<br />
yedoma, not just expansion or refilling<br />
74. Koch, J.C., Ewing, S.A., Striegl, R., <strong>and</strong> McKnight, D.M., 2013, Rapid runoff via<br />
shallow throughflow <strong>and</strong> deeper preferential flow in a boreal catchment underlain by<br />
frozen silt (Alaska, USA): Hydrogeology Journal, v. 21, no. 1, p. 93–106.<br />
This paper investigates seasonal changes in runoff lags, ratios, <strong>and</strong> pathways from a northfacing,<br />
continuous permafrost silty hillslope in interior Alaska. This combination of soil<br />
moisture data <strong>and</strong> infiltration modeling indicates the presence of rapid preferential flowpaths<br />
that drain the hillslope quickly, even in late summer when soil active layers are greatest.<br />
Uranium isotopes indicate that these flows are contacting virgin permafrost, which may<br />
occur as streams incise into their beds, <strong>and</strong> (or) are associated with slumps. This effect may<br />
be maximized at this study site because of a recent fire that increased the active layer.<br />
75. Kokelj, S.V., Jenkins, R.E., Milburn, D., Burn, C.R., <strong>and</strong> Snow, N. 2005, The influence<br />
of thermokarst disturbance on the water quality of small upl<strong>and</strong> lakes, Mackenzie<br />
Delta region, Northwest Territories, Canada: <strong>Permafrost</strong> <strong>and</strong> Periglacial Processes,<br />
v. 16, no. 4, p. 343–353.<br />
This paper compares lake chemistry between small lakes (area of less than 20 ha; 22 lakes),<br />
where half of the lakes are pristine <strong>and</strong> the other half have been affected by thermokarst.<br />
Higher concentrations of major ions <strong>and</strong> lower concentrations of dissolved organic carbon<br />
were noted in the thermokarst lakes. Significant correlations were found between the<br />
percentage of the basin affected by thermokarst <strong>and</strong> lake chemistry. Altered chemistry was<br />
29
observed in lakes, with as little as 2 percent of the basin affected by thermokarst. These<br />
effects persisted for decades after slump development had ceased.<br />
76. Kokelj, S.V., Lantz, T.C., Kanigan, J., Smith, S.L., <strong>and</strong> Coutts, R., 2009, Origin <strong>and</strong><br />
polycyclic behaviour of tundra thaw slumps, Mackenzie Delta region, Northwest<br />
Territories, Canada: <strong>Permafrost</strong> <strong>and</strong> Periglacial Processes, v. 20, no. 2, p. 173–184.<br />
This study addresses the effect of retrogressive thaw slumps on tundra l<strong>and</strong>scapes <strong>and</strong> talik<br />
formation. The difference in temperatures on virgin tundra <strong>and</strong> on retrogressive thaw slump<br />
scars was measured, <strong>and</strong> this information was used to inform a two-dimensional numerical<br />
model of heat flow <strong>and</strong> talik formation in lakes. Simulations were compared to digital aerial<br />
photography that had been analyzed to identify slump age <strong>and</strong> evidence of polycyclic<br />
behavior (overlapping slumps of multiple ages). Slumps were determined to greatly increase<br />
heat flow into the ground (owing to removal of the surface organic cover) <strong>and</strong> also to<br />
promote winter snow accumulation, which inhibits ground heat loss. Together, these<br />
processes act to warm <strong>and</strong> potentially to thaw permafrost. Feedbacks between slumping,<br />
talik enlargement, <strong>and</strong> thaw subsidence may drive polycyclic retrogressive thaw slumping.<br />
77. Kokelj, S.V., Zajdlik, B., <strong>and</strong> Thompson, M.S., 2009, The impacts of thawing<br />
permafrost on the chemistry of lakes across the subarctic boreal‐tundra transition,<br />
Mackenzie Delta region, Canada: <strong>Permafrost</strong> <strong>and</strong> Periglacial Processes, v. 20, no. 2,<br />
p. 185–199.<br />
This paper compares lake water chemistry for 39 lakes that have not been affected by<br />
thermokarst with 24 lakes that have been affected by thermokarst. Higher concentrations of<br />
major ions <strong>and</strong> clearer water (but no change in dissolved organic carbon) were noted in the<br />
thermokarst lakes. Significant correlations were made between the percentage of the basin<br />
affected by thermokarst <strong>and</strong> lake ionic load. In unaltered lakes, water ionic strength was<br />
most affected by fire-induced active-layer deepening. The type of surface deposits was<br />
determined to have the greatest control on lake dissolved organic carbon (DOC), with the<br />
highest DOC concentrations <strong>and</strong> color in undisturbed lakes with lacustrine catchments.<br />
Environmental factors, including surficial geology <strong>and</strong> nearness to tree line or coast, were<br />
subordinate to the main driver of water-quality variation, which was permafrost degradation.<br />
78. Kozlenko, N., <strong>and</strong> Jeffries, M.O., 2000, Bathymetric mapping of shallow water in thaw<br />
lakes on the North Slope of Alaska with spaceborne imaging radar: <strong>Arctic</strong>, v. 53, no. 3,<br />
p. 306–316.<br />
This paper demonstrates methodology that can be used to create bathymetric maps of<br />
shallow lakes on the North Slope of Alaska using spaceborne synthetic aperture radar (SAR)<br />
imaging. This technique only works for lakes or depths within lakes that are shallower than<br />
the maximum growth of winter ice in a given year. A time series of SAR imagery was<br />
analyzed to define lake-bottom contours that transitioned from floating-ice to grounded-ice<br />
conditions during the winter, <strong>and</strong> was compared to an ice-growth model. The techniques<br />
only resulted in modest agreement between the bathymetry maps created with the SAR<br />
technique <strong>and</strong> the st<strong>and</strong>ard bathymetric maps acquired by sonar during the summer.<br />
79. Lacelle, D., Bjornson, J., <strong>and</strong> Lauriol, B., 2009, Climatic <strong>and</strong> geomorphic factors<br />
affecting contemporary (1950–2004) activity of retrogressive thaw slumps on the<br />
Aklavik Plateau, Richardson Mountains, NWT, Canada: <strong>Permafrost</strong> <strong>and</strong> Periglacial<br />
Processes, v. 21, no. 1, p. 1–15.<br />
This paper uses aerial photography to identify retrogressive thaw slumps on the Aklavik<br />
Plateau, in the Northwest Territories. The steps in the initiation <strong>and</strong> the morphology of the<br />
features are discussed, <strong>and</strong> the initiation <strong>and</strong> presence are compared to climate factors. Thaw<br />
30
slumps in this area consist of a near-vertical headwall, a low-gradient (2–10-degree) floor,<br />
<strong>and</strong> a steeply-sloping (15–25-degree) evacuation channel that connects the slump to the<br />
river. These features are believed to have begun forming during the Holocene, <strong>and</strong> deeply<br />
buried woody material in recent slumps suggests the presence of previous slumping in the<br />
same locations, indicating a polycyclic process. The rate of thaw slump initiation doubled<br />
between the periods of 1954–1971 <strong>and</strong> 1985–2004, coinciding with increases in 10-year<br />
running mean summer air temperatures. Active mature thaw slumps decreased over the<br />
period or record, potentially related to decreasing precipitation trends.<br />
80. Lantuit, H., Overduin, P.P., Couture, N., Wetterich, S., Aré, F., Atkinson, D., Vasiliev,<br />
A., 2012, The <strong>Arctic</strong> Coastal Dynamics database—new classification scheme <strong>and</strong><br />
statistics on <strong>Arctic</strong> permafrost coastlines: Estuaries <strong>and</strong> Coasts, v. 35, no. 2, p. 383–400.<br />
This paper presents a geomorphological classification scheme for <strong>Arctic</strong> permafrost<br />
coastlines, with information on offshore, frontshore, backshore, <strong>and</strong> onshore units.<br />
Associated with each cross-shore unit <strong>and</strong> coastal segment are attributes that describe the<br />
geomorphology, cryolithology, geochemistry, <strong>and</strong> erosion rate. The average erosion rate for<br />
the entire arctic coast was 0.5 m/yr, but locally, erosion may be greater than long-term<br />
averages of 8 m/yr. The relation between ground-ice content <strong>and</strong> erosion rate are shown in<br />
figure 7a of the paper.<br />
81. Lantuit, H., <strong>and</strong> Pollard, W.H., 2008, Fifty years of coastal erosion <strong>and</strong> retrogressive<br />
thaw slump activity on Herschel Isl<strong>and</strong>, southern Beaufort Sea, Yukon Territory,<br />
Canada: Geomorphology, p. 95, no. 1, 84–102.<br />
This paper presents results from a remotely sensed study on the long-term patterns of coastal<br />
erosion <strong>and</strong> retrogressive thaw slump dynamics for Herschel Isl<strong>and</strong>. Orthorectified air<br />
photographs from 1952 <strong>and</strong> 1970 <strong>and</strong> an Ikonos satellite image from 2000 were used. Mean<br />
coastal retreat rates for the were 0.61 m/yr for the first time period (1952-1970) <strong>and</strong> 0.45<br />
m/yr for the second time period (1970-2000). The number <strong>and</strong> total area of retrogressive<br />
thaw slumps increased by 125 <strong>and</strong> 160 percent, respectively, during the study period (1952-<br />
2000).<br />
82. Lantuit, H., Pollard, W.H., Couture, N., Fritz, M., Schirrmeister, L., Meyer, H., <strong>and</strong><br />
Hubberten, H.W., 2012, Modern <strong>and</strong> late Holocene retrogressive thaw slump activity<br />
on the Yukon Coastal Plain <strong>and</strong> Herschel Isl<strong>and</strong>, Yukon Territory, Canada:<br />
<strong>Permafrost</strong> <strong>and</strong> Periglacial Processes, v. 23, no. 1, p. 39–51.<br />
This paper quantifies environmental, sedimentological, <strong>and</strong> geochemical data from<br />
undisturbed sites <strong>and</strong> those with active <strong>and</strong> stable retrogressive thaw slumps, <strong>and</strong> found<br />
differences in slope, sedimentology, <strong>and</strong> biogeochemistry between undisturbed <strong>and</strong> slumped<br />
areas. Total organic carbon (TOC) <strong>and</strong> soil moisture were lower in slumped material.<br />
Radiocarbon ages indicated high rates of slumping 300 years ago <strong>and</strong> in the modern era,<br />
which is provided as evidence of the polycyclic nature of retrogressive thaw slumping.<br />
83. Lantz, T.C., <strong>and</strong> Kokelj, S.V., 2008, Increasing rates of retrogressive thaw slump<br />
activity in the Mackenzie Delta region, NWT, Canada: Geophysical Research Letters,<br />
v. 35, no. 6, L06502.<br />
The authors analyzed historical temperature records <strong>and</strong> mapped retrogressive thaw slumps<br />
in the Mackenzie Delta region using aerial photographs taken in 1950, 1973, <strong>and</strong> 2004.<br />
Retrogressive thaw slumps occur when ice-rich permafrost on sloping terrain thaws,<br />
exposing ice-rich soils that also thaw, <strong>and</strong> the resulting mud slurry falls to the base of the<br />
exposure. Headwalls can retreat farther during warm temperatures. Thaw slumps are<br />
common along coastlines <strong>and</strong> lakeshores in the western <strong>Arctic</strong>, <strong>and</strong> mapped slumps affected<br />
31
about 8 percent of the 2,880 lakes greater than 1 ha in area examined in this study. Thawslump<br />
growth is related to the ice content of the thawing terrain, slump aspect, <strong>and</strong><br />
morphology. Thaw slump rates were 1.4 times greater from 1973 to 2004 than from 1950 to<br />
1973, suggesting that warming temperatures are influencing thaw-slump activity <strong>and</strong> can be<br />
expected to increase with continued climate change. The study did not account for disturbed<br />
terrain lost to lake expansion, which occurred in about 10 percent of studied cases.<br />
Therefore, reported growth rates are likely conservative <strong>and</strong> are lower than other rates<br />
published in the literature.<br />
84. Lewkowicz, A.G., 1987, Headwall retreat of ground-ice slumps, Banks Isl<strong>and</strong>,<br />
Northwest Territories: Canadian Journal of Earth Sciences, v. 24, no. 6, p. 1077–1085.<br />
This paper develops an analytical model of headwall retreat based on measured energy<br />
fluxes, temperature, wind speed, <strong>and</strong> the ice face <strong>and</strong> ground slope. Calculated rates of<br />
retreat were close to maximum rates estimated from 10 years of aerial photographs. The<br />
model compared favorably to measured rates of daily <strong>and</strong> cumulative headwall retreat,<br />
although there was significant variability. Orientation of the slump was determined to be an<br />
unimportant variable, likely because direct-beam radiation only was a part of the total input.<br />
July was considered the most important month for ice ablation; however, the ice retreat rates<br />
were 1.5–2.5 times greater than the ablation rates, depending on slump geometry.<br />
Meteorological measurements were used to accurately calculate ablation rates in<br />
circumstances where the ice is freely exposed to the inputs.<br />
85. Lewkowicz, A.G., 2007, Dynamics of active-layer detachment failures, Fosheim<br />
Peninsula, Ellesmere Isl<strong>and</strong>, Nunavut, Canada: <strong>Permafrost</strong> <strong>and</strong> Periglacial Processes,<br />
v. 18, no. 1, p. 89–103.<br />
This paper catalogues <strong>and</strong> analyzes several fresh active-layer detachment slides that<br />
occurred on the Fosheim Peninsula during a warm period in late summer, 2005. Some<br />
failures moved instantaneously, while others moved downslope over several days.<br />
Constraining the bright sun-air temperature relationship developed in their 2005 publication,<br />
the authors determined that 7 days of warm <strong>and</strong> bright conditions were the necessary<br />
threshold to cause a failure. This failure continued to move even as temperatures <strong>and</strong><br />
insolation decreased. Effective stress analysis was used to explain two failures on slopes of<br />
10–18 degrees, which were able to continue traversing low-angled terrain only given<br />
dynamic loading <strong>and</strong> very low undrained basal shear strengths.<br />
86. Lewkowicz, A.G., <strong>and</strong> Harris, C., 2005, Frequency <strong>and</strong> magnitude of active-layer<br />
detachment failures in discontinuous <strong>and</strong> continuous permafrost, northern Canada:<br />
<strong>Permafrost</strong> <strong>and</strong> Periglacial Processes, v. 16, no. 1, p. 115–130.<br />
This study compares active layer detachment failures that occurred weeks to months after a<br />
fire in the discontinuous permafrost zone, <strong>and</strong> those failures generated rapidly by summer<br />
conditions in the continuous permafrost zone. The importance of threshold meteorological<br />
conditions <strong>and</strong> pre-conditioning of the active layer was noted. Post-fire slides occurred after<br />
the permafrost thawed, whereas, in the continuous permafrost zones, failures were related to<br />
the rapid thawing of ice lenses in the bottom of the active layer. Failures were more<br />
dependent on ground ice <strong>and</strong> surficial deposits than insolation, <strong>and</strong> failures were more<br />
prevalent on the north-facing slopes in the discontinuous permafrost zone where thermal<br />
disturbance was largest. Fire led to rapid geomorphic work, but over the longer term,<br />
warming of slopes in the continuous permafrost zone led to the greatest geomorphic work.<br />
The authors observed a surface heating threshold dependent on bright sunshine <strong>and</strong> daily air<br />
32
temperatures that, if maintained for 9–13 days, could lead to failures on the Fosheim<br />
Peninsula.<br />
87. Lewkowicz, A.G., <strong>and</strong> Harris, C., 2005, Morphology <strong>and</strong> geotechnique of active-layer<br />
detachment failures in discontinuous <strong>and</strong> continuous permafrost, northern Canada:<br />
Geomorphology, v. 69, no. 1, p. 275–297.<br />
This study compares 50 active-layer detachment failures caused by fire to several hundred<br />
such failures caused by summer meteorological triggers. Morphology <strong>and</strong> morphometry<br />
were similar for sites in the different permafrost zones, <strong>and</strong> mesoscale geomorphic factors<br />
also significantly control morphometry. Failures were categorized by morphology, <strong>and</strong> two<br />
main types were observed: (1)compact forms, which are bell-shaped <strong>and</strong> relatively small<br />
(less than 30 m) with little internal deformation; <strong>and</strong> (2) elongated forms, which are<br />
trapezoidal or hourglass-shaped, tens of meters long, with severely deformed toe slope<br />
sediments indicating higher velocities <strong>and</strong> greater inertia. Slope-stability tests indicated that<br />
failures in the discontinuous permafrost zone resulted from high pore pressures during rapid<br />
thawing of ice-rich permafrost. In the continuous permafrost zone, failures require preconditioning<br />
of the basal shear zone by annual solifluction or ice-lens development, which<br />
reduces shear strengths such that a periodic extreme event may trigger the slide.<br />
88. Lewis, K.C., Zyvoloski, G.A., Travis, B., Wilson, C., <strong>and</strong> Rowl<strong>and</strong>, J., 2012, Drainage<br />
subsidence associated with <strong>Arctic</strong> permafrost degradation: Journal of Geophysical<br />
Research—Earth Surface (2003–2012), v. 117, no. F4.<br />
This paper creates a model capable of h<strong>and</strong>ling water <strong>and</strong> heat transport, freeze thaw, <strong>and</strong><br />
ground subsidence. An analytical solution of a thawing soil column initially is derived, <strong>and</strong><br />
the output is compared to the Finite Element Heat <strong>and</strong> Mass Transfer model (FEHM). These<br />
analytical solutions may be applicable to situations with variable permeabilities if an<br />
appropriate average permeability is chosen. The FEHM then is combined with a freeze-thaw<br />
model, which is tested using the common frozen wall benchmark problem. The rates of<br />
simulated subsidence compared well to actual conditions. The model did not use a timevarying<br />
upper boundary condition, <strong>and</strong>, therefore, could be different given actual conditions<br />
in the <strong>Arctic</strong>. However, given that drainage <strong>and</strong> slumping can occur on weekly time scales,<br />
the true control may be a matter of initial thaw <strong>and</strong> drainage initiation.<br />
89. Liljedahl, A.K., Hinzman, L.D., <strong>and</strong> Schulla, J., 2012, Ice-wedge polygon type controls<br />
low-gradient watershed-scale hydrology, in Hinkel, K.M., ed., Tenth International<br />
Conference on <strong>Permafrost</strong>, Vol. 1—International Contributions: Salekhard, Russia,<br />
The Northern Publisher, p. 231–236.<br />
A coupled surface, unsaturated, <strong>and</strong> saturated zone hydrologic model was used to simulate<br />
runoff from patterned ground dominated either by low- or high-centered polygons.<br />
Catchment water storage <strong>and</strong> evapotranspiration were higher in the low-centered polygon<br />
model owing to storage of water in ponds on top of each polygon. Runoff was higher <strong>and</strong><br />
evapotranspiration was lower in the high-centered polygon model, because of the lack of<br />
storage potential in the high-centered polygons, <strong>and</strong> drainage to <strong>and</strong> export from the trough<br />
network. Because permafrost thaw may lead to polygons transitioning from low- to highcentered<br />
polygons, warming may result in decreased water storage <strong>and</strong> evapotranspiration<br />
potential from <strong>Arctic</strong> soils. However, , this model used a homogeneous domain, whereas, in<br />
reality, l<strong>and</strong>scapes contain both low- <strong>and</strong> high-centered polygons as well as trough <strong>and</strong> other<br />
thermokarst ponds, which may buffer these hydrologic shifts.<br />
33
90. Lin, Z., Niu, F., Xu, Z., Xu, J., <strong>and</strong> Wang, P., 2010, Thermal regime of a thermokarst<br />
lake <strong>and</strong> its influence on permafrost, Beiluhe Basin, Qinghai-Tibet Plateau. <strong>Permafrost</strong><br />
<strong>and</strong> Periglacial Processes, p. 21, no. 4, p. 315–324.<br />
This paper examined the spatial distribution of permafrost under <strong>and</strong> around a thermokarst<br />
lake, <strong>and</strong> monitored lakeshore retrogression. Eighty percent of the shoreline collapsed each<br />
year, with most of the collapse occurring in the late summer. Thaw depths were greater on<br />
the lakeshore relative to the surrounding terrain, <strong>and</strong> there appeared to be a through-going<br />
talik in the lake bottom. The lake bottom temperature ranged from 2 to 10°C, <strong>and</strong> the warm<br />
lake created a large thaw bulb <strong>and</strong> thermal signature that could be detected in the subpermafrost<br />
ground many tens of meters from the lake edge.<br />
91. Ling, F., <strong>and</strong> Zhang, T., 2004, Modeling study of talik freeze-up <strong>and</strong> permafrost<br />
response under drained thaw lakes on the Alaskan <strong>Arctic</strong> Coastal Plain: Journal of<br />
Geophysical Research, v. 109, no. D1, D01111.<br />
This paper presents a heat transport model to calculate the time needed for the talik beneath<br />
a lake to refreeze following lake drainage. Three initial ground temperature conditions were<br />
considered, <strong>and</strong> taliks of 28, 43, <strong>and</strong> 53 m thickness were determined to refreeze in 40, 106,<br />
<strong>and</strong> 157 years, respectively. Refreezing is slowed significantly by the latent heat of fusion<br />
needed to change water from a liquid to solid form. The authors recognized that a model<br />
also capable of h<strong>and</strong>ling advective heat transport owing to the flow of water in the talik<br />
would result in a more accurate result.<br />
92. Ling, F., Wu, Q., Zhang, T., <strong>and</strong> Niu, F., 2012, Modelling open talik formation <strong>and</strong><br />
permafrost lateral thaw under a thermokarst lake, Beiluhe Basin, Qinghai Tibet<br />
Plateau: <strong>Permafrost</strong> <strong>and</strong> Periglacial Processes, v. 23, no. 4, p. 312–321.<br />
This paper uses a two-dimensional unsteady finite-element model with heat transfer <strong>and</strong><br />
phase change to model talik formation in a study lake. <strong>Thermokarst</strong> lakes constitute a major<br />
heat source capable of raising ground temperatures in the surrounding terrain, <strong>and</strong> the<br />
greatest mean thaw rate (24.8 cm/y) occurred within the first 50 years after lake formation,<br />
93. Little, J.D., S<strong>and</strong>all, H., Walegur, M.T., <strong>and</strong> Nelson, F.E., 2003, Application of<br />
differential global positioning systems to monitor frost heave <strong>and</strong> thaw settlement in<br />
tundra environments: <strong>Permafrost</strong> <strong>and</strong> Periglacial Processes, v. 14, no. 4, p. 349–357.<br />
This paper describes the use of differential Global Positioning Systems (DGPS) for<br />
monitoring seasonal <strong>and</strong> annual frost heave <strong>and</strong> thaw settlement on the <strong>Arctic</strong> Coastal Plain<br />
of northern Alaska. The authors developed acrylite (durable lightweight plastic), tubeshaped<br />
platform targets with a prong-like bottom. The targets were about 20 cm long <strong>and</strong> 2.5<br />
cm in diameter. The targets were installed towards the end of the thaw season. The time<br />
required to make measurements at the targets varied from less than 1minute for stop-<strong>and</strong>-go<br />
kinematic to more than 10 minutes for rapid static DGPS survey mode. Using the rapid<br />
static configuration, the authors surveyed a field site composed of 30 targets using the rapid<br />
static survey method in 5–8 hours with a vertical error of about 1.5 cm. When these surveys<br />
were repeated within <strong>and</strong> among years, the authors measured about 1–2 cm of heave<br />
associated with the freeze-up period <strong>and</strong> 4–5 cm of subsidence at the time of maximum<br />
summer thaw. The advantages of DGPS include great accuracy <strong>and</strong> automatic placement of<br />
surveys within well-established geodetic coordinate systems. Drawbacks involve high costs,<br />
target reinsertion difficulties, <strong>and</strong> physical dem<strong>and</strong>s. DGPS entails significant time<br />
requirements compared to traditional leveling techniques when surveying small areas.<br />
However, DGPS has the potential to measure large regions much more rapidly than classical<br />
methods.<br />
34
94. Liu, L., Zhang, T., <strong>and</strong> Wahr, J., 2010, InSAR measurements of surface deformation<br />
over permafrost on the North Slope of Alaska: Journal of Geophysical Research,<br />
v. 115, no. F3, F03023.<br />
This paper describes the use of interferometric synthetic aperture radar (InSAR) for the<br />
measurement of vertical surface deformation (heave <strong>and</strong> thaw) for a 50-by-100-km region<br />
on the North Slope of Alaska centered on Prudhoe Bay <strong>and</strong> the Sag River. ERS-1 <strong>and</strong> ERS-2<br />
satellite imagery was used. Seasonal vertical movement of typical tundra settings was about<br />
1–4 cm. However, between 1992 <strong>and</strong> 2000, the l<strong>and</strong> surface moved downward at a rate of 1–<br />
4 cm per decade, which was interpreted as thawing of ice-rich permafrost in the transient<br />
layer or near the permafrost table. Lowering of ground surface as a result of increased thaw<br />
could partially explain the absence of a trend in active layer thickness increases over the<br />
same time period.<br />
95. Liu, L., Schaefer, K., Zhang, T., <strong>and</strong> Wahr, J., 2012, Estimating 1992–2000 average<br />
active layer thickness on the Alaskan North Slope from remotely sensed surface<br />
subsidence: Journal of Geophysical Research, v. 117, no. F1, F01005.<br />
This paper shows the usefulness of measuring active-layer thickness from thaw-season<br />
surface subsidence based on interferometric synthetic aperture radar (InSAR). An algorithm<br />
was developed that accounts for the vertical distribution of water content in the active layer,<br />
factoring in soil texture, organic matter, <strong>and</strong> moisture content, which can be used to estimate<br />
active-layer thickness based on the measurements of vertical surface deformation from the<br />
InSAR data. This algorithm was applied to ERS-1 <strong>and</strong> ERS-2 satellite InSAR-derived<br />
measurements for an 80-by-100-km area centered on Prudhoe Bay, Alaska, between 1992<br />
<strong>and</strong> 2000 to determine average active-layer thickness at relatively high resolution. Activelayer<br />
thickness values were reported to be within 10–20 cm of what was interpreted as<br />
reality <strong>and</strong> were based on the Circumpolar Active Layer <strong>Monitoring</strong> (CALM) program grids<br />
in the region. The estimated active layer thickness was 30–50 cm in moist tundra areas <strong>and</strong><br />
50–80 cm in wet tundra areas. This method could complement ground-based measurements<br />
<strong>and</strong> could be useful for closing the spatial gaps of in-place measurements in remote<br />
permafrost areas <strong>and</strong> for advancing our underst<strong>and</strong>ing of changes in the active layer <strong>and</strong><br />
permafrost system.<br />
96. Lloyd, A.H., Yoshikawa, K., Fastie, C.L., Hinzman, L., <strong>and</strong> Fraver, M., 2003, Effects of<br />
permafrost degradation on woody vegetation at arctic treeline on the Seward<br />
Peninsula, Alaska: <strong>Permafrost</strong> <strong>and</strong> Periglacial Processes, v. 14, no. 2, p. 93–101.<br />
This paper examined how climate-induced changes in active-layer thickness <strong>and</strong> soil<br />
drainage influences advancement of the treeline on the Seward Peninsula, Alaska. The<br />
authors measured active-layer thickness, soil moisture, density of tall shrub species, <strong>and</strong><br />
cover of low shrub species, <strong>and</strong> reconstructed white spruce establishment history along<br />
transects across the banks of a network of thaw ponds. Transects covered topographical<br />
types, including channels (low-lying depressions at the elevation of the thaw ponds), banks<br />
(the scarp at the edge of the thaw ponds <strong>and</strong> low-lying depressions), <strong>and</strong> flats (the level<br />
terrain at the top of the banks), <strong>and</strong> included sites with <strong>and</strong> without trees <strong>and</strong> shrubs. The<br />
authors counted <strong>and</strong> tagged each tree, measured tree characteristics, <strong>and</strong> took core samples<br />
to examine growth patterns; counted density of tall shrub stems; <strong>and</strong> counted other shrub<br />
species as a visual estimate of percent cover. Active-layer depth was measured in late<br />
August using a thaw-depth probe. Soil moisture was measured as volumetric soil water<br />
content using a dielectric constant measuring device inserted in the soil. Active-layer<br />
thickness did not vary along transects, but soils on thaw-pond banks were much drier than<br />
those on level tundra or thaw-pond channels. Furthermore, thaw-pond banks were the only<br />
35
sites where were successfully established, <strong>and</strong> shrubs were taller <strong>and</strong> more dominated by tall<br />
shrub species (for example, willow <strong>and</strong> shrub birch) than in other areas. The authors<br />
speculated that tree <strong>and</strong> shrub advancement in the tundra depends on well-drained<br />
microsites, such as microsites on thaw-pond banks, <strong>and</strong>, therefore, that treeline advancement<br />
is contingent on further degradation of existing permafrost.<br />
97. Lougheed, V.L., Butler, M.G., McEwen, D.C., <strong>and</strong> Hobbie, J.E., 2011, Changes in<br />
tundra pond limnology—Re-sampling Alaskan ponds after 40 years: Ambio, v. 40,<br />
no. 6, p. 589–599.<br />
This paper documents the resampling of several ponds near Barrow, Alaska, that were<br />
studied intensively in the 1970s, <strong>and</strong> found that the ponds had undergone a change in their<br />
physical, chemical, <strong>and</strong> biological characteristics. Differences included higher daily mean<br />
<strong>and</strong> maximum pond temperatures, higher concentrations of ammonia, nitrate, <strong>and</strong> soluble<br />
reactive phosphorus, <strong>and</strong> a marginal increase in phytoplankton biomass. The authors noted<br />
that it is difficult to make any broad statements regarding the effects of climate on these<br />
ponds given the small amount of data, <strong>and</strong> suggested that these ponds represent a unique <strong>and</strong><br />
valuable long-term dataset <strong>and</strong> should be sampled more frequently <strong>and</strong> maintained as<br />
Barrow exp<strong>and</strong>s.<br />
98. MacLean, R., Oswood, M.W., Irons, J.G., <strong>and</strong> McDowell, W.H., 1999, The effect of<br />
permafrost on stream biogeochemistry—A case study of two streams in the Alaskan<br />
(USA) taiga: Biogeochemistry, v. 47, no. 3, p. 239–267.<br />
This paper examines the effect of permafrost on stream chemistry by analyzing soils<br />
chemistry in shallow organic soils <strong>and</strong> groundwater derived from springs <strong>and</strong> wells.<br />
Extensive permafrost led to a greater hydrograph response to spring thaw <strong>and</strong> summer<br />
storms, as well as a stronger signature of organic soil chemistry in the stream. Nitrogen<br />
cycling appeared to occur independent of permafrost extent, as indicated by limited<br />
correlations between nitrogen <strong>and</strong> discharge. A conceptual model is provided, indicating<br />
different flowpaths through organic <strong>and</strong> mineral soils, depending on permafrost extent.<br />
99. Mackay, J.R., 1970, Disturbances to the tundra <strong>and</strong> forest tundra environment of the<br />
western <strong>Arctic</strong>: Canadian Geotechnical Journal, v. 7, no. 4, p. 420–432.<br />
The e terms thermokarst <strong>and</strong> thermo-erosion are defined, <strong>and</strong> differences between these two<br />
terms are highlighted, particularly the importance of thermal degradation <strong>and</strong> vertical<br />
subsidence of thermokarst versus the importance of thermal degradation, mechanical<br />
erosion, <strong>and</strong> lateral expansion under the influence of flowing water for thermo-erosion. The<br />
author uses multiple examples from Northern Canada to explain his views of these<br />
processes. Examples include the impact of man-made disturbances from seismic<br />
exploration, a wildfire, a seepage in a channel, <strong>and</strong> a dog kennel patch on underlying<br />
permafrost. Field-measured rates of thermokarst <strong>and</strong> thermo-erosion are reported for each of<br />
these examples.<br />
100. Mackay, J.R., 1972, The world of underground ice: Annals of the Association of<br />
American Geographers, v. 62, no. 1, p. 1–22.<br />
This paper provides an overview of the types <strong>and</strong> forms of ground ice. The paper includes a<br />
map of permafrost distribution across the northern hemisphere, <strong>and</strong> a schematic indicating<br />
how different processes lead to different forms of ground ice. The paper discusses many<br />
forms of ground ice <strong>and</strong> how they originate <strong>and</strong> thaw, <strong>and</strong> describes the formation of three<br />
pingos on the coastal plain at length. The potential for ice to exist beneath the ocean is also<br />
noted.<br />
36
101. Mackay, J.R., 1998, Pingo growth <strong>and</strong> collapse, Tuktoyaktuk Peninsula area, western<br />
<strong>Arctic</strong> coast, Canada—A long-term field study: Géographie physique et Quaternaire,<br />
v. 52, no. 3, p. 271–323.<br />
This paper presents results from repeat topographical surveys on 11pingos in the western<br />
Canadian <strong>Arctic</strong> over a 20–25 year period. The paper focuses on pingo genesis; the role of<br />
pore water expulsion when saturated s<strong>and</strong>s freeze; long-term pingo growth data; sub-pingo<br />
water lenses; hydrofracturing, peripheral faulting, <strong>and</strong> spring flow; <strong>and</strong> pingo collapse. One<br />
pingo in the study area grew by 4.5 m during the study period. Information is presented on<br />
two pulsating pingos that showed signs of increased <strong>and</strong> decreased height during the study<br />
period. Several mechanisms responsible for pingo collapse also are discussed.<br />
102. Mackay, J.R., <strong>and</strong> Burn, C.R., 2002, The first 20 years (1978–1979 to 1998–1999) of<br />
active-layer development, Illisarvik experimental drained lake site, western <strong>Arctic</strong><br />
coast, Canada: Canadian Journal of Earth Sciences, v. 39, no. 11, p. 1657–1674.<br />
This paper presents information on active-layer thickness, snow depth, soil temperature,<br />
near-surface ground ice, soil heave, <strong>and</strong> permafrost temperature in the 20 years following<br />
the artificial drainage of a lake in the western Canadian <strong>Arctic</strong>. <strong>Permafrost</strong> began to aggrade<br />
the year following the lake drainage. However, as vegetation colonized the basin floor,<br />
snow accumulation increased as well as the active layer. The rate of growth of<br />
aggradational ice in the permafrost has been 0.5 cm/yr over the first 20 years since the lake<br />
drainage was induced.<br />
103. Mackay, J.R., <strong>and</strong> Burn, C.R., 2002, The first 20 years (1978–1979 to 1998–1999) of<br />
ice-wedge growth at the Illisarvik experimental drained lake site, western <strong>Arctic</strong> coast,<br />
Canada: Canadian Journal of Earth Sciences, v. 39, no. 1, p. 95–111.<br />
This paper provides information on the growth of ice wedges in a drained lake basin over a<br />
20-year period following the artificial drainage of the lake in the western Canadian <strong>Arctic</strong>.<br />
Ice wedges began to grow the year immediately following drainage but had stopped<br />
growing any further 12 years post-drainage. This was a result of vegetation growth in the<br />
basin <strong>and</strong> associated snow accumulation in the basin.<br />
104. Maher, A.I., Treitz, P.M., <strong>and</strong> Ferguson, M.A., 2012, Can L<strong>and</strong>sat data detect<br />
variations in snow cover within habitats of arctic ungulates?: Wildlife Biology, v. 18,<br />
no. 1, p. 75–87.<br />
Modeling suggests increased snow cover in the warming <strong>Arctic</strong> may affect ungulate<br />
populations through reduced food access in winter. This paper examined whether satellite<br />
imagery could be used to predict snow cover <strong>and</strong> snow depth at the l<strong>and</strong>scape level to better<br />
predict ungulate population dynamics. L<strong>and</strong>sat imagery was used to estimate fieldmeasured<br />
percent snow-covered area (F-SCA) <strong>and</strong> to develop a threshold for a normalized<br />
difference snow index (NDSI) in wintering areas of the Peary caribou herd in the Bathurst<br />
Isl<strong>and</strong>s, Northwest Territories, Canada. An NDSI threshold of 0.7 instead of 0.4 used in<br />
previous literature was more correlated to total snowfall or snow depth than using the<br />
nearest weather station, <strong>and</strong> could detect winters with relatively mild snow-cover<br />
conditions, but not those with very severe conditions. The authors recommended<br />
development of greater NDSI thresholds <strong>and</strong> suggested that these methods might be more<br />
useful for southern <strong>Arctic</strong> regions where sun angles would be less limiting than in the<br />
Bathurst Isl<strong>and</strong>s.<br />
37
105. Marsh, P., Russell, M., Pohl, S., Haywood, H., <strong>and</strong> Onclin, C., 2008, Changes in thaw<br />
lake drainage in the Western Canadian <strong>Arctic</strong> from 1950 to 2000: Hydrological<br />
Processes, v. 23, no. 1, p. 145–158.<br />
This paper assesses the drainage of thermokarst lakes between 1950 <strong>and</strong> 2000 for a 10,000-<br />
km 2 study area in the western Canadian <strong>Arctic</strong> on the east side of the MacKenzie Delta. The<br />
authors used a combination of historical aerial photographs <strong>and</strong> topographic maps to<br />
determine lake drainage events in three time periods: 1950–1973, 1973–1985, <strong>and</strong> 1985–<br />
2000. Between 1950 <strong>and</strong> 2000, 41 lakes drained in the study region for a rate of 0.82 lakes<br />
per year; however, when drainage events are assessed per time period, the lake drainage<br />
rate has decreased from 1.13 to 0.83 to 0.30 lakes per year, respectively. The minimum lake<br />
mapping unit in this study was unclear, as were the factors responsible for the reduction in<br />
the number of lake drainage events across time. Based on modeling <strong>and</strong> hydrological<br />
observations, one lake that drained in 1989 was believed to result from a combination of a<br />
warm summer, a resulting deep active layer, <strong>and</strong> a moderately high lake level.<br />
106. Matell, N., Anderson, R.S., Overeem, I., Wobus, C., Urban, F.E., <strong>and</strong> Clow, G.D.,<br />
2013, Modeling the subsurface thermal impact of <strong>Arctic</strong> thaw lakes in a warming<br />
climate; Computers <strong>and</strong> Geosciences, v. 53, p. 69–79.<br />
This paper uses a one-dimensional model combining heat conduction, lake ice, <strong>and</strong><br />
subsidence to evaluate temperature as a function of depth in thermokarst lakes. Modeled<br />
scenarios involved simulating talik formation in lakes with different depths. A lake depth<br />
threshold was recognized, such that lakes deeper than about 1.25 m are capable of<br />
significantly altering the thermal state of the subsurface, resulting in talik formation <strong>and</strong><br />
subsidence.<br />
107. McRoberts, E.C., <strong>and</strong> Morgenstern, N.R., 1974, The stability of thawing slopes:<br />
Canadian Geotechnical Journal, v. 11, no. 4, p. 447–469.<br />
This study provides a review of the common types of thaw-dominated l<strong>and</strong>slides. A<br />
common force balance used in the geotechnical field, the factor of safety, is used to show<br />
that slides should not be occurring on the low-angled slopes on which they are observed,<br />
unless thaw-consolidation can provide additional water to increase pore pressures. Two<br />
mass movement models, the thaw-consolidation model <strong>and</strong> the ablation model, are<br />
considered. The importance of removing vegetation to begin the thaw process is<br />
recognized.<br />
108. Mesquita, P.S., Wrona, F.J., <strong>and</strong> Prowse, T.D., 2010, Effects of retrogressive<br />
permafrost thaw slumping on sediment chemistry <strong>and</strong> submerged macrophytes in<br />
<strong>Arctic</strong> tundra lakes: Freshwater Biology, v. 55, no. 11, p. 2347–2358.<br />
This study compares lake water chemistry, sediment chemistry, <strong>and</strong> physical parameters, as<br />
well as macrophyte biomass <strong>and</strong> community structure from three undisturbed lakes <strong>and</strong> five<br />
lakes with retrogressive thaw slumps. There was no difference in water-column nutrients<br />
for the disturbed lakes compared to the undisturbed lakes, but the disturbed lakes had<br />
higher electrical conductivity <strong>and</strong> pH. Disturbed lake sediments had lower organic matter<br />
concentrations <strong>and</strong> higher concentrations of many macro <strong>and</strong> micro nutrients. Disturbed<br />
lakes had higher transparency <strong>and</strong> macrophyte biomass, <strong>and</strong> were dominated by mosses.<br />
Light attenuation was the only significant variable that explained macrophyte distribution<br />
patterns.<br />
38
109. Michel, F.A., <strong>and</strong> Van Everdingen, R.O., 1994, Changes in hydrogeologic regimes in<br />
permafrost regions due to climatic change: <strong>Permafrost</strong> <strong>and</strong> Periglacial Processes, v. 5,<br />
no. 3, 191–195.<br />
This paper summarizes the effects of climate change on groundwater systems in permafrost<br />
regions. Subsurface aquifers have the potential to develop as permafrost thaws, <strong>and</strong> this<br />
may have substantial implications for regional groundwater flow, as well as for river<br />
discharge <strong>and</strong> chemistry.<br />
110. Morgenstern, A., Grosse, G., Guenther, F., Fedorova, I., <strong>and</strong> Schirrmeister, L., 2011,<br />
Spatial analyses of thermokarst lakes <strong>and</strong> basins in yedoma l<strong>and</strong>scapes of the Lena<br />
Delta: The Cryosphere, v. 5, p. 849–867.<br />
This paper presents a GIS analysis of thermokarst lakes <strong>and</strong> basins on three different aged<br />
l<strong>and</strong> surfaces on the Lena Delta in Siberia. Lakes were manually extracted from a L<strong>and</strong>sat-7<br />
ETM+ satellite image <strong>and</strong> basins were manually mapped at a scale of 1:30,000. Lakes<br />
covered only 5 percent of the study region. Adding the presence of drained basins to the<br />
assessment of the effect of thermokarst on the l<strong>and</strong>scape increased the estimate to 22<br />
percent. These findings are placed in the context of the potential for future areas of the<br />
study region to experience thermokarst development.<br />
111. Murdoch, A., <strong>and</strong> Power, M., 2013, The effect of lake morphometry on thermal<br />
habitat use <strong>and</strong> growth in <strong>Arctic</strong> char populations—Implications for underst<strong>and</strong>ing<br />
climate‐change impacts: Ecology of Freshwater Fish, v. 22, no. 3, p. 453–466<br />
(published online first).<br />
This paper reconstructs historical temperatures from <strong>Arctic</strong> charr otoliths sampled from<br />
small, shallow <strong>and</strong> large, deeper thermokarst lakes in Ungava Bay, Quebec, Canada.<br />
0xygen stable isotope temperature reconstruction methods were used to estimate<br />
temperatures. Water temperature averaged 13.1°C <strong>and</strong> growth rates ranged from about 50 to<br />
85 mm/year. There was weak evidence that growth of the fish in the smaller lake increased<br />
with age through increased use of cooler thermal habitats, but no such relationship was<br />
observed in the larger lake. However, increasing air temperatures significantly decreased<br />
growth rates in the smaller <strong>and</strong> shallower lake, possibly because of warmer surface <strong>and</strong><br />
littoral waters <strong>and</strong> limited preferred cool-water habitat. This relationship was not found in<br />
the larger <strong>and</strong> deeper lake. The authors suggested that char were not as vulnerable to the<br />
impacts of temperature warming in the larger lake, possibly because of better behavioral<br />
thermoregulation opportunities in a cooler, deeper lake.<br />
112. Murton, J.B., 2001, <strong>Thermokarst</strong> sediments <strong>and</strong> sedimentary structures, Tuktoyaktuk<br />
coastl<strong>and</strong>s, western <strong>Arctic</strong> Canada: Global <strong>and</strong> Planetary Change, v. 28, no. 1,<br />
p. 175–192.<br />
This study provides evidence of substantial thermokarsting activity associated with a warm<br />
period on the <strong>Arctic</strong> Coast between 10 <strong>and</strong> 9 thous<strong>and</strong> years (ka) Before Present (BP).<br />
Many types of themokarsts are categorized, <strong>and</strong> the most distinctive types are suggested as<br />
follows: 1) peaty diamicton deposited mainly by debris flows in retrogressive thaw slumps,<br />
2) a basal unit of diamicton in thermokarst-basin sequences attributed to progradation of<br />
material transported into thaw lakes by thaw slumping around their margins, 3) involutions<br />
attributed to soft-sediment deformation during active-layer deepening; <strong>and</strong> 4) casts of ice<br />
<strong>and</strong> composite wedges. The authors assert that these forms are caused by the thaw of<br />
excessive ice, <strong>and</strong> suggest that some of these structures may have been or could be<br />
mistakenly classified as glacial deposits in other studies.<br />
39
113. Murton, J.B., 2013, Ground ice <strong>and</strong> cryostratigraphy in Shroder, J., <strong>and</strong> others, eds.,<br />
Treatise on geomorphology: San Diego, Academic Press, v. 8, Glacial <strong>and</strong> Periglacial<br />
Geomorphology, p. 173–201.<br />
This book chapter provides a review on ground ice <strong>and</strong> cryostratigraphy–the stratigraphic<br />
analysis of ice-rich permafrost. The description <strong>and</strong> genesis of ice in frozen ground are<br />
reviewed <strong>and</strong> demonstrated through case studies related to 1) the transition zone at the top<br />
of permafrost, (2) massive ice <strong>and</strong> icy sediments, (3) ice wedges, <strong>and</strong> (4) yedoma <strong>and</strong><br />
related deposits. A section is also included on mapping ground ice. Detailed information on<br />
cryostructures in permafrost is given in table 1 of the chapter, <strong>and</strong> information on<br />
cryofacies of frozen sediments is given in table 2. The chapter concludes with a<br />
recommendation on future research needs in the field of crystratigraphy.<br />
114. Nelson, F.E., Hinkel, K.M., Shiklomanov, N.I., Mueller, G.R., Miller, L.L., <strong>and</strong><br />
Walker, D.A., 1998, Active-layer thickness in north central Alaska—Systematic<br />
sampling, scale, <strong>and</strong> spatial autocorrelation: Journal of Geophysical Research, v. 103,<br />
no. D22, p. 28963–28973.<br />
This paper measures active-layer depth at many sites with a wide range of terrain, soil, <strong>and</strong><br />
vegetation characteristics across the <strong>Arctic</strong> Coastal Plain <strong>and</strong> <strong>Arctic</strong> Foothills, Alaska.<br />
Along 100-m grids at 7 sites, a graduated steel rod was placed in the soil to measure activelayer<br />
depth. The authors evaluated their approach <strong>and</strong> found that the depth at probe<br />
resistance corresponds closely to the frost table. They observed high spatial, but low<br />
temporal heterogeneity in active-layer depth that varied between the coastal plain <strong>and</strong> the<br />
foothills. Samples were taken during 2 years with similar air temperatures, which may<br />
explain the low temporal variability in active-layer depth. Active-layer thickness was<br />
influenced by microclimate, hydrology, soil moisture, <strong>and</strong> vegetation. This authors<br />
attempted to use a network of monitoring sites that were established to collect a wide range<br />
of ecological data across northern Alaska. The authors learned, however, that, although the<br />
100-m scale was suitable for the coastal plain, narrow water tracks <strong>and</strong> tussock tundra in the<br />
foothills led to variations in thaw depth over short lateral distances. Reconnaissance<br />
sampling in this area was recommended to determine the appropriate sampling scale for<br />
particular variables.<br />
115. Nicol, S., Roach, J.K., <strong>and</strong> Griffith, B., Spatial heterogeneity in statistical power to<br />
detect changes in lake area in Alaskan National Wildlife Refuges: L<strong>and</strong>scape Ecology,<br />
p. 1–11.<br />
This paper investigates how the statistical power to detect trends in lake sizes in the<br />
National Wildlife Refuges of Alaska are affected by the area of analysis <strong>and</strong> the number of<br />
years of monitoring. The authors used large study areas (930–4,560 km 2 ) <strong>and</strong> smaller cells<br />
(2.6–25.9 km 2 ) during 4–50-year periods, <strong>and</strong> observed that trends could be detected within<br />
5–15 years, that trends smaller than 2.0percent per year required more than 50 years to<br />
detect, <strong>and</strong> that there was substantial spatial variation in the time required to detect changes<br />
among the smaller cells. The authors suggested that even small trends may be ecologically<br />
meaningful, <strong>and</strong> so long-term monitoring should be established as early as possible.<br />
40
116. Niu, F., Lin, Z., Liu, H., <strong>and</strong> Lu, J., 2011, Characteristics of thermokarst lakes <strong>and</strong><br />
their influence on permafrost in Qinghai-Tibet Plateau: Geomorphology, v. 132, no. 3,<br />
p. 222–233.<br />
This study focused on regional-scale characteristics of the lakes near the Qinghai-Tibet<br />
Railroad, with narrower foci on the chemistry of 11 lakes <strong>and</strong> permafrost configuration in 1<br />
lake. Lake depth was observed to vary from 0.4–3 m, with most lakes freezing to the<br />
bottom during the winter. More lakes were present in the ice-rich permafrost regions, <strong>and</strong><br />
lake salinity varied greatly, from 0.36 to 30.17 g/L across regions. The intensively studied<br />
lake was determined to be 890 years old based on cesium-137 <strong>and</strong> lead-210 isotope dating.<br />
No ice was observed beneath the center of the intensively studied lake (to 60 m), which was<br />
attributed to an open talik.<br />
117. Osterkamp, T.E., <strong>and</strong> Jorgenson, M.T., 2009, <strong>Permafrost</strong> conditions <strong>and</strong> processes, in<br />
Young, Rob, <strong>and</strong> Norby, Lisa, eds., Geological <strong>Monitoring</strong>: Boulder, Colorado,<br />
Geological Society of America, p. 205–227.<br />
This paper provides a perspective on permafrost stability, the cause for concern given<br />
current <strong>and</strong> predicted climate trends, <strong>and</strong> the need for establishing a monitoring network to<br />
better underst<strong>and</strong> the patterns <strong>and</strong> processes of thermokarst development to plan for<br />
potential effects <strong>and</strong> for developing reasonable responses to them. Recommendations are<br />
made for developing st<strong>and</strong>ard methods for thermokarst monitoring that focus on changes<br />
that have already occurred, current state of the l<strong>and</strong>scape, <strong>and</strong> monitoring of potential future<br />
change. <strong>Monitoring</strong> should start with proper site selection that is best guided by a map,<br />
model, or general underst<strong>and</strong>ing of permafrost distribution <strong>and</strong> characteristics in a given<br />
area. Other factors to consider when developing a long-term monitoring site include access,<br />
availability of long-term climate data, terrain, snow cover, hydrology, geology, vegetation,<br />
<strong>and</strong> security. A series of steps related to monitoring the vital signs (thermal <strong>and</strong> physical<br />
conditions) of permafrost stability also is provided. For monitoring the permafrost thermal<br />
state (from simple to more complex), the following steps (or levels) apply: Level 1 includes<br />
the determination of a frozen or thawed state through probing, Level 2 incorporates<br />
permafrost surface temperature monitoring with data loggers, <strong>and</strong> Level 3 incorporates<br />
deep, vertical permafrost temperature borehole logging. For monitoring physical conditions,<br />
the following steps (or levels) apply: Level 1 includes mapping the presence, absence, or<br />
both, of thermokarst features from field or aerial observations or sampling strategies, Level<br />
2 involves the establishment of photographic trend plots <strong>and</strong> topographic surveys related to<br />
thaw settlement, <strong>and</strong> Level 3 involves soil <strong>and</strong> ground ice stratigraphy sampling <strong>and</strong><br />
description <strong>and</strong> incorporation of remote sensing for inventorying <strong>and</strong> change detection<br />
analysis. The authors provided three key questions that one should ask during the study<br />
design phase: (1) Is permafrost present, <strong>and</strong> is there any evidence that is has thawed in the<br />
past?, (2) What is the current thermal state of the permafrost, <strong>and</strong> what is the current extent<br />
of the thawing?, <strong>and</strong> (3) What is the projected future thermal state of the permafrost, <strong>and</strong><br />
what are the rates <strong>and</strong> characteristics of change associated with thermokarst terrain? The<br />
paper concludes with a case study <strong>and</strong> rough cost estimates for developing a comprehensive<br />
permafrost condition <strong>and</strong> thermokarst monitoring program.<br />
41
118. Osterkamp, T.E., <strong>and</strong> Romanovsky, V.E., 1996, Characteristics of changing<br />
permafrost temperatures in the Alaskan <strong>Arctic</strong>, USA: <strong>Arctic</strong> <strong>and</strong> Alpine Research,<br />
v. 28, no. 3, p. 267-273.<br />
The paper presents results on permafrost temperature readings in northern Alaska from<br />
1983 to 1993 at both deep borehole <strong>and</strong> shallow ground temperature monitoring sites.<br />
Simulations r also are made between the 1-m-deep <strong>and</strong> 20-m-deep readings to complete<br />
data gaps associated with lack of monitoring equipment at intermediate depths. The data<br />
show that the permafrost in northern Alaska began to warm at the end of the 1980s.<br />
119. Parsekian, A.D., Grosse, G., Walbrecker, J.O., Müller‐Petke, M., Keating, K., Liu, L.,<br />
<strong>and</strong> Knight, R., 2013, Detecting unfrozen sediments below thermokarst lakes with<br />
surface nuclear magnetic resonance: Geophysical Research Letters, v. 40, no. 3,<br />
p. 535–540.<br />
The authors use a geophysical method to determine frozen <strong>and</strong> unfrozen conditions under<br />
thermokarst lakes in the Fairbanks, Alaska, region. The method, Nuclear Magnetic<br />
Resonance, allows a point measurement of talik depth. The authors were able to image a<br />
situation with a closed-talik <strong>and</strong> an open-talik. They also were able to image the base of the<br />
permafrost in a terrestrial setting.<br />
120. Parsekian, A.D., Jones, B.M., Jones, M., Grosse, G., Anthony, W., Katey, M., <strong>and</strong><br />
Slater, L., 2011, Expansion rate <strong>and</strong> geometry of floating vegetation mats on the<br />
margins of thermokarst lakes, northern Seward Peninsula, Alaska, USA: Earth<br />
Surface Processes <strong>and</strong> L<strong>and</strong>forms, v. 36, no. 14, p. 1889–1897.<br />
This paper describes the formation of floating vegetation mats on the margin of exp<strong>and</strong>ing<br />
thermokarst lakes on the northern Seward Peninsula between 1950 <strong>and</strong> 2007. These features<br />
have been described widely in boreal ecosystems in Alaska but seldom have been described<br />
in arctic tundra settings. Based on ground-penetrating radar, the vegetation mats were an<br />
estimated 60 cm thick <strong>and</strong>, based on probing <strong>and</strong> temperature measurements, the water<br />
below the vegetation mat remained thawed during the winter <strong>and</strong> a talik 4 m or more thick<br />
developed beneath the mat while the lake froze completely to its bottom. The maximum<br />
expansion rate of the floating mat feature into the adjacent tundra through permafrost<br />
degradation was 1–2 m/yr. Including the area associated with these mats increased the l<strong>and</strong><br />
area subject to permafrost degradation by 4 percent between 1950 <strong>and</strong> 2006.<br />
121. Peterson, K.M., <strong>and</strong> Billings, W.D., 1980, Tundra vegetational patterns <strong>and</strong> succession<br />
in relation to microtopography near Atkasook, Alaska: <strong>Arctic</strong> <strong>and</strong> Alpine Research,<br />
p. 473–482.<br />
This paper provides an overview on vegetation distribution <strong>and</strong> succession as it relates to<br />
microtopography that results from various geomorphic agents acting in the area near<br />
Atqasuk, Alaska. Information is given on vegetation patterns related to ice wedges, river<br />
banks <strong>and</strong> river me<strong>and</strong>ering, <strong>and</strong> wind action. Two examples of the role of animals on<br />
vegetation patterns in the region also are presented.<br />
122. Plug, L.J., <strong>and</strong> West, J.J., 2009, Thaw lake expansion in a two‐dimensional coupled<br />
model of heat transfer, thaw subsidence, <strong>and</strong> mass movement: Journal of Geophysical<br />
Research—Earth Surface (2003–2012), v. 114, no. F1.<br />
This paper presents a model that combines key factors controlling thermokarst lake<br />
expansion: heat transfer <strong>and</strong> thawing of lake banks, <strong>and</strong> movement of thawed materials<br />
away from the shore. The model was created to simulate two systems from the Seward<br />
Peninsula <strong>and</strong> the Yukon Coastal Plain, <strong>and</strong> the resulting lakeshore profiles were<br />
determined to be broadly consistent with actual lakes. Lakes from the Seward Peninsula<br />
42
exp<strong>and</strong>ed more rapidly, even under identical climates, which the authors attributed to their<br />
deeper basins <strong>and</strong> steeper bathymetric slopes that move thawed material away from the lake<br />
margins. An increase in mean annual air temperatures of 3°C could increase lake expansion<br />
rates by 1.5–2.5 times. The model was used to show that a temperature decrease of8°C<br />
would halt lake expansion, which is consistent with paleo-studies indicating that the basins<br />
formed because of postglacial warming. The model shows that thaw basins exp<strong>and</strong><br />
monotonically, but the lakes do not. Therefore, measuring basin changes may be the best<br />
way to detect thermokarst acceleration related to climate.<br />
123. Prowse, T., Alfredsen, K., Beltaos, S., Bonsal, B.R., Bowden, W.B., Duguay, C.R., <strong>and</strong><br />
Weyhenmeyer, G.A., 2011, Effects of changes in arctic lake <strong>and</strong> river ice: AMBIO, A<br />
Journal of the Human Environment, v. 40, p. 63–74.<br />
This paper summarizes the hydrological, ecological, <strong>and</strong> socio-economic consequences of<br />
climate-change-mediated changes to freshwater ice in the <strong>Arctic</strong>. Key impacts include<br />
changes to low flows, lake evaporation regimes <strong>and</strong> water levels, <strong>and</strong> the timing <strong>and</strong><br />
severity of river-ice break-up. River geomorphology, vegetation regimes, <strong>and</strong> nutrientsediment<br />
fluxes that sustain aquatic ecosystems are particularly sensitive to changes in the<br />
severity <strong>and</strong> timing of river-ice break-up. Both positive <strong>and</strong> negative effects of these<br />
changes on stream biota are possible. Changes in ice-induced hydrological connectivity <strong>and</strong><br />
lake stratification could lead to the loss of some species <strong>and</strong> the establishment of others.<br />
Socio-economic factors affected include transportation <strong>and</strong> hydroelectric production. Ice<br />
roads may no longer be feasible <strong>and</strong> hydroelectric potential (that is, waterflow) may<br />
increase, but changes to ice blockages <strong>and</strong> dynamic ice flow on dam infrastructure may<br />
reduce production <strong>and</strong> increase costs. Implementation of a monitoring plan that<br />
incorporates remote sensing approaches along with in-place networks of observation sites is<br />
recommended. Advancements in methods to model l<strong>and</strong>scape hydrology, water-ice-air<br />
energy exchanges, in-stream hydraulics, <strong>and</strong> ice mechanics would improve prediction of<br />
river-ice regimes. <strong>Monitoring</strong> should exp<strong>and</strong> from primarily physical characteristics to<br />
include effects on lentic (that is, lake) <strong>and</strong> lotic (that is, stream <strong>and</strong> river) ecosystems.<br />
124. Pullman, E.R., Jorgenson, M.T., <strong>and</strong> Shur, Y., 2007, Thaw settlement in soils of the<br />
<strong>Arctic</strong> Coastal Plain, Alaska: <strong>Arctic</strong>, Antarctic, <strong>and</strong> Alpine Research, v. 39, no. 3,<br />
p. 468–476.<br />
This paper describes a synthesis of field surveys <strong>and</strong> thaw-strain <strong>and</strong> thaw-depth measures<br />
derived from soil cores taken between 1998 <strong>and</strong> 2003 in a study region spanning from<br />
Prudhoe Bay to west of the Colville River Delta. Thaw strain was determined for each of<br />
the 108 core samples, <strong>and</strong> mean thaw strain was calculated for each of the sampled terrain<br />
units. Potential thaw settlement was estimated as the decrease in volume a frozen soil<br />
sample undergoes when thawed for individual soil horizons <strong>and</strong> the potential change in the<br />
active-layer thickness caused by surface disturbance. Therefore, thaw settlement is a<br />
function of the original thickness of the active layer, the increase of the active layer as it<br />
adjusts to disturbance at the surface, <strong>and</strong> the thaw strain of the underlying permafrost. The<br />
study area was divided into 12 terrain units <strong>and</strong> an estimate of potential thaw settlement<br />
was provided for each unit. Mean thaw settlement associated with a thickening of the active<br />
layer to 1.1 m in s<strong>and</strong>y soils associated with active me<strong>and</strong>er river channels resulted in zero<br />
thaw settlement; however, the same thickening of the active layer in very ice-rich silty soils<br />
would result in a thaw settlement of about 0.9 m. The authors also scaled up their estimates<br />
to cover the various ecotypes that represent the larger <strong>Arctic</strong> Coastal Plain region. These<br />
estimates are representative of the centers of ice-wedge polygonal terrain <strong>and</strong> do not factor<br />
in thermokarst that would result from degrading ice wedges <strong>and</strong> other massive ice bodies.<br />
43
125. Regmi, P., Grosse, G., Jones, M.C., Jones, B.M., <strong>and</strong> Anthony, K.W., 2012,<br />
Characterizing post-drainage succession in thermokarst lake basins on the Seward<br />
Peninsula, Alaska with TerraSAR-X Backscatter <strong>and</strong> L<strong>and</strong>sat-based NDVI Data:<br />
Remote Sensing, v. 4, no. 12, p. 3741–3765.<br />
The authors report on remote sensing methods using Terra-SAR-X satellite data <strong>and</strong><br />
L<strong>and</strong>sat-7 ETM+ data to characterize succession in drained thermokarst lake basins of<br />
different age on the Seward Peninsula, Alaska. Succession in these basins includes a shift in<br />
vegetation from highly productive meadow-like fens to typical lowl<strong>and</strong> tundra, a refreezing<br />
(permafrost aggradation) of formerly unfrozen lake sediments, a reduction of soil water<br />
saturation owing to enhanced drainage, <strong>and</strong> the development of terrestrial peat soils across<br />
the course of several centuries to millennia. A good relationship was established between<br />
the TerraSAR-X signal <strong>and</strong> basin age (time since drainage).<br />
126. Romanovsky, V.E., Smith, S.L., <strong>and</strong> Christiansen, H.H., 2010, <strong>Permafrost</strong> thermal<br />
state in the polar Northern Hemisphere during the international polar year 2007–<br />
2009—A synthesis: <strong>Permafrost</strong> <strong>and</strong> Periglacial Processes, v. 21, no. 2, p. 106–116.<br />
This paper provides an overview on the thermal state of permafrost in the Northern<br />
Hemisphere <strong>and</strong> development of a permafrost monitoring program over the latter half of the<br />
20th century. <strong>Permafrost</strong> temperatures generally have warmed since the 1980s, <strong>and</strong> the<br />
warming has been most pronounced in the cold permafrost regions or regions within the<br />
continuous permafrost zone. As of the time of publication, there were 575 ground<br />
temperature monitoring stations in the Northern Hemisphere.<br />
127. Rowl<strong>and</strong>, J.C., Jones, C.E., Altmann, G., Bryan, R., Crosby, B.T., Hinzman, L.D., <strong>and</strong><br />
Geernaert, G.L., 2010, <strong>Arctic</strong> l<strong>and</strong>scapes in transition—Responses to thawing<br />
permafrost: Eos, Transactions American Geophysical Union, v. 91, no. 26, p. 229.<br />
This paper provides an overview of the critical changes occurring in the <strong>Arctic</strong> related to<br />
thawing permafrost. The authors note significant <strong>and</strong> rapid changes in the <strong>Arctic</strong>,<br />
suggesting that this system may be particularly sensitive to even small climate<br />
perturbations. Therefore, scientists need to know more about the mechanisms <strong>and</strong><br />
feedbacks driving current l<strong>and</strong>scape processes in order to better predict future changes. The<br />
authors detail many of the effects associated with thawing permafrost including<br />
redistribution of water, altered drainage networks, river discharge, sediment <strong>and</strong> nutrient<br />
movement, <strong>and</strong> release of carbon from permafrost. They discuss several factors that limit<br />
our underst<strong>and</strong>ing <strong>and</strong> predictions of l<strong>and</strong>scape change, including subsurface heterogeneity<br />
<strong>and</strong> limitations in quantifying ground ice, feedbacks between thaw <strong>and</strong> vegetation, <strong>and</strong><br />
difficulty in numerical simulations of these processes. The authors suggest that a more<br />
integrated approach is needed to underst<strong>and</strong> the drivers of change, the geomorphic response<br />
to these drivers, <strong>and</strong> the potential feedbacks between physical, chemical, <strong>and</strong> biological<br />
components of the <strong>Arctic</strong> system.<br />
44
128. Rowl<strong>and</strong>, J.C., Travis, B.J., <strong>and</strong> Wilson, C.J., 2011, The role of advective heat<br />
transport in talik development beneath lakes <strong>and</strong> ponds in discontinuous permafrost:<br />
Geophysical Research Letters, v. 38, no. 17, p. L17504.<br />
This paper presents a model of sub-lake talik development in warm, discontinuous<br />
permafrost with <strong>and</strong> without advective heat transport. Advective heat transport is widely<br />
recognized as a critical component of permafrost degradation, but few studies have<br />
considered this. The model shows that stable permafrost thicknesses are 2–5 times greater<br />
in the absence of groundwater flow. Small variations in heat fluxes transmitted through a<br />
high hydraulic conductivity zone of the model had large effects on permafrost presence <strong>and</strong><br />
talik development.<br />
129. Rydberg, J., Klaminder, J., Rosén, P., <strong>and</strong> Bindler, R., 2010, Climate driven release of<br />
carbon <strong>and</strong> mercury from permafrost mires increases mercury loading to sub-arctic<br />
lakes: Science of the Total Environment, v. 408, no. 20, p. 4778–4783.<br />
This paper uses cores in peat <strong>and</strong> lakebed sediments to address the timing of mercury<br />
buildup in the environment, <strong>and</strong> the potential for this mercury to be released as permafrost<br />
thaws. Long-term changes in climate, permafrost, <strong>and</strong> mire dynamics can greatly affect the<br />
movement of mercury from the mires to the lakes. Significant variability in mercury<br />
movement rates were noted during the pre-industrial era, with higher rates associated with a<br />
warm period from the 1400s to mid-1500s. Present-day rates also were high. Similar studies<br />
should be conducted to observe spatial variability in these processes. Given that mercury is<br />
a neurotoxin that bioaccumulates in fish <strong>and</strong> humans, such studies are increasingly<br />
important as permafrost thaws <strong>and</strong> more mercury may be released from <strong>Arctic</strong> watersheds.<br />
130. Saalfeld, S.T., Lanctot, R.B., Brown, S.C., Saalfeld, D.T., Johnson, J.A., Andres, B.A.,<br />
<strong>and</strong> Bart, J.R., 2013, Predicting breeding shorebird distributions on the <strong>Arctic</strong> Coastal<br />
Plain of Alaska: Ecosphere, v. 4, no. 1, p. art16.<br />
This paper examines habitat relationships for eight species of shorebirds that commonly<br />
breed on the <strong>Arctic</strong> Coastal Plain, Alaska. Presence-only modeling approaches were used to<br />
identify suitable habitat <strong>and</strong> to map current distributions throughout the North Slope. For<br />
most species, habitat suitability increased at lower elevations (that is, near the coast <strong>and</strong><br />
river deltas) <strong>and</strong> decreased within upl<strong>and</strong> habitats. Models predicted that the most suitable<br />
habitat for most species was within the National Petroleum Reserve-Alaska, with additional<br />
suitable habitat within coastal areas of the <strong>Arctic</strong> National Wildlife Refuge west to Prudhoe<br />
Bay, Alaska.<br />
131. Sannel, A.B.K., <strong>and</strong> Brown, I.A., 2010, High-resolution remote sensing identification<br />
of thermokarst lake dynamics in a subarctic peat plateau complex: Canadian Journal<br />
of Remote Sensing, v. 36, no. S1, p. 26–40.<br />
This paper tests methods that could detect meter-scale changes in thermokarst lake extent<br />
using a time series of high-resolution imagery including aerial photographs <strong>and</strong> satellite<br />
imagery. Methods developed apply to various lake forms, locations, <strong>and</strong> data types.<br />
Traditional manual delineation of lake shorelines is subjective <strong>and</strong> time- <strong>and</strong> laborintensive.<br />
Semi-automatic remote sensing techniques were examined, including<br />
unsupervised <strong>and</strong> supervised classification <strong>and</strong> texture <strong>and</strong> high-pass filtering of imagery.<br />
All techniques failed testing <strong>and</strong> evaluation. The best method examined included multiple<br />
persons manually digitizing shorelines (plus-or-minus 1.5 m accuracy). This technique<br />
improved when the authors added binary encoding of transects perpendicular to the<br />
shoreline (plus-or-minus 0.6 m accuracy). High-resolution panchromatic images (both<br />
aerial photographs <strong>and</strong> satellite images) can be used to detect small-scale changes in lake<br />
45
extent on decadal time scales. When images are old or data quality is poor, manual<br />
delineation of shorelines provides the most accurate depiction. Semi-automatic<br />
classification underestimated water area in shallow lakes with aquatic vegetation, <strong>and</strong><br />
overestimated water area in heterogeneous, fen-rich l<strong>and</strong>scapes. Lakes surrounded by fens<br />
were the most difficult feature to classify.<br />
132. Sannel, A.B.K., <strong>and</strong> Kuhry, P., 2011, Warming-induced destabilization of peat<br />
plateau/thermokarst lake complexes: Journal of Geophysical Research, v. 116, no. G3,<br />
G03035.<br />
This paper uses aerial photography <strong>and</strong> satellite imagery to assess thaw-lake expansion <strong>and</strong><br />
infilling-drainage across a climatic <strong>and</strong> permafrost gradient. Rates of lake area change were<br />
compared to climate variables, <strong>and</strong> showed some correlation to mean annual air<br />
temperature. This study recognized a temperature threshold, beyond which these l<strong>and</strong>forms<br />
rapidly destabilize. This is currently occurring in the sporadic permafrost zone (mean<br />
annual air temperature of about -3°C), <strong>and</strong> will likely occur in the discontinuous<br />
permafrost zone over the next century.<br />
133. Schuur, E.A., Crummer, K.G., Vogel, J.G., <strong>and</strong> Mack, M.C., 2007, Plant species<br />
composition <strong>and</strong> productivity following permafrost thaw <strong>and</strong> thermokarst in Alaskan<br />
tundra: Ecosystems, v. 10, no. 2, p. 280–292.<br />
This paper presents research on the direct <strong>and</strong> indirect effects of permafrost degradation on<br />
plant species composition <strong>and</strong> productivity at three sites located near Healy, Alaska. The<br />
study area provided a natural gradient that ranged from undisturbed moist tundra to tundra<br />
with ice wedge degradation <strong>and</strong> permafrost thaw. The objectives of the study were to<br />
describe the changes in plant species composition <strong>and</strong> productivity that occurred as a result<br />
of permafrost degradation <strong>and</strong> to quantify changes in soil microclimate <strong>and</strong> nutrient<br />
availability. The authors observed that the sites experiencing permafrost thaw transitioned<br />
from graminoid tundra to shrub tundra <strong>and</strong> that soil nitrogen availability increased where<br />
permafrost thawed.<br />
134. Sellmann, P.V., Brown, J., Lewellen, R.I., McKim, H., <strong>and</strong> Merry, C., 1975, The<br />
classification <strong>and</strong> geomorphic implications of thaw lakes on the <strong>Arctic</strong> Coastal Plain,<br />
Alaska: U.S. Army Corps of Engineers, Cold Regions Research <strong>and</strong> Engineering<br />
Laboratory, Hanover, New Hampshire, Report No. CRREL RR-3244, 28 p.<br />
This report provides a regional classification of lakes on the <strong>Arctic</strong> Coastal Plain of<br />
northern Alaska using L<strong>and</strong>sat Multispectral Scanner (MSS) data. The authors divided the<br />
limnological l<strong>and</strong>scape by lake size, development of elongate axis, orientation of elongate<br />
axis, lake density, <strong>and</strong> topography. The authors also demonstrated the use of L<strong>and</strong>sat time<br />
series during the early summer to identify lake depth based on the timing associated with<br />
lake ice melt-out.<br />
46
135. Sharkhuu, A., Sharkhuu, N., Etzelmüller, B., Heggem, E.S.F., Nelson, F.E.,<br />
Shiklomanov, N.I., <strong>and</strong> Brown, J., 2007, <strong>Permafrost</strong> monitoring in the Hovsgol<br />
mountain region, Mongolia: Journal of Geophysical Research, v. 112, no. F2, F02S06.<br />
This paper considers the causes <strong>and</strong> consequences of thawing permafrost in the mountains<br />
of Mongolia. Borehole temperature data are provided to indicate increasing permafrost<br />
temperatures, <strong>and</strong> there is a discussion of how variations in rates <strong>and</strong> trends may be related<br />
to the subsurface material. Various l<strong>and</strong>scape features resulting from thawing permafrost<br />
also are discussed. The importance of both climate <strong>and</strong> anthropogenic factors in thawing<br />
permafrost are considered. Grazing is a major cause of permafrost thaw in this area, as<br />
shown by monitoring differences in temperature <strong>and</strong> thawing degree days in soils beneath<br />
grass, low <strong>and</strong> high shrubs, <strong>and</strong> mown plots.<br />
136. Shiklomanov, N.I., <strong>and</strong> Nelson, F.E., 2013, <strong>Thermokarst</strong> <strong>and</strong> civil infrastructure, in<br />
Shroder, J.F., <strong>and</strong> others, eds., Treatise on geomorphology, v. 8: San Diego, Academic<br />
Press, p. 354–373.<br />
This book chapter focuses on the physical processes that occur in the upper part of<br />
permafrost terrain, which includes the active layer, the transition layer, <strong>and</strong> the<br />
development of thermokarst. The authors conceptually outline the processes by which the<br />
genesis of associated l<strong>and</strong>forms <strong>and</strong> engineering problems that may result from permafrost<br />
degradation <strong>and</strong> thermokarst development can be understood. An overview is provided on<br />
the type <strong>and</strong> quantity of near-surface ground ice <strong>and</strong> the two major groups of thaw<br />
processes: those related to erosion <strong>and</strong> those related to ground subsidence or top-down thaw<br />
of permafrost. The formation of thermokarst l<strong>and</strong>forms are placed in the context of the<br />
unique engineering problems encountered in permafrost regions.<br />
137. Short, N., Brisco, B., Couture, N., Pollard, W., Murnaghan, K., <strong>and</strong> Budkewitsch, P.,<br />
2011, A comparison of TerraSAR-X, RADARSAT-2 <strong>and</strong> ALOS-PALSAR<br />
interferometry for monitoring permafrost environments, case study from Herschel<br />
Isl<strong>and</strong>, Canada: Remote Sensing of Environment, v. 115, no. 12, p. 3491–3506.<br />
This paper compares the ability of interferometric synthetic aperture radar (InSAR) datasets<br />
derived from TerraSAR-X (X-b<strong>and</strong> radar), Radarsat-2 (C-b<strong>and</strong> radar), <strong>and</strong> ALOS-PALSAR<br />
(L-b<strong>and</strong> radar) for detecting ground movement at a continuous permafrost site located on<br />
Herschel Isl<strong>and</strong>, Canada. All sensors were capable of maintaining coherence during a<br />
particular summer; however, the ALOS-PALSAR proved to be best at maintaining<br />
coherence over multiple years. This is a result of the longer wavelength <strong>and</strong> greater<br />
penetration of vegetative cover of the L-b<strong>and</strong> synthetic aperture radar (SAR), which has<br />
proven to be much better at maintaining coherence over permafrost environments. The<br />
ability to monitor vertical displacement over multiple years offers the most promise for<br />
permafrost studies. The authors also tried to target the many thaw slumps on Herschel<br />
Isl<strong>and</strong>. They determined that InSAR was not a suitable tool for monitoring these features<br />
owing to their size, their large <strong>and</strong> abrupt movement, radar look angles, <strong>and</strong> disintegration<br />
<strong>and</strong> collapse of slump features. Based primarily on the PASLAR interferograms, the<br />
authors noted a narrow b<strong>and</strong> of displacement of 20–30 cm/yr on the northern part of<br />
Herschel Isl<strong>and</strong> from 2007 to 2010 that is believed to be associated with coastal erosion <strong>and</strong><br />
slope instability. InSAR is capable of identifying broad areas of subtle subsidence in gentle<br />
relief, areas of terrain instability, possibly owing to permafrost thaw or ground-ice melt <strong>and</strong><br />
the removal of water volume, <strong>and</strong> prior to significant slumping.<br />
47
138. Shur, Y.L., <strong>and</strong> Jorgenson, M.T,. 2007, Patterns of permafrost formation <strong>and</strong><br />
degradation in relation to climate <strong>and</strong> ecosystems: <strong>Permafrost</strong> <strong>and</strong> Periglacial<br />
Processes, v. 18, no. 1, p. 7–19.<br />
This paper presents a classification system for describing the complex interaction of climate<br />
<strong>and</strong> ecological processes on permafrost formation <strong>and</strong> degradation. Five types of permafrost<br />
were distinguished: (1) climate-driven; (2) climate-driven, ecosystem-modified; (3)<br />
climate-driven, ecosystem protected; (4) ecosystem-driven; <strong>and</strong> (5) ecosystem-protected.<br />
Climate-driven permafrost forms under modern-day climatic conditions in recently exposed<br />
l<strong>and</strong> surfaces <strong>and</strong> primarily occurs in the continuous permafrost zone. Climate-driven,<br />
ecosystem-modified permafrost occurs in the continuous permafrost zone when vegetation<br />
succession <strong>and</strong> organic-matter accumulation lead to development of an ice-rich layer at the<br />
top of the permafrost. Climate-driven, ecosystem-protected permafrost refers to permafrost<br />
currently located in the discontinuous permafrost that initially formed as climate-driven but<br />
its stability is now a result of overlying vegetation <strong>and</strong> organic material. If this permafrost<br />
thaws, it cannot be reestablished under current climatic conditions. Ecosystem-driven<br />
permafrost forms in the discontinuous permafrost zone in poorly drained, low-lying <strong>and</strong><br />
north-facing l<strong>and</strong>scape conditions, <strong>and</strong> under strong ecosystem influence. Finally,<br />
ecosystem-protected permafrost persists as sporadic patches in warmer climates, but cannot<br />
be reestablished after disturbance. These distinctions are important because these five<br />
permafrost types react differently to disturbance <strong>and</strong> climate change.<br />
139. Shur, Y.L., <strong>and</strong> Osterkamp, T.E., 2007, <strong>Thermokarst</strong>: Fairbanks, University of Alaska<br />
Fairbanks, Institute of Northern Engineering, Rep. INE06.11, 50 p.<br />
This comprehensive report on thermokarst details the history associated with the term,<br />
essential conditions for thermokarst development, causes of thermokarst, development of<br />
thermokarst, <strong>and</strong> a focus on thermokarst lake development <strong>and</strong> enlargement. Discussion of<br />
the essential conditions for thermokarst development distinguishes between permafrost<br />
conditions (ground ice, method of permafrost formation, structures in permafrost,<br />
distribution of ice in permafrost, thaw strain) <strong>and</strong> thermal conditions (air versus soil<br />
climate, heat balance, <strong>and</strong> so on). The causes of thermokarst development are divided into<br />
large scale (climatic) or small scale (local disturbance). The development of thermokarst<br />
usually occurs as a result of (1) thaw subsidence of the upper permafrost owing to an<br />
increase in active-layer depth after surface modification, (2) thaw subsidence of the upper<br />
permafrost owing to water accumulation on the soil surface accompanied by an increase in<br />
active layer thickness, (3) permafrost degradation with retreat of the permafrost table, <strong>and</strong><br />
(or) (4) enlargement by thermal subsidence <strong>and</strong> thermal erosion of lakes that were<br />
originally formed by processes unrelated to thermokarst. This paper contains many<br />
equations, tables, <strong>and</strong> graphics showing the various conditions <strong>and</strong> stages of thermokarst<br />
development. The section on the enlargement of thermokarst lakes contains many<br />
references related to thermokarst lake expansion rates. Most of the report is based on the<br />
Russian-language literature in an effort to make this material <strong>and</strong> these ideas accessible to<br />
English-speaking readers.<br />
140. Sjöberg, Y., Hugelius, G., <strong>and</strong> Kuhry, P., 2013, <strong>Thermokarst</strong> lake morphometry <strong>and</strong><br />
erosion features in two peat plateau areas of northeast European Russia: <strong>Permafrost</strong><br />
<strong>and</strong> Periglacial Processes, v. 24, p. 75–81.<br />
This paper compares physical lake characteristics relevant to erosion, sediment type, <strong>and</strong><br />
orientation in two lowl<strong>and</strong> peat plateaus in western Russia. Shoreline steepness, cracks, <strong>and</strong><br />
depth were greater on shorelines facing northeast <strong>and</strong> southeast, <strong>and</strong> on shorelines of larger<br />
lakes. Lakes in peat substrate showed greater variability in steepness, cracks, <strong>and</strong> water<br />
48
depths. The lakes showed some orientation, but not as great as has been witnessed in other<br />
thermokarst lakes, which the authors attribute to a more heterogeneous substrate <strong>and</strong> the<br />
importance of secondary erosional factors such as snowdrifts. Larger lakes showed signs of<br />
heavier erosion, but erosion also is important on smaller lakes because it affects a greater<br />
proportion of the peat plateau.<br />
141. Smith, M.W., <strong>and</strong> Riseborough, D.W., 1996, <strong>Permafrost</strong> monitoring <strong>and</strong> detection of<br />
climate change: <strong>Permafrost</strong> <strong>and</strong> Periglacial Processes, v. 7, no. 4, p. 301–309.<br />
This paper develops a climate-permafrost model to determine the factors that control<br />
temperature at the top of the permafrost. The authors show that permafrost temperature<br />
monitoring may be confounded by variations in local surface <strong>and</strong> lithologic conditions, <strong>and</strong><br />
by the annual air temperature regime. The authors suggest that temperature monitoring<br />
should be concentrated at the permafrost table that active-layer depth is not necessarily an<br />
indicator of changes in the temperature of permafrost, <strong>and</strong> that monitoring at exposed<br />
bedrock will produce the most direct signal of climate <strong>and</strong> ground thermal regime.<br />
142. Smith, S.L., Romanovsky, V.E., Lewkowicz, A.G., Burn, C.R., Allard, M., Clow, G.D.,<br />
<strong>and</strong> Throop, J,. 2010, Thermal state of permafrost in North America—A contribution<br />
to the International Polar Year: <strong>Permafrost</strong> <strong>and</strong> Periglacial Processes, v. 21, no. 2,<br />
p. 117–135.<br />
This paper presents results from 350 permafrost boreholes in North America. <strong>Permafrost</strong><br />
has been warming since the 1970s in the western <strong>Arctic</strong> <strong>and</strong> since the 1990s in eastern<br />
Canada. The rates of ground warming are variable but tend to be greatest in the tundra<br />
regions.<br />
143. Stieglitz, M., Déry, S.J., Romanovsky, V.E., <strong>and</strong> Osterkamp, T.E., 2003, The role of<br />
snow cover in the warming of arctic permafrost: Geophysical Research Letters, v. 30,<br />
no. 13.<br />
This paper highlights the role of snow cover on the permafrost thermal regime. Through the<br />
use of modeling, the authors showed that snow cover variability can affect the temperature<br />
of permafrost as much as near-surface air temperature. Trends in permafrost temperature in<br />
northern Alaska from 1983 to 1998 can be explained primarily by variability in snow cover.<br />
144. Suttle, K.B., Power, M.E., Levine, J.M., <strong>and</strong> McNeely, C., 2004, How fine sediment in<br />
riverbeds impairs growth <strong>and</strong> survival of juvenile salmonids: Ecological Applications,<br />
v. 14, no. 4, p. 969–974.<br />
This paper experimentally increased fine sediment loading into northern California rivers<br />
<strong>and</strong> examined subsequent effects on juvenile salmonids <strong>and</strong> supporting food webs.<br />
Increased fine sediment decreased growth <strong>and</strong> survival of juvenile steelhead trout, <strong>and</strong><br />
decreases were associated with a shift in invertebrates toward burrowing taxa unavailable as<br />
prey <strong>and</strong> increased steelhead activity <strong>and</strong> injury at higher levels of fine sediment. Growth<br />
decreased from about 0.23 mm/d in areas of no fine sediment to about 0.06 mm/d in areas<br />
with 100 percent embedded substrate. The results suggested that there is no threshold below<br />
which exacerbation of fine-sediment <strong>and</strong> storage in gravel-bedded rivers is harmless, but<br />
that any reduction in fine sediment loading could immediately benefit salmonids.<br />
49
145. Swanson, D.K., 1996, Susceptibility of permafrost soils to deep thaw after forest fires<br />
in interior Alaska, USA, <strong>and</strong> some ecologic implications: <strong>Arctic</strong> <strong>and</strong> Alpine Research,<br />
p. 217–227.<br />
This study analyzes vegetation <strong>and</strong> soil data from many burned <strong>and</strong> unburned (no fire in<br />
more than 100 years) sites in the Kobuk Preserve in interior Alaska. Burned sites were<br />
divided into three groups: frozen, thawed, or dry, depending on their pre- <strong>and</strong> post-fire<br />
state. These three categories had distinctly different soil properties. Frozen soils had much<br />
larger organic layers, <strong>and</strong> often mineral soils could not be detected. Dry sites had a thinner<br />
loamy surface layer compared to thawed sites. The data indicated that many wet soils do<br />
not thaw <strong>and</strong> become drier following fire, <strong>and</strong> that these sites tend to occur on concave,<br />
lower-slope positions <strong>and</strong> on northerly slope aspects. Convex, higher-slope positions <strong>and</strong><br />
soils with a thin layer of loamy surface material likely remain dry <strong>and</strong> permafrost-free,<br />
regardless of the amount of time elapsed since fire. Post-fire vegetation changes were<br />
greatest on soils that thaw deeply, leading to more cover <strong>and</strong> forage for voles.<br />
146. Swanson, D.K., 2010, Mapping of erosion features related to thaw of permafrost in<br />
Bering L<strong>and</strong> Bridge National Preserve, Cape Krusenstern National Monument, <strong>and</strong><br />
Kobuk National Park: National Park Service, Fort Collins, Colorado, Natural<br />
Resource Data Series NPS/ARCN/NRDS—2010/122, 18 p.<br />
This report presents results on the survey of active-layer detachment slides <strong>and</strong> thaw slumps<br />
in northwestern Alaska using high-resolution satellite imagery acquired from 2006 to 2008.<br />
There were a total of 58 detachment slides covering an area of 6 ha, <strong>and</strong> no reported thaw<br />
slumps in the study area.<br />
147. Swanson, D.K., 2012, Mapping of erosion features related to thaw of permafrost in the<br />
Noatak National Preserve, Alaska: National Park Service, Fort Collins, Colorado.<br />
Natural Resource Data Series NPS/ARCN/NRDS—2012/248, 28 p.<br />
This report presents results on the survey of active-layer detachment slides <strong>and</strong> thaw slumps<br />
in northwestern Alaska using high-resolution satellite imagery acquired from 2006 to 2008.<br />
There were a total of 848 detachment slides covering an area of 103 ha, most commonly on<br />
well vegetated, moderate slopes (average slope 16 percent) with a southwest aspect. A total<br />
of 276 thaw slumps were mapped covering an area of 90 ha. These features primarily occur<br />
on thick Pleistocene sediments (mainly glacial till <strong>and</strong> glacial lake deposits), primarily<br />
along rivers <strong>and</strong> lakes, though some occur in upl<strong>and</strong>s away from water.<br />
148. Swanson, D.K., 2012, <strong>Monitoring</strong> of retrogressive thaw slumps in the <strong>Arctic</strong> Network,<br />
2011—Three-dimensional modeling of l<strong>and</strong>form change: National Park Service, Fort<br />
Collins, Colorado, Natural Resource Report NPS/ARCN/NRDS—2012/247, 60 p.<br />
This report presents results on a novel technique for monitoring retrogressive thaw slump<br />
dynamics in northwestern Alaska. Twenty-six thaw slumps were imaged in 2010 <strong>and</strong> again<br />
in 2011 using a h<strong>and</strong>-held 35-mm digital camera. The photographs were registered to<br />
features on the ground <strong>and</strong> used to create high-resolution, three-dimensional topographic<br />
models for change-detection analysis. The change in thaw-slump area ranged from<br />
negligible to about 1 ha between the 2 years. Headwall-retreat rates were less than 5 m in<br />
some cases but as much as 20 m in other cases. In the most active slump, the volume of<br />
subsidence was 30,000 m 3 .<br />
50
149. Thienpont, J.R., R hl<strong>and</strong>, K.M., Pisaric, M.F., Kokelj, S.V., Kimpe, L.E., Blais, J.M.,<br />
<strong>and</strong> Smol, J.P., 2013, Biological responses to permafrost thaw slumping in Canadian<br />
<strong>Arctic</strong> lakes: Freshwater Biology, p. 58, no. 2, p. 337–353.<br />
This paper uses a diatom-based palaeolimnological approach to examine the impact of<br />
retrogressive thaw slumps on freshwater ecosystems in the low <strong>Arctic</strong> of western Canada.<br />
Sediment cores were collected from the center of several lakes during 2007–2008 using a<br />
Glew-type gravity corer. Sediments were aged using lead-210 <strong>and</strong> cesium-137<br />
radioisotopes <strong>and</strong> gamma dating. Sedimentary siliceous subfossils were analyzed to<br />
examine diatom abundance <strong>and</strong> composition. Affected <strong>and</strong> reference lakes were paired, <strong>and</strong><br />
all of them showed biological changes over the last 200 years. Most reference sites showed<br />
an increase in the relative abundance of planktonic algal taxa beginning around 1900,<br />
consistent with increased temperature trends in the region. Thaw slump-affected lakes<br />
recorded increases in the abundance <strong>and</strong> diversity of periphytic diatoms around the time of<br />
slump initiation, consistent with increased water clarity <strong>and</strong> subsequent development of<br />
aquatic macrophyte communities. Additionally, all lakes showed a decrease in the relative<br />
abundance of benthic fragilarioid taxa correlated with local air temperature. Slump-affected<br />
lakes generally showed lower nutrient levels, except at a lake that had a slump as a result of<br />
an intense fire.<br />
150. Tondu, J.M., 2012, An interdisciplinary approach to monitoring the hydroecology of<br />
thermokarst lakes in Old Crow Flats, Yukon Territory, Canada: Waterloo, Canada,<br />
University of Waterloo, thesis.<br />
This thesis explains, in detail, methods for monitoring hydroecology of thermokarst lakes in<br />
Old Crow Flats, Yukon Territories, Canada. Water samples for analysis of hydrogen <strong>and</strong><br />
oxygen isotope composition <strong>and</strong> chemistry (that is, ions <strong>and</strong> nutrients) were collected to<br />
track hydrological <strong>and</strong> limnological conditions. Artificial substrates were deployed in June<br />
<strong>and</strong> accrued algae were collected at the end of the ice-free season to assess community<br />
composition <strong>and</strong> abundance. Sediment coring was done in a culturally significant lake<br />
(Zelma Lake–OCF06) to reconstruct long-term baseline hydroecological conditions over<br />
the past three centuries. Radiometric dating techniques (cesium-137, lead-210) were used to<br />
develop a sediment core chronology. Baseline hydroecological conditions were<br />
reconstructed through analyses of loss-on-ignition, bulk organic carbon <strong>and</strong> nitrogen<br />
elemental <strong>and</strong> isotope compositions, <strong>and</strong> pigments. Meteorological data <strong>and</strong> a multi-year<br />
evaporation pan experiment were used to develop a robust isotope framework, which<br />
provides the basis for interpreting five years (2007–11) of lake water isotope measurements<br />
<strong>and</strong> deriving knowledge of hydrological conditions for the monitoring lakes. Three lakes<br />
showed a potential transition from snowmelt-sourced to rainfall-sourced isotope-based<br />
hydrologic regimes. Three lakes showed signs of being evaporation-dominated with<br />
positive water balances, <strong>and</strong> three lakes were evaporation-dominated with negative water<br />
balances. A multi-proxy paleolimnology analysis showed that lake conditions were stable<br />
until about 1900, then thermokarst exp<strong>and</strong>ed with a reduction in productivity until about<br />
1943, <strong>and</strong> most recently Zelda Lake showed increased productivity <strong>and</strong> rapid drainage. The<br />
monitoring methods in this thesis already have been implemented by Parks Canada as a<br />
long-term hydroecological monitoring program for the Old Crow Flats area.<br />
51
151. Toniolo, H., Kodial, P., Hinzman, L.D., <strong>and</strong> Yoshikawa, K., 2009, Spatio-temporal<br />
evolution of a thermokarst in interior Alaska: Cold Regions Science <strong>and</strong> Technology,<br />
v. 56, no. 1, p. 39–49.<br />
This paper describes the rapid development of a thermokarst gully in interior Alaska over a<br />
two year period with a focus on the role of sediment transport <strong>and</strong> its associated<br />
geomorphological processes. The study combined the use of fieldwork <strong>and</strong> laboratory<br />
work. Fieldwork consisted of topographical surveys, discharge measurements, systematic<br />
water sampling, <strong>and</strong> abundant visual documentation of morphologic changes through<br />
digital photographs. Laboratory work mainly consisted of water-sample analyses to obtain<br />
suspended-solid concentration <strong>and</strong> suspended sediment grain-size distribution. The<br />
processes responsible for the rapid development of the features consisted of fluvio-thermal<br />
erosion <strong>and</strong> cryogenic piping. Headward erosion of the gully was 3.5 m/yr during the study<br />
period, <strong>and</strong> lateral slumping of the gully walls was 0.5 m/yr. Active sedimentation from the<br />
thermokarst has led to initial infilling of a pond in the drainage. Because groundwater flow<br />
in the study site was determined to be an important part of the accelerated thermokarst<br />
growth, future work should examine more closely the subsurface flow network.<br />
152. Tsuyuzaki, S., Ishazaki, T., <strong>and</strong> Sato, T., 1999, Vegetation structure in gullies<br />
developed by the melting of ice wedges along Kolyma River, northern Siberia:<br />
Ecological Research, v. 14, no. 4, p. 385–391.<br />
This paper examined the relationship between thermokarst gully characteristics <strong>and</strong><br />
vegetation communities in northern Siberia, Russia. The authors surveyed 5–10 r<strong>and</strong>omly<br />
selected plots within each gully. Height, width, <strong>and</strong> slope of each gully were measured with<br />
a transit compass <strong>and</strong> soil moisture <strong>and</strong> pH was tested using a portable soil tester. Soil<br />
compaction was tested at five points in each plot using a soil hardness tester. Percent cover<br />
of each plant species was visually estimated. In gullies surveyed, about 50 percent of the<br />
area was vegetated. Cluster analysis revealed four vegetation community types: (1)<br />
flixweed (Descurainia sophia)-dominated grassl<strong>and</strong>, (2) chamomile (Matricaria<br />
matricarioides)-dominated forbl<strong>and</strong>, (3) purple dropseed (Agrostis purpurascens)-<br />
dominated grassl<strong>and</strong> with fire moss (Ceratodon purpureus) carpet, <strong>and</strong> (4) fireweed<br />
(Chamaenerium angustifolium)- <strong>and</strong> chamomile-dominated forbl<strong>and</strong>. Gully height, width,<br />
<strong>and</strong> elevational differences influenced dominant vegetation types. The authors determined<br />
that these differences were mediated by the influence of gully height on soil pH <strong>and</strong><br />
compaction <strong>and</strong> soil stability, which then influenced vegetation establishment. Dominant<br />
species were all long-distance dispersers, <strong>and</strong> the authors suggested revegetation of<br />
thermokarst features such as gullies favor species with long-distance dispersal mechanisms.<br />
Soil moisture was positively associated with soil pH <strong>and</strong> soil compaction. Steep slopes were<br />
composed of softer soils that is., less compact <strong>and</strong> stable). Flixweed was established in<br />
large gullies, while common horsetail (Equisetum arvense) <strong>and</strong> feltleaf willow (Salix<br />
alaxensis) was established in small gullies. Siberian dock (Rumex sibericus) were not<br />
established on compact soils, where fire moss was common. Fireweed <strong>and</strong> chamomile were<br />
not established on small gullies with soft soil <strong>and</strong> low soil pH.<br />
153. Tsuyuzaki, S., Sawada, Y., Kushida, K., <strong>and</strong> Fukuda, M., 2008, A preliminary report<br />
on the vegetation zonation of palsas in the <strong>Arctic</strong> National Wildlife Refuge, northern<br />
Alaska, USA: Ecological Research, v. 23, no. 4, p. 787–793.<br />
Vegetation, hydrologic parameters, <strong>and</strong> wildlife activity were monitored on 3 palsas.<br />
Vegetation zonation was observed to depend on water levels, with Vaccinium vitis-idaea on<br />
the top (drier part) of the palsas, Carex aquatilis near the bottom (wetter part) of the palsas,<br />
<strong>and</strong> Sphagnum spp. Significant autocorrelation was noted between the measured variables.<br />
52
154. Ugolini, F.C., 1975, Ice-rafted sediments as a cause of some thermokarst lakes in the<br />
Noatak River Delta, Alaska: New York, Science, v. 188, no. 4183 , p. 51-52.<br />
This paper describes the formation of thermokarst lakes as a result of ice-rafted sediment<br />
for a 7-km 2 area on the western part of the Noatak River Delta. This mechanism depends on<br />
the freezing of shallow lakes <strong>and</strong> channels to their bed <strong>and</strong> the incorporation of bottom<br />
sediments into the ice. During spring break-up or during fall storms, when sediment-rich ice<br />
bodies can migrate onto the l<strong>and</strong>scape, this dirty ice is deposited. Following melt of the<br />
rafted ice deposits, the sediments that were entrained melt out <strong>and</strong> change the surface<br />
albedo <strong>and</strong> the thermal regime of the underlying soil promoting thaw <strong>and</strong> formation of<br />
thermokarst ponds. The entire sequence of the formation of thermokarst ponds through<br />
these processes has not been observed.<br />
155. Ulrich, M., Morgenstern, A., Günther, F., Reiss, D., Bauch, K.E., Hauber, E., <strong>and</strong><br />
Schirrmeister, L., 2010, <strong>Thermokarst</strong> in Siberian ice‐rich permafrost—Comparison to<br />
asymmetric scalloped depressions on Mars: Journal of Geophysical Research—<br />
Planets (1991–2012), v. 115, no. E10.<br />
This paper analyses a thermokarst depression in ice-rich Siberian yedoma deposits in the<br />
Lena river delta <strong>and</strong> compares results with remote sensing data from Martian surfaces. In<br />
Siberia, the authors did field studies on the morphometry of the thermokarst basin,<br />
described ground ice <strong>and</strong> lithologic compositions, <strong>and</strong> later did a GIS-based analysis of<br />
slope characteristics <strong>and</strong> a solar-insolation analysis to identify drivers of lateral thermokarst<br />
development in the basin. Fieldwork was done using a Zeiss ELTA C30 tachymeter, <strong>and</strong><br />
multiple days were spent surveying the thermokarst basin in great detail to construct a<br />
digital elevation model. Vegetation, active layer, micro <strong>and</strong> mesorelief, <strong>and</strong> hydrological<br />
conditions were mapped further. Additionally, a pyranometer was used to quantify<br />
downwelling shortwave solar radiation. ArcGIS was used for the digital elevation model<br />
(DEM) creation <strong>and</strong> the solar insolation analysis. Modeled solar insolation also was<br />
compared to remote-sensed thermal data from L<strong>and</strong>st-7 Enhanced Thematic Mapper Plus<br />
(ETM+). The authors concluded from their analysis that the thermokarst basin <strong>and</strong> the lake<br />
located in the basin are exp<strong>and</strong>ing laterally northward.<br />
156. van Everdingen, Robert, ed., 1998 (revised May 2005), Multi-language glossary of<br />
permafrost <strong>and</strong> related ground-ice terms: Boulder, Colorado, National Snow <strong>and</strong> Ice<br />
Data Center, p. 1-46.<br />
This reference provides the most comprehensive index of permafrost- <strong>and</strong> ground-icerelated<br />
terminology. It can be accessed on the internet through the National Snow <strong>and</strong> Ice<br />
Data Center (NSIDC).<br />
157. Vincent, W.F., Callaghan, T.V., Dahl-Jensen, D., Johansson, M., Kovacs, K.M.,<br />
Michel, C., <strong>and</strong> Sharp, M., 2011, Ecological implications of changes in the <strong>Arctic</strong><br />
cryosphere: Ambio, v. 40, no. 1, p. 87–99.<br />
This paper is condensed from the ecology synthesis chapter of the Snow, Water, Ice,<br />
<strong>Permafrost</strong> in the <strong>Arctic</strong> (SWIPA) project of the <strong>Arctic</strong> <strong>Monitoring</strong> <strong>and</strong> Assessment<br />
Program. An overview is presented of how climate-dependent alterations in snow, water,<br />
ice, <strong>and</strong> permafrost are affecting, <strong>and</strong> will increasingly affect, the ecology of the <strong>Arctic</strong>,<br />
including potential effects from the linkages between ecosystems.<br />
53
158. Walker, D.A., Jia, G.J., Epstein, H.E., Raynolds, M.K., Chapin Iii, F.S., Copass, C.,<br />
<strong>and</strong> Shiklomanov, N., 2003, Vegetation‐soil‐thaw‐depth relationships along a<br />
low‐arctic bioclimate gradient, Alaska—Synthesis of information from the ATLAS<br />
studies: <strong>Permafrost</strong> <strong>and</strong> Periglacial Processes, v. 14, no. 2, p. 103–123.<br />
This paper examines the interactions between summer warmth, vegetation, <strong>and</strong> thaw at 17<br />
sites in three bioclimate subzones of the <strong>Arctic</strong> Slope <strong>and</strong> Seward Peninsula. Ground ice<br />
state is balanced by thawing related to warm air temperatures <strong>and</strong> freezing related to<br />
insulation by dense plant canopies. Warmer temperatures on a latitudinal gradient did not<br />
increase tussock tundra biomass as much as might be expected, indicating that growth is<br />
limited more by cold, wet soils than by air temperatures. The authors suggested that<br />
warming will not necessarily lead to thicker active layers because of the potential for<br />
additional insulation by growing plants. Soil pH also was found to influence plant<br />
production, with shallower thaw depths associated with acidic tundra.<br />
159. Walker, J., Arnborg, L., <strong>and</strong> Peippo, J., 1987, Riverbank erosion in the Colville Delta,<br />
Alaska: Geografiska Annaler—Series A—Physical Geography, p. 61–70.<br />
This paper summarizes the erosion rates of the Colville River Delta, Alaska. The delta is ice<br />
covered for more than 8 months a year, <strong>and</strong> is subjected to high discharge rates <strong>and</strong> periodic<br />
flooding events during ice break-up each year. Bank erosion is likely to occur along as<br />
much as 60 percent of the banks of the main river channels during the 3–4-week ice breakup<br />
period. Erosion is the result of hydromechanical <strong>and</strong> thermal impact of water as well as<br />
other factors including bank composition <strong>and</strong> height, snow <strong>and</strong> ice cover, stage <strong>and</strong> velocity<br />
of discharge, air <strong>and</strong> water temperature, <strong>and</strong> wind. Thermo-erosional niches form <strong>and</strong> large<br />
blocks break off into the river. The banks were measured during irregular time periods from<br />
1961 to 1987. Echosounding traces were used to monitor the shifting of the channel <strong>and</strong><br />
changes in channel form. Stakes were placed 25 or 50 ft from the bluff edge to measure<br />
erosion rates. During one particular year, erosion ranged from 0 to 10.9 m. Over a five year<br />
period, two stakes had been destroyed by erosion, three stakes were found over the bluff<br />
edge, <strong>and</strong> two stakes were missing. Most erosional banks were peat (75 percent), followed<br />
by laminated silts (15 percent); gubik silts, s<strong>and</strong>s, <strong>and</strong> gravels (7 percent); <strong>and</strong> s<strong>and</strong> dunes<br />
(3 percent). Average erosion rates may have been as much as 4 m per year, but rarely<br />
exceeded 3 m per year, although there was high spatial <strong>and</strong> temporal variability. Block<br />
collapse can result in as much as 12 m of instantaneous retreat. The rate of break-up affects<br />
erosion rates; fast break-up may result in faster erosion rates.<br />
160. Wallace, R.E., 1948, Cave-in lakes in the Nabesna, Chisana, <strong>and</strong> Tanana River valleys,<br />
eastern Alaska: The Journal of Geology, p. 171–181.<br />
This paper attempts to identify the causes of thermokarst (that is, cave-in) lakes. The<br />
importance of vegetation as an insulator <strong>and</strong> of vegetation loss as the first step beginning<br />
the thermokarst process are recognized. <strong>Thermokarst</strong> lakes occur predominately in finegrained<br />
sediments <strong>and</strong> not coarser materials. The authors created a conceptual sequence of<br />
thaw lake development with four ages: youthful, early mature, late mature, <strong>and</strong> old. Tilted<br />
<strong>and</strong> drowned trees were recognized as indicators of bank recession <strong>and</strong> as a mechanism for<br />
calculating lake expansion rates.<br />
54
161. West, J.J., <strong>and</strong> Plug, L.J., 2008, Time-dependent morphology of thaw lakes <strong>and</strong> taliks<br />
in deep <strong>and</strong> shallow ground ice: Journal of Geophysical Research, v. 113, no. F1,<br />
p. 1–14, F01009.<br />
This paper examines the shape <strong>and</strong> depth of thaw-lake basins in relation to lake age <strong>and</strong><br />
stability of the talik. A numerical model was used for conductive heat transfer, phase<br />
change, <strong>and</strong> thaw subsidence of ice-rich sediment beneath a lake to estimate lake age. For<br />
lakes of all topography <strong>and</strong> ground-ice variations, first-generation lakes in deep ground ice<br />
are rounder <strong>and</strong> grow larger in area than later-generation lakes. Lake depth increases with<br />
about the square root of time in permafrost with a deep layer of excess ice. Large-diameter<br />
basins in icy permafrost are predicted to require about 5,000 years to reach depths of 20 m.<br />
A 1°C increase in lake-bottom temperature beyond the 3°C increase predicted in this<br />
climate model would increase the deepening rate of large lakes to 20 m in about 3,500<br />
years. In contrast, lakes in permafrost with shallow epigenetic ground ice have depths that<br />
are independent of lake age. For these lakes, a steady-state depth is achieved within 100<br />
years.<br />
162. White, D., Hinzman, L., Alessa, L., Cassano, J., Chambers, M., Falkner, K., Francis,<br />
J., Gutowski, W.J., Holl<strong>and</strong>, M., Holmes, R.M., Huntington, H., Kane, D., Kliskey, A.,<br />
Lee, C., McClell<strong>and</strong>, J., Peterson, B., Rupp, T.S., Staneo, F., Steele, M., Woodgate, R.,<br />
Yang, D., Yoshikawa, K., <strong>and</strong> Zhang, T., 2007, The arctic freshwater system—<br />
Changes <strong>and</strong> impacts: Journal of Geophysical Research, v. 112, no. G4, G04S54.<br />
This paper reviews the effects of climate change on the <strong>Arctic</strong> freshwater system during the<br />
last century. It focuses on terrestrial, atmospheric, <strong>and</strong> oceanic systems. On l<strong>and</strong>,<br />
precipitation <strong>and</strong> river discharge, lake abundance <strong>and</strong> size, glacier area <strong>and</strong> volume, soil<br />
moisture, <strong>and</strong> a variety of permafrost characteristics have changed. In the ocean, sea ice<br />
thickness <strong>and</strong> areal coverage have decreased <strong>and</strong> water mass circulation patterns have<br />
shifted, changing freshwater pathways <strong>and</strong> sea ice cover dynamics. Precipitation onto the<br />
ocean surface also has changed. Warming permafrost <strong>and</strong> subsequent thermokarst events<br />
are intimately tied to changes in terrestrial freshwater cycles. River discharge may change<br />
in ways not predictable from precipitation <strong>and</strong> evapotranspiration alone owing to changes in<br />
storage. Lakes may be expected to appear <strong>and</strong> grow in areas of continuous permafrost,<br />
while shrinking <strong>and</strong> disappearing in more degraded permafrost. A deeper active layer will<br />
have the capacity to attenuate peak flows of runoff owing to increased storage, <strong>and</strong><br />
thermokarst geomorphology will create more heterogeneity in soil moisture, leading to<br />
ponding in some areas but drying in other areas. Complex feedbacks are expected, such as<br />
conditions more conducive to fire, which then lowers albedo <strong>and</strong> initially increases soil<br />
moisture.<br />
55
163. Wollschläger, U., Gerhards, H., Yu, Q., <strong>and</strong> Roth, K., 2010, Multi-channel groundpenetrating<br />
radar to explore spatial variations in thaw depth <strong>and</strong> moisture content in<br />
the active layer of a permafrost site: The Cryosphere, v. 4, no. 3, p. 269–283.<br />
This paper describes the use of multi-channel ground-penetrating radar (GPR) for<br />
measuring the active-layer thickness <strong>and</strong> moisture content at a continuous permafrost site<br />
on the Tibetan Plateau. Surveys were conducted on a grid that measured 85-by-60 m using<br />
three 200-megahertz antennas connected in a multi-channel configuration that allows for<br />
the simultaneous measure of travel time from many different antenna separations, which<br />
improves the ability to accurately measure target depths <strong>and</strong> soil moisture content. This<br />
configuration is an operational technology for efficiently studying surface permafrost<br />
dynamics at scales varying from a few meters to a few kilometers, <strong>and</strong> the multi-channel<br />
GPR technique efficiently covers the intermediate scales between traditional point<br />
measurements <strong>and</strong> space-based remote sensing.<br />
164. Yang, Z.P., Ou, Y.H., Xu, X.L., Zhao, L., Song, M.H., <strong>and</strong> Zhou, C.P., 2010, Effects of<br />
permafrost degradation on ecosystems: Acta Ecologica Sinica, v. 30, no. 1, p. 33–39.<br />
This paper reviews the effects of permafrost degradation on ecosystem structure <strong>and</strong><br />
function, focusing primarily on research conducted on the Qinghai-Tibet Plateau, China.<br />
<strong>Permafrost</strong> degradation alters the water-heat process of soil, which leads to changes in<br />
vegetation species composition <strong>and</strong> community succession, <strong>and</strong> further ecosystem<br />
degradation. Additionally, degradation affects soil nutrient availability, <strong>and</strong> carbon storage<br />
in the <strong>Arctic</strong> <strong>and</strong> the Subarctic. <strong>Permafrost</strong> degradation may lead to improved soil drainage<br />
<strong>and</strong> active-layer depth, which are important controlling factors of vegetation growth <strong>and</strong><br />
distribution. In Alaska, drier soils facilitated encroachment of shrubs <strong>and</strong> woody vegetation<br />
into tundra ecosystems. In the upl<strong>and</strong>s of China, permafrost degradation led to increases in<br />
weedy vegetation <strong>and</strong> shifted from wet to drought-tolerant plant species, leading to a shift<br />
from a mesophyte-dominated alpine meadow ecosystem to an alpine desert steppe<br />
ecosystem <strong>and</strong> decreases in overall primary productivity. In ice-rich permafrost regions,<br />
degradation increased soil moisture <strong>and</strong> changed communities from terrestrial to aquatic. In<br />
Mentasta Pass <strong>and</strong> Tanana Flats, Alaska wet sedge meadows, bogs, <strong>and</strong> thermokarst lakes<br />
replaced forests. Thawing permafrost decreased the content of water-soluble nitrogen,<br />
potassium, <strong>and</strong> phosphorus in China, but other studies in Sweden showed permafrost<br />
degradation improved nitrogen mineralization <strong>and</strong> availability, <strong>and</strong> subsequent community<br />
productivity. <strong>Permafrost</strong> degradation also releases carbon <strong>and</strong> nitrogen dioxide (N 2 0)<br />
currently stored in frozen soils <strong>and</strong> provides a positive feedback mechanism for further<br />
global warming. Increased plant growth may sequester some, but not all, of this excess<br />
carbon <strong>and</strong> nitrogen.<br />
165. Yoshikawa, K., <strong>and</strong> Hinzman, L.D., 2003, Shrinking thermokarst ponds <strong>and</strong><br />
groundwater dynamics in discontinuous permafrost near Council, Alaska: <strong>Permafrost</strong><br />
<strong>and</strong> Periglacial Processes, v. 14, no. 2, p. 151–160.<br />
This study used multiple field <strong>and</strong> laboratory techniques to better underst<strong>and</strong> the dynamics<br />
of thermokarst lakes <strong>and</strong> to characterize groundwater infiltration <strong>and</strong> surface-water<br />
dynamics in an area of discontinuous permafrost near Council, Alaska (Seward Peninsula).<br />
The authors used synthetic aperture radar (SAR) data to classify terrain units <strong>and</strong> surface<br />
water properties, historical aerial photographs <strong>and</strong> satellite images (IKONOS) to assess<br />
pond shrinking <strong>and</strong> recent thermokarst progression, ground-penetrating radar (GPR) <strong>and</strong><br />
DC resistivity to detect permafrost thickness <strong>and</strong> talik formations, <strong>and</strong> temperature<br />
boreholes <strong>and</strong> hydrological observation wells to ground truth their other methods.<br />
<strong>Thermokarst</strong> features had developed in many areas within the last 20 years. <strong>Thermokarst</strong><br />
56
lakes over ice-wedge terrain in the region have decreased in surface area since the early<br />
20th century. Small thermokarst features developed into tundra ponds perched over<br />
permafrost, then grew larger <strong>and</strong> initiated large taliks that completely penetrated the<br />
permafrost, resulting in internal drainage throughout the year. Water budgets for several<br />
thermokarst lakes in the region were estimated <strong>and</strong> the complete drying of several lakes<br />
were predicted in the near future. In regions over thin, warm permafrost, surface ponds may<br />
shrink <strong>and</strong> newly developed small ponds may form. Surface soils may become drier as the<br />
permafrost degrades, with significant effects on latent <strong>and</strong> sensible heat fluxes (<strong>and</strong><br />
subsequent vegetation characteristics <strong>and</strong> fire regimes). The authors suggested that, with<br />
further climate change, thermokarst lakes will continue to shrink in areas of discontinuous<br />
permafrost.<br />
166. Yoshikawa, K., Bolton, W.R., Romanovsky, V.E., Fukuda, M., <strong>and</strong> Hinzman, L.D.,<br />
2003, Impacts of wildfire on the permafrost in the boreal forests of interior Alaska:<br />
Journal of Geophysical Research, v. 108, no. D1, 8148.<br />
This paper examines the effect of wildfires on permafrost in the boreal forest of interior<br />
Alaska by studying 11 fire sites, including 2 controlled burns, with years of ignition ranging<br />
from 1924 to 2000. The authors focused particularly on quantifying the effects of fire on (1)<br />
direct heat conduction <strong>and</strong> convection to the ground, (2) removing moss as an insulating<br />
material, (3) heat budget, (4) soil moisture characteristics, <strong>and</strong> (5) active-layer thickness<br />
<strong>and</strong> talik formation. Immediately following fire, ground thermal conductivity may increase<br />
tenfold <strong>and</strong> the surface albedo can decrease by 50 percent depending on the extent of<br />
burning of the surficial organic soil. The authors determined that if the organic layer<br />
thickness was not reduced during the burn, then the active layer did not change after the<br />
burn in spite of the surface albedo decrease. However, for sites with a high burn severity<br />
<strong>and</strong> combustion of the organic layer, the active layer increased to a depth that did not<br />
refreeze each winter after a period of 3–5 years. At a site that burned in 1983, <strong>and</strong> talik<br />
thickness of 4 m was already present. An overview of the instrumentation involved in the<br />
study is given in table 1 of the study.<br />
167. Zhang, K., Kimball, J.S., Mu, Q., Jones, L.A., Goetz, S.J., <strong>and</strong> Running, S.W., 2009,<br />
Satellite based analysis of northern ET trends <strong>and</strong> associated changes in the regional<br />
water balance from 1983 to 2005: Journal of Hydrology, v. 379, no. 1, p. 92–110.<br />
This paper uses satellite remotely sensed inputs to drive an evapotranspiration (ET)<br />
algorithm for the <strong>Arctic</strong> <strong>and</strong> Alaska. The algorithm suggests a significant, increasing trend<br />
in ET with time. A weak increasing trend in precipitation <strong>and</strong> annual runoff suggest<br />
intensification of the pan-<strong>Arctic</strong> terrestrial water cycle during the 23-year period of record.<br />
The model displayed substantial spatial variability. Uncertainties exist because the model<br />
does not consider snow <strong>and</strong> ice sublimation during the frozen period, precipitation events,<br />
sparse precipitation observations, <strong>and</strong> the likely underestimation of open-water evaporation<br />
rates. Despite these potential sources of error, the model agreed well with tower-derived ET<br />
measurements. These results are consistent with other climate models, <strong>and</strong> with theoretical<br />
expectations given a warmer temperatures <strong>and</strong> more energy to drive the hydrologic cycle.<br />
57
Russian-Language Literature<br />
These references were taken from Shur <strong>and</strong> Osterkamp (2007). They have been included<br />
here for two reasons: (1) to demonstrate the long history of thermokarst-related research in the<br />
Russian literature, <strong>and</strong> (2) to provide a central <strong>and</strong> accessible location for these references in case<br />
some are translated to English in the future.<br />
168. Are, F.E., 1969, On present-day drying of the thermokarst lakes in central Yakutia, in<br />
Geographical problems in Yakutia: Yakutsk, USSR (Russia), issue 5, p. 78–87. [In<br />
Russian.]<br />
169. Are, F.E., 1985, Fundamentals of shore thermal-abrasion: Novosibirsk, USSR<br />
(Russia), Nauka. [In Russian.]<br />
170. Are, F.E., Balobaev, V.T., <strong>and</strong> Bosikov, N.P., 1974, Peculiarities of shore erosion of<br />
thermokarst lakes in Central Yakutia, in Lakes of Cryolitozone of Siberia:<br />
Novosibirsk, USSR (Russia), Nauka, p. 39–52. [In Russian.]<br />
171. Bakulin, F.G., 1958, Ice content <strong>and</strong> thaw settlement of perennially frozen Quaternary<br />
deposit of the Vorkuta region: Moscow, USSR Academy of Sciences Press. [In<br />
Russian.]<br />
172. Bosikov, N.P., 1996, Climate change <strong>and</strong> thermokarst evolution, in Climate impact on<br />
permafrost l<strong>and</strong>scapes of central Yakutia: Yakutsk, Russia, <strong>Permafrost</strong> Institute, p.<br />
106–121. [In Russian.]<br />
173. Boytsov, M.N., 1965, Evolution of the thermokarst lakes basins, in Anthropogenic<br />
period in <strong>Arctic</strong> <strong>and</strong> Subarctic: Moscow, Nedra, p. 327–339. [In Russian.]<br />
174. Durdenevskaya, M.V., 1932, <strong>Permafrost</strong> <strong>and</strong> ground ice in lake shores in the Irkut<br />
river valley, Commission on <strong>Permafrost</strong> Study, vol. 1: Leningrad (St. Petersburg),<br />
USSR Academy of Sciences, p. 55–67. [In Russian.]<br />
175. Efimov, A.I., 1946, Drying of the thermokarst lakes of central Yakutia:<br />
Merzlotovedenie, vol. 1, no. 2, p. 95–105. [In Russian.]<br />
176. Ermolaev, M.M., 1932, Geology <strong>and</strong> geomorphology of the Bol’shoy Liakhovsky<br />
Isl<strong>and</strong>, in Polar geophysical station at the Bol’shoy Liakhvsky Isl<strong>and</strong>: Leningrad (St.<br />
Petersburg), USSR Academy of Sciences, p. 147–228. [In Russian.]<br />
177. Fel’dman, G.M., 1984, <strong>Thermokarst</strong> <strong>and</strong> permafrost: Novosibirsk, USSR (Russia),<br />
Nauka. [In Russian.]<br />
178. Kachurin, S.P., 1961, <strong>Thermokarst</strong> in the USSR: Moscow, USSR Academy of Sciences<br />
Press. [In Russian.]<br />
179. Katasonov, E.M., 1978, <strong>Thermokarst</strong> as historic-geological process: in General<br />
<strong>Permafrost</strong>—Articles submitted to Third International Conference on <strong>Permafrost</strong>:<br />
Novosibirsk, USSR (Russia), Nauka, p. 124–130. [In Russian.]<br />
180. Katasonov, E.M., 1979, About thermokarst <strong>and</strong> thermokarst forms of relief, in<br />
Structures <strong>and</strong> age of alas deposit of central Yakutia: Novosibirsk, USSR (Russia),<br />
Nauka, p. 4–7. [In Russian.]<br />
181. Mukhin, N.I., 1960, Importance of the polygonal forms of relief for thermokarst<br />
development in Low Indigirka River area, in A collection of articles on fundamentals<br />
of geocryology: Moscow, USSR Academy of Sciences Press, p. 41–55. [In Russian.]<br />
182. Pchelintsev, A.M., 1946, Morphologic description of the thermokarst in Yakutia, in A<br />
collection of articles of the <strong>Permafrost</strong> Institute: v. 1, no. 2, p. 95–105. [In Russian.]<br />
183. Shur, Y.L., 1977, <strong>Thermokarst</strong> (on thermo-physical fundamentals of the thermokarst<br />
development): Moscow, Nedra, 80 p. [In Russian.]<br />
58
184. Shur, Y.L., 1981, <strong>Thermokarst</strong> prediction, in Recommendations on prediction of<br />
permafrost related geological processes in developing areas of Far North: Moscow,<br />
All-Russian Research Institute for Hydrogeology <strong>and</strong> Engineering Geology<br />
(VSEGINGEO), p. 16–35. [In Russian.]<br />
185. Shur, Y.L., 1983, Prediction of thermokarst in Grechishchev, S.E., ed., Geocryological<br />
prediction for West Siberia Natural Gas Province: Novosibirsk, USSR (Russia),<br />
Nauka, p. 210–226. [In Russian.]<br />
186. Shur, Y.L., 1988, The upper horizon of permafrost <strong>and</strong> thermokarst: Novosibirsk,<br />
Russia, Nauka, 210 p. [In Russian.]<br />
187. Shur, Y.L., Petrukhin, N.P., <strong>and</strong> Slavin-Borovskiy, V.B., 1978, Shore erosion in the<br />
permafrost region, in <strong>Permafrost</strong> related processes: Moscow, Nauka, p. 57–74. [In<br />
Russian.]<br />
188. Soloviev, P.A., 1962, Alas relief of central Yakutia <strong>and</strong> its origin, in Grave, N.A., ed.,<br />
<strong>Permafrost</strong> <strong>and</strong> related features in central Yakutia: Moscow, USSR Academy of<br />
Sciences Press, p. 38–54. [In Russian.]<br />
189. Soloviev, P.A., 1973, Alas thermokarst relief of central Yakutia, Guidebook: Second<br />
International Conference on <strong>Permafrost</strong>, Yakutsk, USSR (Russia), 48 p. [In Russian.]<br />
190. Stremyakov A. Ya., 1963, On genesis of oriented lakes—<strong>Permafrost</strong> in different<br />
regions of the USSR: USSR Academy of Sciences, p. 75–107. [In Russian.]<br />
191. Sukhodrovskiy, V.L., 1979, Exogenic relief formation in the permafrost region:<br />
Moscow, Nauka, 279 p. [In Russian.]<br />
192. Uvarkin, Y.T., 1969, Recommendations on thermokarst investigations during<br />
geotechnical survey in the permafrost region: Moscow, PNIIIS.<br />
193. Uvarkin, Y.T., <strong>and</strong> Shamanova, I.I., 1973, Main regularities of the thermokarst<br />
development in west Siberia, Second International Conference on <strong>Permafrost</strong>,<br />
Yakutsk, USSR (Russia), issue 2, p. 142–145. [In Russian.]<br />
194. Velmina, N.A., 1957, Origin of closed (alas) depressions in central Yakutia , in<br />
<strong>Permafrost</strong> conditions of west Siberia, Yakutia, <strong>and</strong> Chukotka: Moscow, Nauka,<br />
p. 37–71. [In Russian.]<br />
195. Vturin, B.I., 1975, Underground ice in the USSR: Moscow, Nauka. [In Russian.]<br />
Acknowledgments<br />
Funding for this work was largely provided by grant 2012-15 from the <strong>Arctic</strong> L<strong>and</strong>scape<br />
Conservation Cooperative provided to the U.S. Geological Survey–Alaska Science Center.<br />
Additional support was provided by the U.S. Geological Survey–Alaska Science Center, the U.S.<br />
Geological Survey–L<strong>and</strong> Change Science program, <strong>and</strong> the University of Alaska–Fairbanks–<br />
<strong>Permafrost</strong> Laboratory. A special thanks to M. Torre Jorgenson, Kenneth M. Hinkel, <strong>and</strong> Yuri Shur<br />
for reviewing version 1.0 <strong>and</strong> to John Osias <strong>and</strong> Linda Rogers for editing the bibliography.<br />
59
This page intentionally left blank<br />
60
Publishing support provided by the U.S. Geological Survey<br />
Publishing Network, Tacoma Publishing Service Center<br />
For additional information contact:<br />
Director, Alaska Science Center<br />
U.S. Geological Survey<br />
4210 University Dr.<br />
Anchorage, Alaska 99508-4560<br />
http://alaska.usgs.gov
Jones <strong>and</strong> others— <strong>Thermokarst</strong> <strong>and</strong> Thaw-Related L<strong>and</strong>scape Dynamics—An Annotated Bibliography with an Emphasis on Potential Effects on Habitat <strong>and</strong> Wildlife—Open-File Report 2013–1161