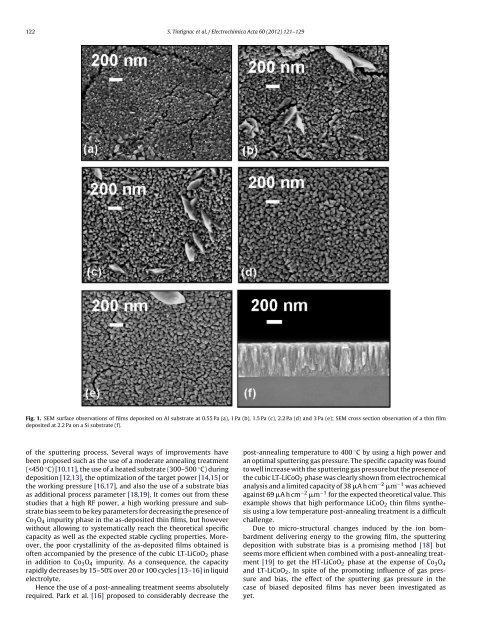
122 S. Tintignac et al. / Electrochimica Acta 60 (2012) 121–129 Fig. 1. SEM surface observ<strong>at</strong>ions of <strong>films</strong> deposited on Al substr<strong>at</strong>e <strong>at</strong> 0.55 Pa (a), 1 Pa (b), 1.5 Pa (c), 2.2 Pa (d) and 3 Pa (e); SEM cross section observ<strong>at</strong>ion of a <strong>thin</strong> film deposited <strong>at</strong> 2.2 Pa on a Si substr<strong>at</strong>e (f). of the sputtering process. Several ways of improvements have been proposed such as the use of a moder<strong>at</strong>e annealing tre<strong>at</strong>ment (
S. Tintignac et al. / Electrochimica Acta 60 (2012) 121–129 123 Table 1 Atomic positions, site symmetries and optical vibr<strong>at</strong>ional modes expected for R-3m, Fd3m LiCoO 2 and Co 3O 4. * * (101) * * Atoms Wyckoff positions IR active modes Raman active modes LiCoO 2 (space group R-3 m) Li (0, 0, 1/2) 3b 2A 2u + 2E u A 1g + E g Co (0, 0, 0) 3a O (0, 0, .26) 6c LiCoO 2 (space group Fd3 m) Li (0, 0, 0) 16c 5F 1u A 1g + E g + 2F 2g Co (1/2, 1/2, 1/2) 16d O (1/4,1/4,1/4) 32e Co 3O 4 (space group Fd3 m) Co (1/2, 1/2, 1/2) 16d 5F 1u A 1g + E g + 3F 2g Co (1/8, 1/8, 1/8) 8a O (.26, .26, .26) 32e Intensity / a.u. (003) * (012) * * * * * 3 Pa 2.2 Pa 1.5 Pa 1 Pa 0.55 Pa * (110) 10 20 30 40 50 2 θ / degree 60 70 With the objective of lowering the global thermal budget by using a temper<strong>at</strong>ure below 700 ◦ C, the deposition conditions to get well crystallized and high <strong>performance</strong> LiCoO 2 <strong>thin</strong> <strong>films</strong> have been optimized. Our approach consists in the appropri<strong>at</strong>e combined use of a high power value, a substr<strong>at</strong>e bias, an optimized value of the working pressure and a moder<strong>at</strong>e he<strong>at</strong> tre<strong>at</strong>ment temper<strong>at</strong>ure. The present work reports the investig<strong>at</strong>ion of the influence of working pressure and substr<strong>at</strong>e bias on the structural and electrochemical properties of LiCoO 2 <strong>thin</strong> <strong>films</strong>. By using Raman spectroscopy, a quantit<strong>at</strong>ive analysis of electroactive deposited LiCoO 2 phases as a function of working pressure and bias is allowed for the first time. We will show th<strong>at</strong> the optimiz<strong>at</strong>ion of these deposition parameters leads to excellent <strong>performance</strong>s when associ<strong>at</strong>ed with a process temper<strong>at</strong>ure as low as 500 ◦ C. 2. Experimental LiCoO 2 <strong>films</strong> with a thickness of 500 nm were deposited by radio frequency magnetron sputtering, using an ALCATEL SCM 600 reactor. The 150 mm target was made of 99.9% pure LiCoO 2 (SCI engineered m<strong>at</strong>erials). Aluminum foils (Goodfellow, purity 99.0%) with thickness of 200 m were used as substr<strong>at</strong>es. The target power was set to 500 W, the Ar/O 2 r<strong>at</strong>io to 3 and the total amount of gases Fig. 2. XRD measurements of <strong>films</strong> deposited <strong>at</strong> 0.55 Pa, 1 Pa, 1.5 Pa, 2.2 Pa, 3 Pa and post-annealed <strong>at</strong> 500 ◦ C. * substr<strong>at</strong>e peaks. was set to 53 sccm. The distance between target and substr<strong>at</strong>e was 9.5 cm. The working pressure was varied between 0.55 Pa and 3 Pa. The deposition was made either with or without a neg<strong>at</strong>ive substr<strong>at</strong>e bias voltage of 50 V. The deposited <strong>films</strong> were post-annealed in air <strong>at</strong> 500 ◦ C for 2 h with a r<strong>at</strong>e of 5 ◦ C/min and cooled to room temper<strong>at</strong>ure with a r<strong>at</strong>e of 2 ◦ C/min. The film thickness was determined with a Tencor AlphaStep 500 profilometer. Morphology and surface aspects of the <strong>films</strong> were observed with a Scanning Electron Microscope (SEM) LEO 1530 FEG. X-Ray diffraction experiments were performed using a Brüker D8 Advance diffractometer with Cu K radi<strong>at</strong>ion. Raman microspectrometry was also performed to g<strong>at</strong>her structural inform<strong>at</strong>ion with a LaBRAM HR 800 (Jobin-Yvon-Horiba) Raman micro-spectrometer including Edge filters and equipped for signal detection with a back illumin<strong>at</strong>ed charge coupled device detector (Spex CCD) cooled by Peltier effect to 200 K. A He:Ne laser (632.8 nm) was used as the excit<strong>at</strong>ion source. The spectra were measured in back-sc<strong>at</strong>tering geometry. The resolution was about 0.5 cm −1 . A 100× objective lens was used to focus the laser light on 607 LiCoO 2 Co 3 O 4 Intensity / a.u. 450 485 + 487 + Co 3 O 4 591 597 + Fd3m R-3m Intensity / a.u. 197 484 525 694 621 300 400 500 600 Raman shift / cm -1 700 800 200 400 600 Raman shift / cm -1 800 Fig. 3. Raman sc<strong>at</strong>tering spectra for spinel Fd3m LT-LiCoO 2, hexagonal R-3m HT-LiCoO 2 and Co 3O 4. Excit<strong>at</strong>ion with 514.5 nm radi<strong>at</strong>ion. From [43].