High performance sputtered LiCoO2 thin films obtained at a ...
High performance sputtered LiCoO2 thin films obtained at a ...
High performance sputtered LiCoO2 thin films obtained at a ...

You also want an ePaper? Increase the reach of your titles
YUMPU automatically turns print PDFs into web optimized ePapers that Google loves.
Electrochimica Acta 60 (2012) 121–129<br />
Contents lists available <strong>at</strong> SciVerse ScienceDirect<br />
Electrochimica Acta<br />
jou rn al hom epa ge: www.elsevier.com/loc<strong>at</strong>e/electacta<br />
<strong>High</strong> <strong>performance</strong> <strong>sputtered</strong> LiCoO 2 <strong>thin</strong> <strong>films</strong> <strong>obtained</strong> <strong>at</strong> a moder<strong>at</strong>e annealing<br />
tre<strong>at</strong>ment combined to a bias effect<br />
Sophie Tintignac a,b , Rita Baddour-Hadjean a,∗ , Jean-Pierre Pereira-Ramos a , Raphaël Salot b<br />
a Institut de Chimie et des M<strong>at</strong>ériaux Paris Est, ICMPE/GESMAT, UMR 7182 CNRS-Université Paris Est Créteil (UPEC), 2 rue Henri Dunant 94320 Thiais, France<br />
b CEA Grenoble, DRT/LITEN/DTNM/LCMS, 17 rue des Martyrs 38054 Grenoble, France<br />
a r t i c l e i n f o<br />
Article history:<br />
Received 8 June 2011<br />
Received in revised form<br />
29 September 2011<br />
Accepted 4 November 2011<br />
Available online 16 November 2011<br />
Keywords:<br />
LiCoO 2 <strong>thin</strong> <strong>films</strong><br />
Lithium microb<strong>at</strong>tery<br />
Raman spectroscopy<br />
RF sputtering<br />
a b s t r a c t<br />
LiCoO 2 <strong>thin</strong> <strong>films</strong> have been successfully deposited by radio frequency magnetron sputtering onto aluminum<br />
substr<strong>at</strong>e and post-annealed <strong>at</strong> a lower temper<strong>at</strong>ure of 500 ◦ C compared to usual annealing<br />
tre<strong>at</strong>ments. We demonstr<strong>at</strong>e th<strong>at</strong> an appropri<strong>at</strong>e combin<strong>at</strong>ion of key deposition parameters including a<br />
high working pressure and a substr<strong>at</strong>e bias enables for the first time the reproducible synthesis <strong>at</strong> this<br />
moder<strong>at</strong>e temper<strong>at</strong>ure of high <strong>performance</strong> layered HT-LiCoO 2 <strong>thin</strong> <strong>films</strong>. The morphology, the structure<br />
and the electrochemical behaviour of the deposits have been examined as a function of the working<br />
gas pressure ranging from 0.55 Pa to 3 Pa. Raman microspectrometry has been thoroughly used to characterize<br />
the structure of the <strong>thin</strong> <strong>films</strong>: a mixture of the layered HT-LiCoO 2 and the cubic LT-LiCoO 2<br />
phases is system<strong>at</strong>ically revealed in the absence of substr<strong>at</strong>e bias and for the first time, the access to<br />
the rel<strong>at</strong>ive amount of both compounds is allowed. A promoting effect of increasing gas pressure on the<br />
form<strong>at</strong>ion of the layered HT-LiCoO 2 phase is demonstr<strong>at</strong>ed, the HT/LT rel<strong>at</strong>ive amount increasing from<br />
1:3 <strong>at</strong> 0.55 Pa to 3:4 <strong>at</strong> 3 Pa. In a second step, we show th<strong>at</strong> the effect of substr<strong>at</strong>e bias combined with high<br />
values of working gas pressure and a moder<strong>at</strong>e he<strong>at</strong> tre<strong>at</strong>ment (500 ◦ C) leads to the form<strong>at</strong>ion of pure<br />
HT-LiCoO 2 <strong>thin</strong> <strong>films</strong> <strong>at</strong> 3 Pa, with very <strong>at</strong>tractive electrochemical properties: a high specific capacity of<br />
67 A h cm −2 m −1 <strong>at</strong> C/5 r<strong>at</strong>e, a good adherence to the substr<strong>at</strong>e and the best capacity retention known<br />
for a LiCoO 2 film in liquid electrolyte (4.2–3 V).<br />
© 2011 Elsevier Ltd. All rights reserved.<br />
1. Introduction<br />
The development of all-solid-st<strong>at</strong>e lithium microb<strong>at</strong>teries has<br />
been widely investig<strong>at</strong>ed over the last decade. Indeed, they can<br />
fit with the requests of portable devices and microelectronic components<br />
and especially with the ability of the power source to<br />
be integr<strong>at</strong>ed directly on/in the component as a backup power<br />
source in microelectromechanical system (MEMS), smart cards and<br />
biochips for instance. These microb<strong>at</strong>teries consist in stacks of <strong>thin</strong><br />
film m<strong>at</strong>erials elabor<strong>at</strong>ed by physical vapour deposition techniques<br />
and their total thickness must not exceed few tens of micrometers.<br />
<strong>High</strong> quality <strong>thin</strong> film c<strong>at</strong>hodes with high electrochemical <strong>performance</strong><br />
are one of the key points for microb<strong>at</strong>teries. Among c<strong>at</strong>hodic<br />
m<strong>at</strong>erials for Li-ion b<strong>at</strong>teries, LiCoO 2 is the most commonly used in<br />
commercial devices due to its high specific capacity (140 mA h g −1 ),<br />
high oper<strong>at</strong>ing electrode potential (≈ 4 V), long cycle life and ease<br />
∗ Corresponding author. Tel.: +33 149 781 195; fax: +33 149 781 195.<br />
E-mail address: baddour@icmpe.cnrs.fr (R. Baddour-Hadjean).<br />
of prepar<strong>at</strong>ion involving a he<strong>at</strong> tre<strong>at</strong>ment <strong>at</strong> temper<strong>at</strong>ure above<br />
700 ◦ C.<br />
LiCoO 2 <strong>thin</strong> <strong>films</strong> can be prepared by sputtering techniques<br />
[1–24], pulsed laser deposition (PLD) [25–30], chemical vapour<br />
deposition CVD [31–34], and chemical routes including the electrost<strong>at</strong>ic<br />
spray pyrolysis and sol–gel processes [35–40]. DC or RF<br />
magnetron sputtering is the most widely used technique for LiCoO 2<br />
prepar<strong>at</strong>ion investig<strong>at</strong>ed in liquid or solid electrolytes. A major<br />
characteristic of the <strong>sputtered</strong> <strong>films</strong> is their low crystallinity and<br />
low electrochemical efficiency when they are used as-prepared<br />
in Li b<strong>at</strong>teries. The synthesis of high <strong>performance</strong> <strong>thin</strong> film, in<br />
general, requires a post-annealing tre<strong>at</strong>ment <strong>at</strong> high temper<strong>at</strong>ure<br />
(600–800 ◦ C) to improve the crystallinity of the LiCoO 2 deposit.<br />
However, such a high temper<strong>at</strong>ure process is often not comp<strong>at</strong>ible<br />
with devices requiring the direct integr<strong>at</strong>ion of the b<strong>at</strong>tery and<br />
many desirable substr<strong>at</strong>es such as flexible polymer m<strong>at</strong>erials and<br />
low-temper<strong>at</strong>ure substr<strong>at</strong>e m<strong>at</strong>erials, which can limit the applic<strong>at</strong>ion<br />
and fabric<strong>at</strong>ion of the <strong>thin</strong> film b<strong>at</strong>teries. Therefore, significant<br />
efforts must be undertaken to optimize the film crystallinity and<br />
electrochemical properties through a low temper<strong>at</strong>ure process by<br />
controlling some of the deposition parameters. Nevertheless, only<br />
a few works focused on the influence of deposition parameters<br />
0013-4686/$ – see front m<strong>at</strong>ter © 2011 Elsevier Ltd. All rights reserved.<br />
doi:10.1016/j.electacta.2011.11.033
122 S. Tintignac et al. / Electrochimica Acta 60 (2012) 121–129<br />
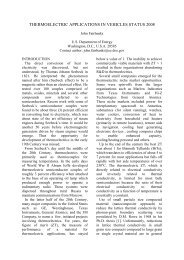
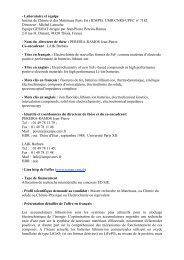
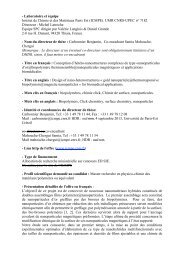
Fig. 1. SEM surface observ<strong>at</strong>ions of <strong>films</strong> deposited on Al substr<strong>at</strong>e <strong>at</strong> 0.55 Pa (a), 1 Pa (b), 1.5 Pa (c), 2.2 Pa (d) and 3 Pa (e); SEM cross section observ<strong>at</strong>ion of a <strong>thin</strong> film<br />
deposited <strong>at</strong> 2.2 Pa on a Si substr<strong>at</strong>e (f).<br />
of the sputtering process. Several ways of improvements have<br />
been proposed such as the use of a moder<strong>at</strong>e annealing tre<strong>at</strong>ment<br />
(
S. Tintignac et al. / Electrochimica Acta 60 (2012) 121–129 123<br />
Table 1<br />
Atomic positions, site symmetries and optical vibr<strong>at</strong>ional modes expected for R-3m,<br />
Fd3m LiCoO 2 and Co 3O 4.<br />
*<br />
*<br />
(101)<br />
*<br />
*<br />
Atoms<br />
Wyckoff<br />
positions<br />
IR active<br />
modes<br />
Raman active<br />
modes<br />
LiCoO 2 (space group R-3 m)<br />
Li (0, 0, 1/2) 3b 2A 2u + 2E u A 1g + E g<br />
Co (0, 0, 0) 3a<br />
O (0, 0, .26) 6c<br />
LiCoO 2 (space group Fd3 m)<br />
Li (0, 0, 0) 16c 5F 1u A 1g + E g + 2F 2g<br />
Co (1/2, 1/2, 1/2) 16d<br />
O (1/4,1/4,1/4) 32e<br />
Co 3O 4 (space group Fd3 m)<br />
Co (1/2, 1/2, 1/2) 16d 5F 1u A 1g + E g + 3F 2g<br />
Co (1/8, 1/8, 1/8) 8a<br />
O (.26, .26, .26) 32e<br />
Intensity / a.u.<br />
(003) *<br />
(012)<br />
* *<br />
* *<br />
*<br />
3 Pa<br />
2.2 Pa<br />
1.5 Pa<br />
1 Pa<br />
0.55 Pa<br />
*<br />
(110)<br />
10<br />
20<br />
30<br />
40 50<br />
2 θ / degree<br />
60<br />
70<br />
With the objective of lowering the global thermal budget by<br />
using a temper<strong>at</strong>ure below 700 ◦ C, the deposition conditions to<br />
get well crystallized and high <strong>performance</strong> LiCoO 2 <strong>thin</strong> <strong>films</strong> have<br />
been optimized. Our approach consists in the appropri<strong>at</strong>e combined<br />
use of a high power value, a substr<strong>at</strong>e bias, an optimized<br />
value of the working pressure and a moder<strong>at</strong>e he<strong>at</strong> tre<strong>at</strong>ment<br />
temper<strong>at</strong>ure. The present work reports the investig<strong>at</strong>ion of the<br />
influence of working pressure and substr<strong>at</strong>e bias on the structural<br />
and electrochemical properties of LiCoO 2 <strong>thin</strong> <strong>films</strong>. By<br />
using Raman spectroscopy, a quantit<strong>at</strong>ive analysis of electroactive<br />
deposited LiCoO 2 phases as a function of working pressure<br />
and bias is allowed for the first time. We will show th<strong>at</strong> the<br />
optimiz<strong>at</strong>ion of these deposition parameters leads to excellent <strong>performance</strong>s<br />
when associ<strong>at</strong>ed with a process temper<strong>at</strong>ure as low as<br />
500 ◦ C.<br />
2. Experimental<br />
LiCoO 2 <strong>films</strong> with a thickness of 500 nm were deposited by<br />
radio frequency magnetron sputtering, using an ALCATEL SCM 600<br />
reactor. The 150 mm target was made of 99.9% pure LiCoO 2 (SCI<br />
engineered m<strong>at</strong>erials). Aluminum foils (Goodfellow, purity 99.0%)<br />
with thickness of 200 m were used as substr<strong>at</strong>es. The target power<br />
was set to 500 W, the Ar/O 2 r<strong>at</strong>io to 3 and the total amount of gases<br />
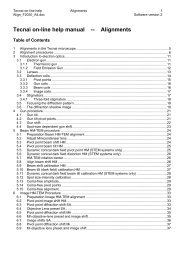
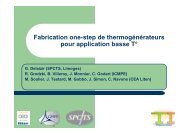
Fig. 2. XRD measurements of <strong>films</strong> deposited <strong>at</strong> 0.55 Pa, 1 Pa, 1.5 Pa, 2.2 Pa, 3 Pa and<br />
post-annealed <strong>at</strong> 500 ◦ C. * substr<strong>at</strong>e peaks.<br />
was set to 53 sccm. The distance between target and substr<strong>at</strong>e was<br />
9.5 cm. The working pressure was varied between 0.55 Pa and 3 Pa.<br />
The deposition was made either with or without a neg<strong>at</strong>ive substr<strong>at</strong>e<br />
bias voltage of 50 V. The deposited <strong>films</strong> were post-annealed<br />
in air <strong>at</strong> 500 ◦ C for 2 h with a r<strong>at</strong>e of 5 ◦ C/min and cooled to room<br />
temper<strong>at</strong>ure with a r<strong>at</strong>e of 2 ◦ C/min. The film thickness was determined<br />
with a Tencor AlphaStep 500 profilometer. Morphology and<br />
surface aspects of the <strong>films</strong> were observed with a Scanning Electron<br />
Microscope (SEM) LEO 1530 FEG. X-Ray diffraction experiments<br />
were performed using a Brüker D8 Advance diffractometer with Cu<br />
K radi<strong>at</strong>ion.<br />
Raman microspectrometry was also performed to g<strong>at</strong>her structural<br />
inform<strong>at</strong>ion with a LaBRAM HR 800 (Jobin-Yvon-Horiba)<br />
Raman micro-spectrometer including Edge filters and equipped<br />
for signal detection with a back illumin<strong>at</strong>ed charge coupled device<br />
detector (Spex CCD) cooled by Peltier effect to 200 K. A He:Ne laser<br />
(632.8 nm) was used as the excit<strong>at</strong>ion source. The spectra were<br />
measured in back-sc<strong>at</strong>tering geometry. The resolution was about<br />
0.5 cm −1 . A 100× objective lens was used to focus the laser light on<br />
607<br />
LiCoO 2<br />
Co 3 O 4<br />
Intensity / a.u.<br />
450<br />
485<br />
+<br />
487<br />
+ Co 3 O 4<br />
591<br />
597<br />
+<br />
Fd3m<br />
R-3m<br />
Intensity / a.u.<br />
197<br />
484<br />
525<br />
694<br />
621<br />
300<br />
400<br />
500 600<br />
Raman shift / cm -1<br />
700<br />
800<br />
200<br />
400 600<br />
Raman shift / cm -1<br />
800<br />
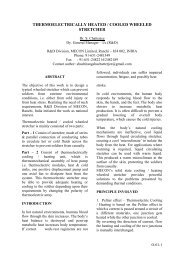
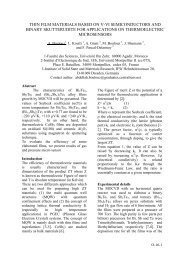
Fig. 3. Raman sc<strong>at</strong>tering spectra for spinel Fd3m LT-LiCoO 2, hexagonal R-3m HT-LiCoO 2 and Co 3O 4. Excit<strong>at</strong>ion with 514.5 nm radi<strong>at</strong>ion. From [43].
124 S. Tintignac et al. / Electrochimica Acta 60 (2012) 121–129<br />
sample surface to a spot size of 1 m 2 . To avoid local he<strong>at</strong>ing of the<br />
sample, the power of the laser beam was adjusted to 0.2–0.5 mW<br />
with neutral filters of various optical densities. Raman spectra have<br />
been recorded on 15 different spots of each <strong>thin</strong> film electrode. The<br />
Raman spectra have been examined using deconvolutions analysis<br />
of d<strong>at</strong>a sets exhibiting multiple peaks.<br />
Electrodes of 14 mm in diameter were assembled in cointype<br />
cells (CR2032), with metallic lithium as counter electrode,<br />
filled in with a commercial grade LP30 electrolyte (Merck) 1 M<br />
LiPF 6 (EC:DMC = 1:1). The separ<strong>at</strong>or is constituted by a Viledon ®<br />
membrane soaked with electrolyte and Cellgard ® . Galvanost<strong>at</strong>ic<br />
experiments were made with a multichannel VMP3 appar<strong>at</strong>us (Bio-<br />
Logic Science Instruments).<br />
3. Results and discussion<br />
SEM images of the <strong>films</strong> grown on aluminum substr<strong>at</strong>es <strong>at</strong> different<br />
working pressures from 0.55 Pa to 3 Pa and then annealed <strong>at</strong><br />
500 ◦ C are shown in Fig. 1. All the <strong>thin</strong> <strong>films</strong> exhibit homogeneous<br />
grain size distribution and morphology. However, for working pressure<br />
values in the range 0.55–1.5 Pa, some cracks and large size<br />
particles appear. The particle size, as well as the porosity, is seen<br />
to increase with the pressure. For instance, porous deposits are<br />
achieved <strong>at</strong> 2.2 and 3 Pa with well-defined grains of 50 nm against<br />
dense deposits of 20 nm particles for lower pressures. The SEM<br />
image of the cross section for a <strong>thin</strong> film deposited <strong>at</strong> 2.2 Pa on a Si<br />
substr<strong>at</strong>e shows a columnar growth perpendicular to the substr<strong>at</strong>e<br />
surface (Fig. 1f).<br />
XRD experiments were carried out in order to check the crystallinity<br />
of the samples annealed <strong>at</strong> 500 ◦ C as a function of the<br />
working pressure (Fig. 2). In a first approach, all the diffraction<br />
p<strong>at</strong>terns can be indexed on the basis of an hexagonal symmetry<br />
with unit cell parameters a = b = 2.82 Å and c = 14.05 Å of the<br />
LiCoO 2 phase (R-3m space group). The broadness of the lines indic<strong>at</strong>es<br />
small crystallite size. These polycrystalline <strong>thin</strong> <strong>films</strong> exhibit<br />
a preferential orient<strong>at</strong>ion which is clearly influenced by the working<br />
pressure. Indeed, two sets of diffraction p<strong>at</strong>terns are observed:<br />
in the 0.55/2.2 Pa range (0 0 3) oriented <strong>films</strong> are <strong>obtained</strong>. At 3 Pa,<br />
the (0 0 3) line disappears while a strong (1 0 1) line emerges as<br />
well as the (1 1 0) diffraction peak. The preferential (1 1 0) orient<strong>at</strong>ion<br />
was reported to be more favourable for fast Li diffusion than<br />
the (0 0 3) one [6]. However, as the R-3m and Fd3m XRD p<strong>at</strong>terns<br />
are very close (0 1 8)/(1 1 0) and (0 0 6)/(0 1 2) peaks splitting are<br />
the only evidence for the presence of the R-3m HT-LiCoO 2 phase,<br />
and due to the broadness of the peaks, X-ray diffraction does not<br />
enable a clear assignment of the LiCoO 2 structure in the deposited<br />
<strong>films</strong>. Moreover, the presence of Co 3 O 4 impurity phase cannot<br />
be discarded. Conversely, vibr<strong>at</strong>ional spectroscopy can be used to<br />
solve the problem of phase determin<strong>at</strong>ion of LiCoO 2 . Indeed, from<br />
a spectroscopic viewpoint, the factor group analysis determines<br />
the optical vibr<strong>at</strong>ional modes expected for Fd3m and R-3m LiCoO 2<br />
(Table 1). Hence, one should expect to observe two Raman bands<br />
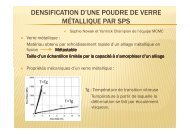
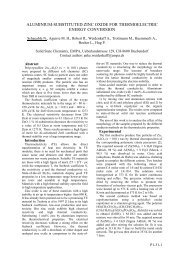
Fig. 4. Atomic displacements of the IR and Raman active modes of hexagonal R-3m<br />
LiCoO 2.<br />
for the R-3m phase and four Raman bands for the Fd3m one. This<br />
fe<strong>at</strong>ure makes Raman microspectrometry a convenient and powerful<br />
technique for the qualit<strong>at</strong>ive microstructural analysis of LiCoO 2<br />
[41]. As shown in Fig. 3, each LiCoO 2 crystal structure gives rise to<br />
a specific Raman fingerprint, consistent with the theoretical predictions,<br />
i.e., four Raman bands are observed <strong>at</strong> ca. 450, 485, 591<br />
and 607 cm −1 for Fd3m LiCoO 2 , whereas two Raman bands <strong>at</strong> 487<br />
and 597 cm −1 , <strong>at</strong>tributed to the A 1g and E g modes, respectively, are<br />
observed for R-3m LiCoO 2 [42,43]. The Raman active modes A 1g and<br />
E g involve vibr<strong>at</strong>ions from oxygen <strong>at</strong>oms only. They correspond to<br />
rel<strong>at</strong>ive displacements of neighbouring oxygen layers with respect<br />
to each other, the displacement occurs along the c axis for the A 1g<br />
mode and is perpendicular to c for the E g mode (Fig. 4). Furthermore,<br />
Raman spectroscopy is able to detect the secondary product<br />
Co 3 O 4 even as traces (Table 1). This sensitivity is due to the particularly<br />
strong sc<strong>at</strong>tering intensity of this oxide which exhibits<br />
five Raman bands consistent with the theoretical predictions<br />
(Fig. 3).<br />
The Raman spectra <strong>obtained</strong> for the samples deposited <strong>at</strong> different<br />
pressures and post-annealed <strong>at</strong> 500 ◦ C are reported in Fig. 5.<br />
All the experimental spectra exhibit two broad bands centered<br />
respectively <strong>at</strong> 490 cm −1 and 599 cm −1 , which could be in a first<br />
approach consistent with the presence of the HT-LiCoO 2 phase. The<br />
broadness of these peaks is ascribed to the nanometer size of <strong>films</strong><br />
particles and also to more or less pronounced shoulders due to the<br />
presence of several phases in the samples. The shape and intensity<br />
of Raman bands is seen to be strongly dependent on the working<br />
pressure.<br />
Table 2<br />
Raman wavenumbers <strong>obtained</strong> from the deconvolutions of the spectral profiles of LiCoO 2 <strong>thin</strong> <strong>films</strong> deposited <strong>at</strong> different working pressures, with their asssignments to<br />
HT-LiCoO 2, LT-LiCoO 2 and Co 3O 4.<br />
Raman shift (cm −1 )<br />
LT LT HT Co 3O 4 LT HT LT Co 3O 4 Co 3O 4<br />
From [43] 449 484 487 524 590 597 605 622 692<br />
0.55 Pa 456 480 490 539 573 597 616 645 –<br />
1 Pa 456 480 490 539 573 597 616 645 –<br />
1.5 Pa – 480 490 539 573 597 616 645 –<br />
2.2 Pa 459 480 490 539 573 597 616 645 667<br />
3 Pa – – 490 – 571 599 – 636 675
S. Tintignac et al. / Electrochimica Acta 60 (2012) 121–129 125<br />
490 599<br />
0.55 Pa<br />
LT<br />
HT<br />
Intensity / a.u.<br />
3 Pa<br />
2.2 Pa<br />
1.5 Pa<br />
1 Pa<br />
HT<br />
LT<br />
LT<br />
1 Pa<br />
Co 3 O 4<br />
LT<br />
Co 3 O 4<br />
0.55 Pa<br />
HT<br />
HT<br />
400<br />
500<br />
600<br />
Raman shift / cm -1<br />
700<br />
Fig. 5. Raman spectra <strong>obtained</strong> from <strong>thin</strong> <strong>films</strong> deposited <strong>at</strong> 0.55 Pa, 1 Pa, 1.5 Pa,<br />
2.2 Pa and 3 Pa and post-annealed <strong>at</strong> 500 ◦ C.<br />
The Raman spectra were fitted assuming the coexistence of both<br />
HT- and LT-LiCoO 2 structures and cobalt oxide Co 3 O 4 . The fitting<br />
results are g<strong>at</strong>hered in Fig. 6. Table 2 summarizes the Raman band<br />
wavenumbers <strong>obtained</strong> from the deconvolution of the spectral profiles<br />
for each pressure. Wh<strong>at</strong>ever the working pressure, the Raman<br />
spectra account for a mixture of the Fd3m and R-3m fingerprints<br />
consisting in four Raman bands loc<strong>at</strong>ed <strong>at</strong> ca. 456, 480, 573 and<br />
616 cm −1 and two bands <strong>at</strong> 490 and 597 cm −1 respectively. Additional<br />
broad Raman fe<strong>at</strong>ures <strong>at</strong> 539, 636/645 and 667/675 cm −1<br />
indic<strong>at</strong>e the presence of low crystallized residual Co 3 O 4 in all the<br />
samples, the very weak contribution observed for the highest working<br />
pressure of 3 Pa revealing probably only some traces for this<br />
impurity. The system<strong>at</strong>ic presence of residual Co 3 O 4 in the samples<br />
raises the question of the compositional evolution in sputter<br />
deposited LiCoO 2 <strong>thin</strong> <strong>films</strong>. Actually, this is a difficult task not<br />
yet resolved because sputtering from a multielemental target like<br />
LiCoO 2 is largely influenced by the process parameters involved<br />
during deposition. Recent studies based upon MC simul<strong>at</strong>ions deal<br />
with some of these complex aspects and put forward the role of<br />
inhomogeneous distribution of Li and Co <strong>at</strong>oms, differential sputtering<br />
yield of individual components but also angular ejection<br />
of the <strong>sputtered</strong> <strong>at</strong>oms and differential transport of the <strong>sputtered</strong><br />
<strong>at</strong>oms [44].<br />
On the other hand, the intensity of Raman bands associ<strong>at</strong>ed with<br />
the R-3m structure strengthens along with the pressure increase,<br />
whereas the shoulders assigned to the Fd3m phase undergo a significant<br />
decrease. Due to the spectroscopic similarity of both phases,<br />
this trend can be quantit<strong>at</strong>ively depicted from the analysis of the<br />
integr<strong>at</strong>ed intensities rel<strong>at</strong>ed to the Fd3m and R-3m Raman fe<strong>at</strong>ures<br />
respectively which provides a good estim<strong>at</strong>ion of the Fd3m/R-3m<br />
rel<strong>at</strong>ive amounts as a function of the working pressure (Fig. 7). This<br />
leads to an amount of ca. 30% R-3m phase in the deposit <strong>obtained</strong> <strong>at</strong><br />
0.55 Pa. Then, when the pressure increases from 1 Pa to 2.2 Pa, the<br />
R-3m amount significantly increases to ≈50% to reach 75% <strong>at</strong> 3 Pa.<br />
It comes out th<strong>at</strong> the R-3m phase appears from a pressure as low as<br />
0.55 Pa, but th<strong>at</strong> 25% Fd3m phase still coexists with the R-3m phase<br />
<strong>at</strong> 3 Pa.<br />
Intensity / a.u.<br />
LT<br />
LT<br />
1.5 Pa<br />
2.2 Pa<br />
3 Pa<br />
HT<br />
LT<br />
HT<br />
LT<br />
LT<br />
HT<br />
Co 3 O 4<br />
LT<br />
HT<br />
LT<br />
Co LT<br />
3<br />
O 4<br />
Co 3 O 4<br />
HT<br />
LT<br />
Co 3 O 4<br />
LT<br />
LT<br />
Co 3 O 4<br />
Co 3 O 4 Co 3 O 4<br />
LT<br />
HT<br />
Co 3 O 4Co3 O 4<br />
400 500 600 700<br />
Raman shift / cm -1<br />
Fig. 6. Raman spectra of <strong>thin</strong> <strong>films</strong> deposited <strong>at</strong> 0.55 Pa, 1 Pa, 1.5 Pa, 2.2 Pa and 3 Pa<br />
and post-annealed <strong>at</strong> 500 ◦ C, with the deconvolutions shown below.
126 S. Tintignac et al. / Electrochimica Acta 60 (2012) 121–129<br />
100<br />
HT HT bias -50V<br />
LT LT bias -50V<br />
a<br />
4.2<br />
i= 10 µA cm -2<br />
HT/LT rel<strong>at</strong>ive amount / %<br />
80<br />
60<br />
40<br />
20<br />
0<br />
0<br />
1<br />
Working pressure / Pa<br />
Fig. 7. Rel<strong>at</strong>ive amount of HT/LT-LiCoO 2 phases in <strong>thin</strong> <strong>films</strong> deposited <strong>at</strong> different<br />
working pressure with or without a neg<strong>at</strong>ive substr<strong>at</strong>e bias of 50 V and<br />
post-annealed <strong>at</strong> 500 ◦ C.<br />
All the <strong>thin</strong> <strong>films</strong> were cycled <strong>at</strong> 10 A cm −2 between 3 and<br />
4.2 V versus Li/Li + to investig<strong>at</strong>e their charge–discharge properties.<br />
As shown in Fig. 8a, the electrochemical results are consistent<br />
with the previous structural characteriz<strong>at</strong>ion afforded by Raman<br />
analysis. Indeed, the film deposited <strong>at</strong> 3 Pa and containing the highest<br />
r<strong>at</strong>io of HT-LiCoO 2 phase leads to the best charge capacity of<br />
52 A h cm −2 m −1 while the low pressure sample is barely cycled,<br />
giving 22 A h cm −2 m −1 , i.e. less than half the capacity of the 3 Pa<br />
<strong>thin</strong> film. The higher the working pressure for deposition, the higher<br />
the HT-LiCoO 2 content and the larger the specific capacity. This<br />
capacity value, lower than th<strong>at</strong> expected, can be explained by the<br />
coexistence of the cubic phase but also by some residual Co 3 O 4 . The<br />
deriv<strong>at</strong>ive curves of the chronopentiometric signals highlight the<br />
following fe<strong>at</strong>ures (Fig. 8b): the electrochemical fingerprint clearly<br />
marked for the HT-LiCoO 2 phase <strong>at</strong> 3.9 V <strong>at</strong> 3 Pa is accompanied by<br />
another couple of peaks <strong>at</strong> 3.75 V and 3.6 V due to the LT-LiCoO 2<br />
phase [45,46]. This film corresponds to an optimized composition<br />
since the contribution of the LT-LiCoO 2 phase significantly<br />
decreases with the pressure to the benefit of the R-3m phase. This<br />
trend is well consistent with the Raman analysis. The cycling properties<br />
of these <strong>films</strong> are illustr<strong>at</strong>ed in Fig. 8c. Starting from different<br />
specific discharge capacities depending on the working pressure,<br />
the same regular capacity decline is observed over 25 cycles for the<br />
<strong>thin</strong> <strong>films</strong> prepared in the 1–3 Pa range. For instance, the discharge<br />
capacity changes <strong>at</strong> 3 Pa from 45 to 34 A h cm −2 m −1 after 25<br />
cycles. This slow capacity decrease with cycles can be ascribed to<br />
the presence of the LT-LiCoO 2 phase which is known to be poorly<br />
rechargeable.<br />
A DC neg<strong>at</strong>ive polariz<strong>at</strong>ion (50 V) has been applied to the substr<strong>at</strong>e<br />
during the film deposition <strong>at</strong> 2 Pa and 3 Pa. This aims <strong>at</strong><br />
increasing the local temper<strong>at</strong>ure by an ion bombardment of the<br />
sample surface. Indeed, effect of Bias during deposition has been<br />
previously described [18,47]. It has been reported th<strong>at</strong> the ion bombardment<br />
of growing <strong>films</strong> strongly influences their microstructure<br />
by increasing the mobility of ad<strong>at</strong>oms on the surface, which results<br />
in increasing the rearrangement probability of ad<strong>at</strong>oms.<br />
The surface morphology of the <strong>thin</strong> film deposited with a substr<strong>at</strong>e<br />
bias <strong>at</strong> 2.2 Pa and post-annealed <strong>at</strong> 500 ◦ C (Fig. 9) indic<strong>at</strong>es an<br />
increase in the mean grain size from 50 to 100 nm. As a result, for<br />
the same deposition conditions and annealing tre<strong>at</strong>ment (500 ◦ C),<br />
the Raman spectra of the <strong>films</strong> indic<strong>at</strong>e also a strong influence of<br />
the bias polariz<strong>at</strong>ion on the film composition (Fig. 10). Indeed, as<br />
2<br />
3<br />
E vs. (Li/Li + ) / V<br />
b<br />
c<br />
Discharge capacity / µAh cm -2 µm -1<br />
4.0<br />
3.8<br />
3.6<br />
3.4<br />
3.2<br />
dQ dE -1 / a.u.<br />
0.55 Pa<br />
1 Pa<br />
1.5 Pa<br />
2.2 Pa<br />
3 Pa<br />
100<br />
3.0<br />
0 20 40 60 80<br />
i = 10 µA cm -2<br />
Capacity / µAh cm -2 µm -1 0.55 Pa<br />
1 Pa<br />
1.5 Pa<br />
2.2 Pa<br />
3 Pa<br />
3.2 3.4 3.6 3.8 4.0 4.2<br />
E vs. (Li/Li + ) / V<br />
70<br />
60<br />
i = 10 µA cm -2<br />
3 Pa<br />
2.2 Pa<br />
1.5 Pa<br />
50<br />
1 Pa<br />
0.55 Pa<br />
40<br />
30<br />
20<br />
10<br />
0<br />
0 5 10 15 20 25<br />
Cycles<br />
Fig. 8. Galvanost<strong>at</strong>ic experiments <strong>at</strong> 10 A/cm 2 in EC:DMC = 1:1/1 M LiPF 6. Cell<br />
potential versus capacity (a), deriv<strong>at</strong>ive signal (b) and discharge capacity versus<br />
cycle number (c).<br />
evidenced from the Raman spectra fitting reported in Fig. 11, the<br />
Fd3m contribution is strongly reduced and even removed: from 40%<br />
to 10% and from 25% to 0% for the LiCoO 2 film deposited <strong>at</strong> 2.2 Pa<br />
and 3 Pa respectively (Fig. 7).<br />
As a consequence, the corresponding electrochemical fe<strong>at</strong>ures<br />
are significantly improved, as shown in the deriv<strong>at</strong>ive curve of<br />
discharge–charge curves (Fig. 12a). The intensity of the peak<br />
loc<strong>at</strong>ed <strong>at</strong> 3.90 V, characteristic of the HT-LiCoO 2 phase, rises
S. Tintignac et al. / Electrochimica Acta 60 (2012) 121–129 127<br />
Fig. 9. Comparison of the surface morphology for <strong>films</strong> deposited <strong>at</strong> 2.2 Pa with or without a neg<strong>at</strong>ive substr<strong>at</strong>e bias of 50 V and post-annealed <strong>at</strong> 500 ◦ C.<br />
Intensity / a.u.<br />
* Co 3<br />
O 4<br />
*<br />
200<br />
3 Pa / bias<br />
2.2 Pa / bias<br />
*<br />
3 Pa<br />
2.2 Pa<br />
400<br />
487<br />
597<br />
600<br />
Raman shift / cm -1<br />
*<br />
* *<br />
*<br />
800<br />
Fig. 10. Raman spectra of the 2.2 Pa and 3.3 Pa <strong>thin</strong> <strong>films</strong> deposited with or without<br />
a neg<strong>at</strong>ive substr<strong>at</strong>e bias of 50 V and post-annealed <strong>at</strong> 500 ◦ C.<br />
tremendously when the substr<strong>at</strong>e bias of −50 V is applied, corrobor<strong>at</strong>ing<br />
the Raman spectra results. The LT-LiCoO 2 peaks <strong>at</strong><br />
3.75 V and 3.6 V disappear from the electrochemical signal as<br />
soon as a substr<strong>at</strong>e polariz<strong>at</strong>ion is used. The electrochemical<br />
cycling <strong>performance</strong>s of these samples are reported in Fig. 12b.<br />
The substr<strong>at</strong>e polariz<strong>at</strong>ion leads to a large increase by 40% of<br />
the capacity value as well as an improvement of cycling properties.<br />
The achievement of 67 A h cm −2 m −1 (133 mA h g −1 ) for<br />
the optimized 3 Pa biased sample, close to the theoretical capacity<br />
of HT-LiCoO 2 can be explained by the Raman analysis giving<br />
a composition of pure HT-LiCoO 2 phase with some traces of<br />
Co 3 O 4 impurity. The cycling properties are also clearly influenced<br />
by the HT/LT r<strong>at</strong>io. Indeed, the 100% HT-LiCoO 2 phase<br />
<strong>obtained</strong> for the 3 Pa/bias film shows an excellent cyclability with<br />
reduced capacity loss of 0.2% per cycle with a slow decrease<br />
from 67 A h cm −2 m −1 (133 mA h g −1 ) for the first cycle to still<br />
61 A h cm −2 m −1 (121 mA h g −1 ) after 50 cycles. In comparison,<br />
the remaining 10% of LT-LiCoO 2 phase contained in the 2.2 Pa/bias<br />
layer is responsible for a faster capacity fading over 50 cycles, the<br />
capacity diminishing from 63 A h cm −2 m −1 (125 mA h g −1 ) to<br />
54 A h cm −2 m −1 (107 mA h g −1 ). In other respect, Fig. 13 shows<br />
there is little change in the discharge–charge curves of the 3 Pa/bias<br />
film which superimpose during cycling. The capacity decreases very<br />
slowly and no polariz<strong>at</strong>ion phenomenon appears, which reflects<br />
good cycling properties. Conversely, a fast capacity decline accompanied<br />
by a strong polariz<strong>at</strong>ion phenomenon is observed for the<br />
deposit <strong>obtained</strong> <strong>at</strong> the same working pressure without the bias<br />
procedure. The efficiency of the synthesis conditions proposed in<br />
Intensity / a.u.<br />
HT<br />
2.2 Pa / bias = -50V<br />
HT<br />
Intensity / a.u.<br />
HT<br />
3 Pa / bias = - 50V<br />
HT<br />
*<br />
LT<br />
* *<br />
* *<br />
*<br />
*<br />
*<br />
400<br />
500<br />
600<br />
700<br />
400 500 600 700<br />
Raman shift / cm -1 Raman shift / cm -1<br />
Fig. 11. Raman spectra of the 2.2 Pa/bias and 3 Pa/bias <strong>thin</strong> <strong>films</strong> post-annealed <strong>at</strong> 500 ◦ C, with their deconvolutions shown below. * Co 3O 4 peaks.
128 S. Tintignac et al. / Electrochimica Acta 60 (2012) 121–129<br />
the present work is demonstr<strong>at</strong>ed by the theoretical specific capacity<br />
reached here in the initial discharge while only ≈66% of this<br />
value is usually <strong>obtained</strong> with an annealing tre<strong>at</strong>ment <strong>at</strong> 500 ◦ C<br />
without the bias procedure [20,21] (Fig. 8). We have checked th<strong>at</strong><br />
an increase in the applied bias voltage (90 V instead of 50 V) induces<br />
a decrease in discharge capacity and an increase in the polariz<strong>at</strong>ion<br />
of the electrodes. Furthermore, measurements of the residual<br />
compressive stress in the <strong>films</strong> indic<strong>at</strong>e an increase by a factor 2<br />
when the applied bias voltage is increased from 50 to 90 V, which is<br />
detrimental towards the all-solid-st<strong>at</strong>e microb<strong>at</strong>teries applic<strong>at</strong>ion.<br />
It must be outlined th<strong>at</strong> a thermal tre<strong>at</strong>ment <strong>at</strong> a minimum<br />
temper<strong>at</strong>ure of 700 ◦ C is usually required to get nearly the theoretical<br />
capacity [1,20–22]. One study reports a discharge capacity<br />
of 130 mA h g −1 in liquid electrolyte for a <strong>sputtered</strong> LiCoO 2 <strong>thin</strong><br />
film deposited <strong>at</strong> an elev<strong>at</strong>ed working pressure of 10 Pa and postannealed<br />
<strong>at</strong> 600 ◦ C [17]. However these <strong>films</strong> are found to exhibit<br />
a capacity loss of 0.7% per cycle, a decrease from 130 mA h g −1 for<br />
the first cycle to 109 mA h g −1 being reported after 25 cycles [17].<br />
With a 90% capacity retention (61 A h cm −2 m −1 after 50<br />
cycles in liquid electrolyte), the present cycling <strong>performance</strong><br />
achieved with the 3 Pa/bias film significantly exceeds all the results<br />
reported in the 4.2–3 V potential range for a <strong>sputtered</strong> LiCoO 2 film<br />
annealed <strong>at</strong> 500 ◦ C [20,21]. Indeed, a high capacity loss of ≈40% is<br />
usually observed over 50 cycles for <strong>thin</strong> <strong>films</strong> annealed <strong>at</strong> temper<strong>at</strong>ure<br />
as low as 500 ◦ C. This outlines the relevance of the combined<br />
use of optimized bias and working pressure values to get a high<br />
crystallinity of the hexagonal LiCoO 2 compound without any presence<br />
of the disordered cubic LiCoO 2 phase. Even compared with<br />
<strong>thin</strong> <strong>films</strong> he<strong>at</strong>-tre<strong>at</strong>ed <strong>at</strong> higher temper<strong>at</strong>ures, our results offer a<br />
better cycling behaviour since a large capacity loss from 25 to 50%<br />
is usually recorded for <strong>films</strong> annealed in the temper<strong>at</strong>ure range<br />
650–900 ◦ C [20–23]. A better adherence of the film to the substr<strong>at</strong>e<br />
provided by the bias procedure cannot be discarded to explain the<br />
better behaviour in addition to the promoting effect on the form<strong>at</strong>ion<br />
of HT-LiCoO 2 .<br />
The understanding of the capacity loss of LiCoO 2 <strong>thin</strong> <strong>films</strong> in<br />
liquid electrolyte is not solved <strong>at</strong> present time but the faster capacity<br />
decline compared to th<strong>at</strong> achieved in an all-solid-st<strong>at</strong>e b<strong>at</strong>tery<br />
is thought to be rel<strong>at</strong>ed with the degrad<strong>at</strong>ion of the LiCoO 2 crystal<br />
structure [24] while this phenomenon would be suppressed when<br />
the oxide film is covered by a solid electrolyte. Therefore, further<br />
experiments are under progress in our labor<strong>at</strong>ory to investig<strong>at</strong>e the<br />
cause of the capacity fading by comparing the electrochemical and<br />
structural responses of the 500 ◦ C he<strong>at</strong>-tre<strong>at</strong>ed 3 Pa/bias <strong>films</strong> in<br />
liquid and solid electrolyte.<br />
Discharge capacity / µAh cm -2 µm -1<br />
a<br />
dQ dE -1 / a.u.<br />
b<br />
70<br />
60<br />
50<br />
40<br />
30<br />
20<br />
10<br />
0<br />
0<br />
3 Pa bias<br />
2.2 Pa bias<br />
3 Pa<br />
2.2 Pa<br />
i=10µA cm -2<br />
3.6 3.8 4.0 4.2<br />
E vs. (Li/Li + ) / V<br />
3 Pa bias<br />
2.2 Pa bias<br />
3 Pa<br />
i = 10µA cm -2 2.2 Pa<br />
50<br />
10<br />
20<br />
Cycles<br />
30<br />
40<br />
Fig. 12. Deriv<strong>at</strong>ive curve of the galvanost<strong>at</strong>ic discharge–charge curve (a) and<br />
capacity versus cycling (b) for the 2.2 Pa, 2.2 Pa/bias, 3 Pa and 3 Pa/bias <strong>thin</strong> <strong>films</strong><br />
post-annealed <strong>at</strong> 500 ◦ C. Current density: 10 A cm −2 , EC:DMC = 1:1/1 M LiPF 6.<br />
50<br />
4.2<br />
3Pa<br />
3Pa / bias<br />
4.0<br />
E vs. (Li/Li+) / V<br />
3.8<br />
3.6<br />
3.4<br />
3.2<br />
Cycle 2<br />
Cycle 5<br />
Cycle 10<br />
Cycle 25<br />
Cycle 2<br />
Cycle 5<br />
Cycle 10<br />
Cycle 25<br />
3.0<br />
0<br />
20 40 60<br />
Capacity / µAh cm -2 µm -1<br />
0<br />
20 40 60<br />
Capacity / µAh cm -2 µm -1<br />
Fig. 13. Comparison of galvanost<strong>at</strong>ic cycling curves <strong>at</strong> 10 A cm −2 for the 3 Pa and 3 Pa/bias <strong>thin</strong> <strong>films</strong> post-annealed <strong>at</strong> 500 ◦ C.
S. Tintignac et al. / Electrochimica Acta 60 (2012) 121–129 129<br />
4. Conclusions<br />
Using a high power of 500 W and a moder<strong>at</strong>e annealing tre<strong>at</strong>ment<br />
<strong>at</strong> 500 ◦ C in air, the influence of the working pressure in the<br />
0.55–3 Pa range has been investig<strong>at</strong>ed to get crystalline <strong>sputtered</strong><br />
LiCoO 2 <strong>thin</strong> <strong>films</strong> with <strong>at</strong>tractive electrochemical properties. The<br />
morphology and the structure of the <strong>films</strong> are seen to be controlled<br />
by the working pressure. In particular, a thorough Raman<br />
analysis based upon system<strong>at</strong>ic Raman spectra fittings indic<strong>at</strong>es<br />
the presence of a LT-LiCoO 2 /HT-LiCoO 2 mixture in the deposits.<br />
Furthermore, this technique turned out to be very useful as it<br />
allowed for the first time to check quantit<strong>at</strong>ively the Fd3m/R-3m<br />
rel<strong>at</strong>ive amount in the <strong>sputtered</strong> <strong>thin</strong> <strong>films</strong>: a promoting effect<br />
of the increasing pressure is demonstr<strong>at</strong>ed, in good accord with<br />
the corresponding electrochemical properties in the 4.2/3 V potential<br />
region, the HT-LiCoO 2 content increasing from 30% <strong>at</strong> 0.55 Pa<br />
to 75% <strong>at</strong> 3 Pa. Enhanced electrochemical properties in terms of<br />
capacity and cycle life have been <strong>obtained</strong> by applying a neg<strong>at</strong>ive<br />
polariz<strong>at</strong>ion to the substr<strong>at</strong>e. Indeed, the combined use of substr<strong>at</strong>e<br />
bias (−50 V) with a high working pressure of 3 Pa during rf magnetron<br />
sputtering has allowed to get rid of the cubic phase and<br />
then to achieve high <strong>performance</strong> HT-LiCoO 2 <strong>films</strong> with specific<br />
capacity of 67 A h cm −2 m −1 close to the theoretical value and<br />
a capacity retention of ≈90% over 50 cycles <strong>at</strong> C/5 r<strong>at</strong>e without<br />
any polariz<strong>at</strong>ion phenomenon during cycling. These electrochemical<br />
characteristics are the best known for a LiCoO 2 <strong>thin</strong> film in liquid<br />
electrolyte. The use of a high pressure, high power, bias substr<strong>at</strong>e<br />
and moder<strong>at</strong>e he<strong>at</strong>-tre<strong>at</strong>ment <strong>at</strong> 500 ◦ C has ensured the high crystallinity<br />
of the deposit, the exclusive form<strong>at</strong>ion of the hexagonal<br />
HT-LiCoO 2 phase, the decrease of the Co 3 O 4 amount and probably<br />
a good adherence of the LiCoO 2 film to the aluminum substr<strong>at</strong>e.<br />
Of course, additional measurements such as kinetic studies and<br />
extended cycling experiments are under progress in our group as<br />
well as the integr<strong>at</strong>ion of these HT-LiCoO 2 <strong>thin</strong> <strong>films</strong> in all-solidst<strong>at</strong>e<br />
Li b<strong>at</strong>teries.<br />
References<br />
[1] B. Wang, J.B. B<strong>at</strong>es, F.X. Hart, B.C. Sales, R.A. Zuhr, J.D. Robertson, J. Electrochem.<br />
Soc. 143 (1996) 3203.<br />
[2] N.J. Dudney, Y.I. Jang, J. Power Sources 119–121 (2003) 300.<br />
[3] J.B. B<strong>at</strong>es, N.J. Dudney, B.J. Neudecker, F.X. Hart, H.P. Jun, S.A. Hackney, J. Electrochem.<br />
Soc. 147 (2000) 59.<br />
[4] J.B. B<strong>at</strong>es, N.J. Dudney, B. Neudecker, A. Ueda, C.D. Evans, Solid St<strong>at</strong>e Ionics 135<br />
(2000) 33.<br />
[5] P.J. Bouwman, B.A. Boukamp, H.J.M. Bouwmeester, H.J. Wondergem, P.H.L. Notten,<br />
J. Electrochem. Soc. 148 (2001) A311.<br />
[6] P.J. Bouwman, B.A. Boukamp, H.J.M. Bouwmeester, P.H.L. Notten, J. Electrochem.<br />
Soc. 149 (2002) A699.<br />
[7] J.F. Whitacre, W.C. West, B.V. R<strong>at</strong>nakumar, J. Power Sources 103 (2001)<br />
134.<br />
[8] J.K. Lee, S.J. Lee, H.K. Baik, H.Y. Lee, S.W. Jang, S.M. Lee, Electrochem. Solid St<strong>at</strong>e<br />
Lett. 2 (1999) 512.<br />
[9] M. Hayashi, M. Takahashi, Y. Sakurai, J. Power Sources 174 (2007) 990.<br />
[10] J.F. Whitacre, W.C. West, E. Brandon, B.V. R<strong>at</strong>nakumar, J. Electrochem. Soc 148<br />
(2001) A1078.<br />
[11] K.F. Chiu, F.C. Hsu, G.S. Chen, M.K. Wu, J. Electrochem. Soc. 150 (2003) A503.<br />
[12] J. Pracharova, J. Pridal, J. Bludska, I. Jakubec, V. Vorlicek, Z. Malkova, Th. Dikonimos<br />
Makris, R. Giorgi, L. Jastrabik, J. Power Sources 108 (2002) 204.<br />
[13] X. Zhu, Z. Guo, G. Du, P. Zhang, H. Liu, Surf. Co<strong>at</strong>. Technol. 204 (2010) 1710.<br />
[14] S.W. Jeon, J.K. Lim, S.H. Lim, S.M. Lee, Electrochim. Acta 51 (2005) 268.<br />
[15] H. Pan, Y. Yang, J. Power Sources 189 (2009) 633.<br />
[16] H.Y. Park, S.C. Nam, Y.C. Lim, K.G. Choi, K.C. Lee, G.B. Park, H.P. Kim, S.B. Cho,<br />
Korean J. Chem. Eng. 23 (2006) 832.<br />
[17] C. Ziebert, B. Ketterer, M. Rinke, C. Adelhelm, S. Ulrich, K.-H. Zum Gahr, S. Indris,<br />
T. Schimmel, Surf. Co<strong>at</strong>. Technol. 205 (2010) 1589.<br />
[18] H.Y. Park, S.R. Lee, Y.J. Lee, B.W. Cho, W.I. Cho, M<strong>at</strong>er. Chem. Phys. 93 (2005)<br />
70.<br />
[19] B. Ketterer, H. Vasilchina, K. Seeman, S. Ulrich, H. Besser, W. Pfleging, T. Kaiser,<br />
C. Adelhelm, Int. J. M<strong>at</strong>er. Res. 99 (2008) 1171.<br />
[20] C.L. Liao, K.Z. Fung, J. Power Sources 128 (2004) 263.<br />
[21] C.L. Liao, Y.H. Lee, K.Z. Fung, J. Alloys Compd. 436 (2007) 303.<br />
[22] J. Xie, N. Imanishi, T. M<strong>at</strong>sumura, A. Hirano, Y. Takeda, O. Yamamoto, Solid St<strong>at</strong>e<br />
Ionics 179 (2008) 362.<br />
[23] W.S. Kim, J. Power Sources 134 (2004) 103.<br />
[24] M. Takahashi, M. Hayashi, Y.T. Shodai, J. Power Sources 189 (2009) 191.<br />
[25] M. Antaya, J.R. Dahn, J.S. Preston, E. Rossen, J.N. Reimers, J. Electrochem. Soc.<br />
140 (1993) 575.<br />
[26] K.A. Striebel, C.Z. Deng, S.J. Wen, E.J. Cairns, J. Electrochem. Soc 143 (1996)<br />
1821.<br />
[27] J.D. Perkins, C.S. Bahn, J.M. Mc Graw, P.A. Parilla, D.S. Ginley, J. Electrochem. Soc.<br />
148 (2001) A1302.<br />
[28] C. Julien, M.A. Camacho-Lopez, L. Escobar-Alarcon, E. Haro-Poni<strong>at</strong>owski, M<strong>at</strong>er.<br />
Chem. Phys. 68 (2001) 210.<br />
[29] S.B. Tang, M.O. Lai, L. Lu, J. Alloys Compd. 424 (2006) 342.<br />
[30] H. Xia, L. Lu, Electrochim. Acta 52 (2007) 7014.<br />
[31] S.I. Cho, S.G. Yoon, J. Electrochem. Soc. 149 (2002) A1584.<br />
[32] S.I. Cho, S.G. Yoon, Appl. Phys. Lett. 82 (2003) 3345.<br />
[33] W.-G. Chai, S.-G. Yoon, J. Power Sources 125 (2004) 236.<br />
[34] J.F.M. Oudenhoven, T. Van Dongen, R.A.H. Niessen, M. de Croon, P.H.L. Notten,<br />
J. Electrochem. Soc. 156 (2009) D169.<br />
[35] P. Fragnaud, T. Brousse, D.M. Schleich, J. Power Sources 63 (1996) 187.<br />
[36] P. Fragnaud, R. Nagarajan, D.M. Schleich, D. Vujic, J. Power Sources 54 (1995)<br />
362.<br />
[37] Y. Yu, J.L. Shui, Y. Jin, C.H. Chen, Electrochim. Acta 51 (2006) 3292.<br />
[38] Y.H. Rho, K. Kanamura, T. Umegaki, J. Electrochem. Soc. 150 (2003) A107.<br />
[39] Y.H. Rho, K. Kanamura, M. Fujisaki, J.I. Hamagami, S.I. Suda, T. Umegaki, Solid<br />
St<strong>at</strong>e Ionics 151 (2002) 151.<br />
[40] M.K. Kim, H.T. Chung, Y.J. Park, J.G. Kim, J.T. Son, K.S. Park, H.G. Kim, J. Power<br />
Sources 99 (2001) 34.<br />
[41] R. Baddour-Hadjean, J.P. Pereira-Ramos, Chem. Rev. 110 (2010) 1278.<br />
[42] W. Huang, R. Frech, Solid St<strong>at</strong>e Ionics 86–88 (1996) 395.<br />
[43] L. Mendoza, R. Baddour-Hadjean, M. Cassir, J.P. Pereira-Ramos, Appl. Surf. Sci.<br />
225 (2004) 356.<br />
[44] C.S. Nimisha, G.M. Rao, J. Appl. Phys. 109 (2011) 114910.<br />
[45] B. Garcia, J. Farcy, J.P. Pereira-Ramos, N. Baffier, J. Electrochem. Soc. 144 (1997)<br />
1179.<br />
[46] E. Rossen, J.N. Reimers, J.R. Dahn, Solid St<strong>at</strong>e Ionics 62 (1993) 53.<br />
[47] R. Messier, et al., J. Vac. Sci. Technol. A2 (1984) 500.