Spectroscopy Brochure - Andor Technology
Spectroscopy Brochure - Andor Technology
Spectroscopy Brochure - Andor Technology

Create successful ePaper yourself
Turn your PDF publications into a flip-book with our unique Google optimized e-Paper software.
<strong>Spectroscopy</strong> Solutions<br />
A Modular Approach
<strong>Andor</strong> <strong>Spectroscopy</strong> Product Portfolio<br />
Engineered from the outset with “ease-of-use” in mind, every <strong>Andor</strong> <strong>Spectroscopy</strong> system<br />
features a combination of market leading detectors and spectral instruments, seamlessly<br />
controlled through <strong>Andor</strong>’s dedicated and intuitive Solis software platform. From configuration<br />
of these pre-aligned, pre-calibrated instruments to integration into each unique laboratory<br />
set-up, <strong>Andor</strong> <strong>Spectroscopy</strong> solutions allow researchers around the world to focus quickly on<br />
their own challenges: achieving high quality results and breakthrough discoveries.<br />
Software<br />
Pages 6-7<br />
Solis <strong>Spectroscopy</strong> and Solis Scanning offer<br />
interactive and dedicated graphical interfaces<br />
for simultaneous multi-channel or single point<br />
detector data acquisition, spectrographs and<br />
motorized accessories control.<br />
Page 2<br />
Cameras<br />
Pages 8-19<br />
Market leading CCDs, InGaAs PDAs, Intensified<br />
CCDs and Electron-Multiplying CCDs for VUV to NIR<br />
<strong>Spectroscopy</strong>. Unsurpassed combination of cuttingedge<br />
Thermo-Electric cooling, proprietary vacuum<br />
technology and ultra-low-noise electronics to extract<br />
the very best performance from every <strong>Andor</strong> camera.
Scanning Accessories<br />
Pages 36-37<br />
Extending <strong>Spectroscopy</strong> from UV into Short and Long-Wave<br />
IR through a range of single point detectors including a<br />
PMTs, Si photodiode, InGaAs, PbS, InSb and MCT. Softwarecontrolled<br />
data acquisition unit synchronizes simultaneously<br />
detectors, monochromators and motorized accessories.<br />
Spectrographs<br />
Pages 20-27<br />
Complete family of rugged, pre-aligned and precalibrated<br />
Czerny-Turner & echelle spectrographs,<br />
for applications ranging from high-resolution<br />
UV plasma studies to NIR photoluminescence.<br />
The ideal partner for <strong>Andor</strong>’s high-performance<br />
detectors and accessories for ultimate low-light<br />
detection.<br />
Accessories<br />
Pages 28-35<br />
From gratings to fibre optics, sample chamber,<br />
filter wheel and microscope coupling interfaces,<br />
each accessory allows seamless optimization<br />
of <strong>Andor</strong> detection system performance and<br />
easy integration into researchers complex<br />
experimental setups.<br />
Application and Technical Notes<br />
Pages 40-55<br />
Page 3
Our experience has enabled us to bring<br />
together the latest cutting-edge technology<br />
in the fields of sensors, electronics, optics,<br />
vacuum technology and software to deliver<br />
world-class, market-leading scientific<br />
<strong>Spectroscopy</strong> detection systems.<br />
<strong>Andor</strong>’s experience in manufacturing high-performance <strong>Spectroscopy</strong> systems<br />
spans over 20 years, with thousands of detectors in the field and a proud history of<br />
remarkable advances in a wide variety of research areas, truly helping scientists all<br />
over the world to “Discover new ways of seeing”.<br />
Page 4
Incoming photons<br />
e - e - e -<br />
Readout node (CCD)<br />
Readout node (EMCCD)<br />
Silicon<br />
bulk<br />
Clocking<br />
electrodes<br />
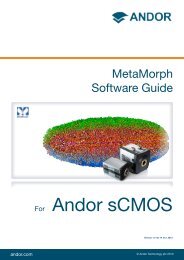
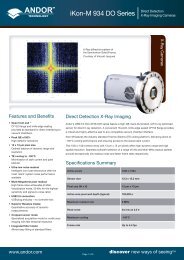
Example of a Back-Illuminated CCD pixel<br />
structure<br />
CCD basics<br />
A Charge Coupled Device, or CCD, is a 2D matrix of silicon diode photosensors<br />
referred to as “pixels”. Incident photons with sufficient energy are<br />
absorbed in the silicon bulk and liberate an electron which can be stored and<br />
detected as part of a readout sequence. Photons with wavelength λ<br />
>1.1μm do<br />
not have enough energy to create a free electron and therefore set the upper<br />
detection limit of silicon CCDs.<br />
The probability of detecting a photon at a particular wavelength is known as<br />
Quantum Efficiency (QE). QE will vary with depletion depth of the silicon, quality<br />
of the CCD structural layers and clocking electrodes “transparency”.<br />
At the end of an exposure, the CCD pixel charges are transferred sequentially<br />
under a masked area known as the shift register. This serial register connects<br />
to an amplifier that digitizes the signal and allows a quantitative readout of the<br />
amount of electrons per pixel.<br />
The principal types of high performance CCD-based digital cameras include :<br />
• The Charge-Coupled-Device (CCD)<br />
• The Electron-Multiplying CCD (EMCCD) - with on-chip gain for sensitivity<br />
down to single photon<br />
• The Intensified CCD (ICCD) - Image Intensifier provides fast optical<br />
shuttering and signal amplification<br />
Ultravac – Market-leading vacuum and cooling technology<br />
Cooling sensors reduce thermally generated noise that would otherwise interfere with<br />
the useful signal, hence making it a prerequisite for high sensitivity measurements. The<br />
sensor must be operated in a vacuum in order to :<br />
1. Guarantee access to the best cooling performance, hence lowest<br />
dark current<br />
2. Increase sensor lifetime by avoiding condensation and sensor degradation<br />
Outgassing is a natural process occurring in any permanent vacuum system,<br />
whereby remanent impurities contained in the chamber will be slowly released<br />
and potentially affect cooling performance over time. Over 20 years experience<br />
in vacuum technology ensures that <strong>Andor</strong> cameras come with an un-matched<br />
warranty on vacuum integrity, guaranteeing cooling performance year after<br />
year. Combined with <strong>Andor</strong>’s highly efficient Thermo-Electric cooling interface,<br />
temperatures as low as -100ºC will be achieved without the inconvenient use of<br />
Liquid Nitrogen (LN 2 ), see SNR discussion in the technical notes section. <strong>Andor</strong>’s<br />
industry-leading vacuum seal design also means that only one window is required<br />
in front of the sensor enabling maximum photon throughput, which is especially<br />
suited for photon-starved applications.<br />
Making sense of sensitivity – signal-to-noise ratio considerations<br />
A camera Signal-to-Noise Ratio (commonly abbreviated to S/N or SNR) is the true comparison basis between detectors<br />
and detector technologies. It takes into account both photon capture capability of the detector and different noise<br />
sources along the detection path that can impact on the integrity of the useful signal. The sources of this noise are the<br />
following :<br />
• Readout noise - inherent sensor electron-to-voltage conversion and amplification noise<br />
• Thermal noise - originating from sensor, blackbody radiation (SWIR region) or image intensifier photocathode<br />
• Photon noise / Shot noise - statistical incoming photon variation<br />
• Spurious Charge / Clocking Induced Charge (CIC) - result of impact ionization during charge transfer<br />
CCD sensitivity is shot noise and readout noise limited - typically used at slow digitization speeds<br />
EMCCD sensitivity is shot noise and CIC limited – typically used for photon-starved and ultrafast <strong>Spectroscopy</strong><br />
ICCD sensitivity is shot noise and photocathode thermal noise (EBI) limited – typically used for ns time-resolution<br />
Page 5
Page 6
Software<br />
“Discover new ways of seeing TM ” takes its true meaning when the most<br />
sensitive <strong>Spectroscopy</strong> detection solutions on the market combine with<br />
<strong>Andor</strong>’s comprehensive software capabilities. From seamless configuration<br />
of spectrographs and cameras to actual data acquisition optimization, <strong>Andor</strong><br />
Solis software and Software Development Kit offer a truly powerful, yet userfriendly<br />
modular approach to <strong>Spectroscopy</strong>.<br />
Solis for <strong>Spectroscopy</strong><br />
Modular Raman <strong>Spectroscopy</strong>, Laser Induced Breakdown <strong>Spectroscopy</strong> (LIBS) and Plasma diagnostics are only a few<br />
examples of applications where <strong>Andor</strong> Solis <strong>Spectroscopy</strong> allows researchers to truly focus on their own experimental<br />
challenges. With its unique interactive real-time control interface, users can optimize system optical performance<br />
through wavelength, gratings and entrance/exit slits selection at the touch of a button, while accessing all key detectors<br />
acquisition parameters to optimize the quality of the signal. Solis also features a comprehensive range of acquisition<br />
options including ultrafast kinetic series and “Crop mode” operation, simultaneous multi-track recording, photoncounting<br />
mode, and time-resolved series capture for lifetime fluorescence studies.<br />
Solis for Scanning<br />
With detection capabilities ranging from UV to the Long Wave IR (LWIR) region through a comprehensive range of single<br />
point detectors - including PMTs, PbS and MCT, Solis Scanning offers a dedicated platform for scanning applications.<br />
Spectrograph/monochromators, detectors, data acquisition unit, lock-in amplifier / chopper and motorized accessories<br />
can all be conveniently synchronised through a series of intuitive interfaces. A single software package features a<br />
comprehensive step-by-step experiment building interface for parametring and synchronizing all components of the<br />
detection chain. Complex scanning sequences involving multiple gratings, filters and up to 2 monochromators for<br />
fluorescence measurements - including a tuneable light source setup - can be seamlessly captured prior to acquisition<br />
start and executed without further intervention of the user. Solis Scanning can also handle multiple detectors control<br />
and data display for Absorption - Transmission - Reflection <strong>Spectroscopy</strong>, while offering post-acquisition mathematical<br />
data processing ranging from simple ratios and lifetime measurements to fast phenomena analysis.<br />
Software Development Kit (SDK)<br />
<strong>Andor</strong> SDK features a comprehensive library of camera and spectrograph controls, ideally suited for complex<br />
experiments integration including third party hardware control and SDK - i.e. microscope motorized stage or light<br />
sources – and user specific data analysis protocols. Available as 32 and 64-bit libraries for Windows (XP, Vista and 7)<br />
and Linux, the SDK provides a suite of functions that allow configuration of the data acquisition process in a number of<br />
different ways. The dynamic link library can be used with a wide range of programming environments including C/C++,<br />
C#, Delphi, VB6, VB.NET, Labview and Matlab.<br />
Page 7
<strong>Spectroscopy</strong> cameras<br />
<strong>Andor</strong> has been taking pride in helping researchers around the world<br />
achieve breakthrough discoveries for the last 20 years. By keeping at the<br />
forefront of detector technology, <strong>Andor</strong> is able to offer a range of market<br />
leading high-performance, ultra sensitive <strong>Spectroscopy</strong> detectors. Our<br />
CCDs, ICCDs, EMCCDs and InGaAs arrays can operate from the VUV to<br />
Near-Infrared spectral regions with a unique combination of high sensitivity<br />
(down to single photon in the case of EMCCD technology) and ultrafast<br />
acquisition speeds.<br />
CCD<br />
A 2 dimensional silicon-based semiconductor matrix of<br />
photo-sensors, with sensitivity ranging from soft X-Ray<br />
to NIR (1.1 μm). <strong>Spectroscopy</strong> CCDs are traditionally a<br />
rectangular format with a maximum width of 28 mm and<br />
a height up to 13 mm, i.e. matching the focal plane size<br />
of the vast majority of high-end spectrographs.<br />
InGaAs<br />
Indium Gallium Arsenide (InGaAs) is a photo-sensitive<br />
material used for detection up to 2.2 μm. The typical<br />
sensor architecture for <strong>Spectroscopy</strong> applications is a<br />
single row array of up to 25.6 mm.<br />
Page 8<br />
Intensified CCD (ICCD)<br />
Combination of a CCD matrix with a fibre coupled<br />
Image Intensifier, which provides optical shuttering<br />
capabilities and time-resolution down to the<br />
nanosecond regime while also offering a signal<br />
amplification up to x1000.<br />
Electron Multiplying CCD (EMCCD)<br />
Identical architecture to standard CCD sensors, with<br />
the addition of an on-chip amplification channel prior<br />
to the digitization node, designed to overcome the<br />
readout noise limitation of slow-scan CCDs. This<br />
revolutionary technology opens the door to ultrasensitive<br />
and ultra-fast <strong>Spectroscopy</strong>.
Applications Newton Newton EM iXon3 iDus InGaAs iStar<br />
Absorption - Transmission - Reflection UV-NIR UV-Vis UV-NIR UV-NIR NIR-SWIR UV-Vis<br />
Photoluminescence - Fluorescence UV-NIR UV-Vis UV-NIR UV-NIR NIR-SWIR UV-Vis<br />
Raman (SERS, SORS, CARS, Stimulated) 244-830 nm 244-633 nm 244-830 nm 244-830 nm 1064 nm 244-633 nm<br />
Micro-Raman and Micro-Fluorescence UV-NIR UV-Vis UV-NIR UV-NIR NIR-SWIR UV-Vis<br />
Photon Counting<br />
-<br />
UV-Vis UV-Vis - - UV-Vis<br />
Single Molecule <strong>Spectroscopy</strong> - UV-Vis UV-Vis - - UV-Vis<br />
Sensor type Description<br />
Hyper-Spectral Imaging - UV-Vis UV-Vis - - -<br />
LIBS - - - - - UV-NIR<br />
Plasma Studies UV-NIR UV-Vis UV-NIR UV-NIR NIR-SWIR UV-NIR<br />
BEX2-DD Back-illuminated, Deep Depletion CCD, Broadband Dual-AR coating with fringe supression<br />
BR-DD Back-Illuminated, Deep Depletion CCD with fringe suppression<br />
BU Back-Illuminated CCD, UV-Enhanced, 350 nm optimized<br />
BU2 Back-Illuminated CCD, UV-Enhanced, 250 nm optimized<br />
BV Back-Illuminated CCD, VIS optimized<br />
FI Front-Illuminated CCD<br />
OE Open-Electrode CCD<br />
UV Front-Illuminated CCD with UV coating<br />
UVB Back-Illuminated CCD with UV coating<br />
VP Virtual Phase CCD (Proprietary technology from Texas Instruments)<br />
Optimum<br />
NEW<br />
Page 9
iDus CCD cameras<br />
Workhorse <strong>Spectroscopy</strong> Cameras<br />
The iDus is <strong>Andor</strong>’s most popular platform for the <strong>Spectroscopy</strong> research and OEM<br />
communities. Boasting sensor QE up to 95%, state-of-the-art Ultravac TM , cooling down to<br />
-100ºC and a range of 1024 x 127 and 1024 x 256 CCD matrix with UV to NIR optimized<br />
options. The iDus series is the camera of choice for everyday <strong>Spectroscopy</strong> measurements,<br />
as well as more advanced, low light detection applications.<br />
Page 10<br />
Key applications<br />
• Absorption - Transmission - Reflection<br />
• Raman (244, 532, 785 and 833 nm)<br />
• Fluorescence - Luminescence<br />
• Plasma studies<br />
View our<br />
cameras online<br />
www.andor.com
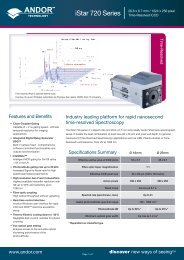
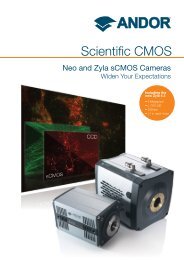
Quantum efficiency (%)<br />
100<br />
90<br />
80<br />
70<br />
60<br />
50<br />
40<br />
30<br />
20<br />
10<br />
BU2<br />
BU<br />
OE<br />
BV<br />
0<br />
200 300 400 500 600 700 800 900 1000 1100 1200<br />
Wavelength (nm)<br />
Features Benefits<br />
FI<br />
BR-DD<br />
BEX2-DD<br />
Peak QE of 95% High detector sensitivity options both in VIS and NIR regions<br />
TE cooling to -100 º C Negligible dark current without the inconvenience of LN 2<br />
Ultravac – Guaranteed hermetic vacuum seal Permanent vacuum integrity, critical for deep cooling and best<br />
sensor performance<br />
Fringe suppression technology for back-thinned<br />
and back illuminated Deep Depletion option<br />
As standard for 401 sensor – virtually eliminates etalonning<br />
effect above 650 nm<br />
Deep-Depletion (Bx-DD) sensor options High NIR QE, virtually etalon-free – ideal for NIR Raman.<br />
Superior broadband detection with Dual-AR technology option<br />
(BEX2-DD)<br />
Simple USB 2.0 connection User friendly plug-and-play connection directly to the back of<br />
the camera<br />
Model Active pixels (μm) Pixel size (μm) Deepest cooling Sensor options<br />
DU401 1024 x 127 26 x 26 -100˚C BV, FI<br />
DU401-BR-DD 1024 x 128 26 x 26 -100˚C BR-DD<br />
DU420 1024 x 255 26 x 26 -100˚C BU, BU2, BV, OE<br />
DU420-Bx-DD 1024 x 256 26 x 26 -100˚C BR-DD, BEX2-DD<br />
DV401 1024 x 127 26 x 26 -70˚C BV, FI<br />
DV420 1024 x 255 26 x 26 -70˚C BU, BU2, BV, OE<br />
NEW<br />
See Page 52 for<br />
technical note – LN 2 vs TE<br />
cooling for BR-DD sensors<br />
Page 11
iDus InGaAs<br />
<strong>Andor</strong>’s iDus InGaAs detector array for <strong>Spectroscopy</strong><br />
<strong>Andor</strong> iDus InGaAs 1.7 and 2.2 array series provide the most compact and optimized<br />
research-grade platform for <strong>Spectroscopy</strong> applications up to either 1.7 or 2.2 μm. The<br />
Thermo-Electrically cooled, in-vacuum sensors reach cooling temperatures of -90ºC<br />
where the best signal-to-noise ratio can be achieved for the majority of the applications<br />
in this spectral region. Beyond this cooling point blackbody radiation from any elements<br />
facing the sensor will dominate the dark signal, and since Quantum Efficiency will be<br />
impacted with decreasing cooling temperature, TE cooling will allow access to optimum<br />
SNR performance.<br />
Page 12<br />
See page 42 for<br />
Photoluminescence<br />
application note<br />
See page 52 for<br />
technical note – LN 2 vs TE<br />
cooling for InGaAs sensors
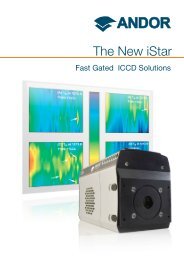
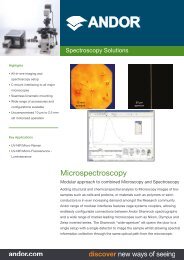
Quantum efficiency (%)<br />
100<br />
90<br />
80<br />
70<br />
60<br />
50<br />
40<br />
30<br />
20<br />
10<br />
BR-DD<br />
InGaAs 1.7<br />
0<br />
400 600 800 1000 1200 1400 1600 1800 2000 2200<br />
Wavelength (nm)<br />
Features Benefits<br />
High Quantum Efficiency<br />
Peak QE >80% for 1.7 μm cut-off<br />
Peak QE >70% for 2.2 μm cut-off<br />
Maximum sensitivity in the NIR<br />
InGaAs 2.2<br />
Typically attainable TE cooling to -90°C Minimise dark current efficiently without the inconvenience of LN 2<br />
UltraVac Ensures best sensor performance and protection in time<br />
Minimum exposure time of 1.4 μsec Allows study of fast transient phenomena<br />
25 μm pixel width option Optimized for high dynamic range and high resolution<br />
25.6 mm wide arrays options Optimized for Czerny-Turner spectrograph focal plane size<br />
Software selectable output amplifiers Choice of High Dynamic Range (HDR) or High Sensitivity (HS)<br />
Simple opto-mechanical coupling interface Readily integrate with <strong>Andor</strong> Shamrock spectrograph series<br />
Simple USB 2.0 connection User-friendly plug-and-play connection directly to the back of<br />
the camera<br />
Model Array size<br />
(mm)<br />
Array size<br />
(pixels)<br />
Pixel size<br />
(W x H, μm)<br />
DU490A-1.7 12.8 512 x 1 25 x 500 1.7<br />
DU490A-2.2 12.8 512 x 1 25 x 250 2.2<br />
DU491A-1.7 25.6 1024 x 1 25 x 500 1.7<br />
DU491A-2.2 25.6 1024 x 1 25 x 250 2.2<br />
DU492A-1.7 25.6 512 x 1 50 x 500 1.7<br />
DU492A-2.2 25.6 512 x 1 50 x 250 2.2<br />
Upper cut-off<br />
wavelength (μm)<br />
Key applications<br />
• NIR and SWIR Absorption -<br />
Transmission - Reflection<br />
• Raman (1064 nm)<br />
• NIR Photoluminescence<br />
Page 13
Newton CCD<br />
The World’s fastest <strong>Spectroscopy</strong> CCD<br />
When it comes to the best in <strong>Spectroscopy</strong> detection, the Newton CCD cameras always<br />
come first. With a wide range of sensors boasting up to 95% QE, pixels as small as<br />
13.5 μm and the <strong>Andor</strong> state-of-the-art Ultravac platform for everlasting cooling<br />
performance to -100˚C, the Newton series offers no compromise when it comes to high<br />
sensitivity. Its low-noise, multi-MHz electronics platform enables spectral collection faster<br />
than 1600 spectra per second, ideal for transient phenomona studies.<br />
Key applications<br />
Page 14<br />
• Absorption - Transmission - Reflection<br />
• Raman (244, 532, 785 and 833 nm)<br />
• Fluorescence - Luminescence<br />
• Plasma studies<br />
• Fast Transient phenomena study
Quantum efficiency (%)<br />
100<br />
90<br />
80<br />
70<br />
60<br />
50<br />
40<br />
30<br />
20<br />
10<br />
BU<br />
BV<br />
BU2<br />
0<br />
200 300 400 500 600 700 800 900 1000 1100 1200<br />
Wavelength (nm)<br />
Features Benefits<br />
OE<br />
UV<br />
FI<br />
BR-DD<br />
BEX2-DD<br />
Multi-megahertz readout High repetition rates achievable with low noise electronics -<br />
ideal for transient phenomona study<br />
TE cooling to -100°C Negligible dark current without the inconvenience of LN 2<br />
UltraVac - guaranteed hermetic vacuum<br />
seal technology<br />
Permanent vacuum integrity, critical for deep cooling & best<br />
sensor performance access<br />
Down to 13.5 x 13.5 μm pixel size Optimized pixel size for achievement of high resolution<br />
<strong>Spectroscopy</strong><br />
Crop mode operation Achieve the highest possible spectral rates of over<br />
1600 spectra per second<br />
Deep-depletion sensor options High NIR QE, virtually etalon-free - ideal for NIR Raman.<br />
Superior broadband detection with Dual-AR technology option<br />
(BEX2-DD)<br />
Software-selectable output amplifiers<br />
(DU940)<br />
Choice of High Dynamic Range (HDR) or High Sensitivity (HS)<br />
Simple opto-mechanical coupling interface Readily integrate with <strong>Andor</strong> Shamrock spectrograph series<br />
Simple USB 2.0 connection User friendly plug-and-play connection directly to the back of<br />
the camera<br />
Model Active pixels (μm) Pixel size (μm) Sensor options<br />
DU920 1024 x 255 26 x 26 BU, BU2, BV, OE<br />
DU920-Bx-DD 1024 x 256 26 x 26 BR-DD, BEX2-DD<br />
DU940 2048 x 512 13.5 x 13.5 BU, BU2, BV, FI, UV<br />
NEW<br />
Page 15
iXon and Newton<br />
Speed and Sensitivity with NO compromise<br />
EM<br />
From the pioneers of EMCCD technology the newly released iXon Ultra and Newton EM series<br />
have brought low-light <strong>Spectroscopy</strong> to a new level of performance. Featuring <strong>Andor</strong>’s<br />
market leading TE cooling to -100ºC, Ultravac TM vacuum technology, Quantum Efficiency<br />
up to 95% and sub-electron read noise with on-chip Electron-Multiplying amplification,<br />
Newton EM and iXon cameras offer the absolute combination of sensitivity and acquisition<br />
speed.<br />
Page 16<br />
Professor Michael Morris<br />
Professor of Chemistry<br />
University of Michigan<br />
“In our lab the <strong>Andor</strong> Newton EM EMCCD has enabled<br />
millisecond Raman <strong>Spectroscopy</strong> and Hyper-spectral<br />
Raman imaging in times as short as a minute or two. And<br />
the 1600 x 400 format is just right for <strong>Spectroscopy</strong>”.<br />
Key applications<br />
• Absorption - Transmission - Reflection<br />
• Raman (244, 532, 633 nm)<br />
• Raman (785 and 833 nm – VP and FI only)<br />
• Fluorescence - Luminescence<br />
• Plasma studies<br />
• Photon counting<br />
• Single molecule <strong>Spectroscopy</strong><br />
See pages 44 & 46<br />
for Raman EMCCD<br />
application notes<br />
See page 54 for<br />
EMCCD for <strong>Spectroscopy</strong><br />
technical note
Features Benefits<br />
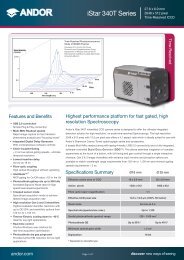
New iStar ICCD<br />
Industry gold standard for high-resolution, high-speed nanosecond<br />
time-resolved spectroscopy.<br />
With over 16 years of Excellence in the development of world-class, fast-gated intensified<br />
CCD cameras, <strong>Andor</strong>’s iStar detectors are at the forefront of rapid, nanosecond timeresolved<br />
<strong>Spectroscopy</strong>. Launched in 2011, <strong>Andor</strong>’s New iStar USB 2.0 platform extracts<br />
the very best from CCD sensor and gated image intensifier technologies, achieving a<br />
superior combination of rapid acquisitions rates and exceptional sensitivity down to single<br />
photon. The New iStar is the most compact research-grade ICCD on the market, with a a<br />
unique software-controlled, ultra-low-jitter on-board Digital Delay Generator (DDG) and<br />
high-voltage, high-speed gating electronics for superior time resolution, shuttering accuracy<br />
and ultra-precise synchronisation.<br />
Page 18<br />
Professor JJ Laserna<br />
Professor of Chemistry<br />
University of Malaga<br />
“The <strong>Andor</strong> iStar ICCD detectors played a vital role in allowing<br />
us to develop this new mobile standoff detection system<br />
since their sensitivity allowed us to work with exceedingly<br />
low light levels. Furthermore, their refresh rates meant we<br />
could analyze spectral information at rates in excess of 10<br />
Hz and, therefore, perform simultaneous Raman and LIBS<br />
<strong>Spectroscopy</strong> in real time”.<br />
Key applications<br />
NEW<br />
• Laser Induced Breakdown<br />
<strong>Spectroscopy</strong> (LIBS)<br />
• Time-Resolved Raman and<br />
Resonance Raman <strong>Spectroscopy</strong> (TR 3 )<br />
• Time-resolved fluorescence -<br />
luminescence<br />
• Plasma studies<br />
• Laser flash photolysis<br />
• Single molecule spectroscopy
QE (%)<br />
30<br />
30<br />
20<br />
20<br />
10<br />
10<br />
Features Benefits<br />
USB 2.0 connectivity Industry-standard plug-and-play, lockable and rugged interface<br />
Seamless multi-camera control from single PC or laptop<br />
5 MHz readout platform Rapid spectral rates for superior dynamic phenomena characterization<br />
Comprehensive binning options -<br />
Crop & Fast Kinetic mode<br />
High-resolution sensors & image<br />
intensifiers<br />
Fully software-customizable binning sequences for highest spectral and<br />
image rates. Greater than 3,400 spectra/s continuous rates, up to 29,000<br />
spectra/s in burst mode<br />
Sharpest images and spectrum definition, 100% fill factor for maximum<br />
signal collection efficiency<br />
High QE Gen 2 & 3 image intensifiers Highest intensifier resolution with QE > 50% and sensitivity up to 1.1 µm<br />
True optical gating < 2 ns Billionth of a second time-resolution for accurate transient phenomena study<br />
Low jitter, on-board digital delay generator Highest gating timing accuracy with lowest propagation delay<br />
Insertion delay as low as 19.1 ns Lowest delay from signal generation to photocathode triggering<br />
Comprehensive triggering interface Software-controlled 3x triggering outputs with 10 ps setup accuracy<br />
Intelligate TM Intelligent and accurate MCP gating for better than 1:10 8 shuttering<br />
efficiency in the UV<br />
500 kHz sustained photocathode gating Maximises signal-to-noise in high repetition rate laser-based applications<br />
Photocathode EBI minimization Dry gas purge interface for further efficient EBI reduction<br />
TE-cooling to -40 o C Efficient minimization of CCD dark current and pixel blemishes<br />
Real-time control interface On-the-fly software control of intensifier gain, gating and 3x outputs trigger<br />
parameters for real-time detection optinization<br />
Photocathode<br />
Gen2 (UW, H-83)<br />
Gen 2 (WE-AGT, -E3)<br />
Gen 2 (W-AGT, -03)<br />
Gen 2 (WR, H-13)<br />
0<br />
200 300 400 500<br />
Wavelength (nm)<br />
600 700 800 900<br />
Type Coverage Peak QE<br />
(typical)<br />
Minimum<br />
gating speed<br />
-03 Gen 2 180-850 nm 18% < 2 ns<br />
-04 Gen 2 180-850 nm 18% < 2 ns<br />
-05 Gen 2 120-850 nm 16% < 5 ns<br />
-13 Gen 2 180-920 nm 13.5% < 50 ns<br />
-63 Gen 3 280-760 nm 48% < 2 ns<br />
-73 Gen 3 280-910 nm 26% < 2 ns<br />
-83 Gen 2 180-850 nm 25% < 100 ns<br />
-93 Gen 3 380-1,100 nm 4% < 3 ns<br />
-A3 Gen 3 280-810 nm 40% < 2 ns<br />
-C3 Gen 3 < 200-910 nm 17% < 2 ns<br />
-E3 Gen 2 180-850 nm 22% < 2 ns<br />
QE (%) %)<br />
100<br />
100<br />
100<br />
100<br />
10<br />
10<br />
10<br />
1<br />
1<br />
0.1<br />
Models Active pixel<br />
matrix<br />
DH320T<br />
(USB 2.0)<br />
DH334T<br />
(USB 2.0)<br />
DH340T<br />
(USB 2.0)<br />
Gen 3 - FL (HVS, -63)<br />
Gen 3 - FL (BGT, -C3)<br />
InGaAs (NIR, -93)<br />
Effective pixel<br />
size (μm)<br />
Gen 3 - FL (EVS, -A3)<br />
Gen 3 - FL (VIH, -73)<br />
0.01<br />
200 300 400 500 600 700 800 900 1000 1100<br />
Wavelength (nm)<br />
Image intensifier choice<br />
[fibre optic taper]<br />
1024 x 256 26 x 26 Ø18 mm [1:1]<br />
Ø25 mm [1:1]<br />
1024 x 1024 13 x 13 Ø18 mm [1:1]<br />
Ø25 mm [1.5:1]<br />
2048 x 512 13.5 x 13.5 Ø18 mm [1:1]<br />
Ø25 mm [1:1]<br />
See page 48<br />
for stand-off LIBS<br />
application note<br />
Page 19
Spectrographs<br />
<strong>Andor</strong> technical know-how extends far beyond market-leading<br />
performance detectors with a comprehensive range of high-end<br />
Spectrographs. At the heart of this portfolio is the Shamrock<br />
family, which offers ultimate flexibility and performance with its<br />
“out-of-the-box”, pre-aligned and pre-calibrated approach and<br />
seamless combination with <strong>Andor</strong>’s highly sensitive<br />
<strong>Spectroscopy</strong> cameras. The Mechelle 5000 is <strong>Andor</strong>’s<br />
dedicated detection solution for LIBS, offering a unique<br />
combination of 750 nm band-pass with high optical<br />
resolution in one single acquisition.<br />
Shamrock 163<br />
Rugged, compact 163 mm focal length manual spectrograph,<br />
highly configurable for general, everyday lab <strong>Spectroscopy</strong>.<br />
Shamrock 303i<br />
Laboratory workhorse platform with plug-and-play USB<br />
interface, fully motorized grating turret, slits and filter wheel<br />
and imaging-optimized optics for multi-track spectral<br />
acquisition.<br />
Shamrock 500i<br />
Ideal combination of high spectral resolution, imaging<br />
capabilities for multi-track acquisitions and monochromator<br />
capabilities with single point detector use for detection up<br />
to 12 μm. With the convenience of a USB controlled, fully<br />
motorized platform and accessory range.<br />
Page 20<br />
Shamrock 750<br />
Delivers the highest spectral resolution of the Shamrock range<br />
while also featuring monochromator capabilities and<br />
plug-and-play, fully motorized interface.<br />
Mechelle 5000<br />
Patented optical echelle design with band-pass ranging from<br />
200 nm to 975 nm and resolution power λ/Δλ of 5000 across<br />
the full wavelength range, all accessible in a single acquisition<br />
without the need for moving components.
Applications<br />
Shamrock<br />
163<br />
Shamrock<br />
303i<br />
Shamrock<br />
500i<br />
Shamrock<br />
750<br />
Absorption - Transmission - Reflection ü ü ü ü<br />
Photoluminescence - Fluorescence ü ü ü ü<br />
Raman (SERS, SORS, CARS, Stimulated) ü ü ü ü<br />
Micro-Raman and Micro-Fluorescence ü ü ü ü<br />
Photon Counting ü ü ü ü<br />
Single Molecule <strong>Spectroscopy</strong> ü ü ü ü<br />
Mechelle<br />
5000<br />
LIBS ü ü ü ü ü<br />
Plasma Studies ü ü ü ü ü<br />
Multi-track <strong>Spectroscopy</strong> ü ü ü ü<br />
Optimum<br />
Page 21
Shamrock 163<br />
Versatile compact benchtop spectrograph<br />
The Shamrock 163 is the most compact research-grade Czerny-Turner spectrograph on<br />
the market. Its 163 mm focal length, high F/3.6 aperture and wide range of seamlessly<br />
interchangeable gratings, slits and light coupling accessories make it the ideal tool for<br />
general benchtop <strong>Spectroscopy</strong> measurements.<br />
Page 22
Key applications<br />
• Absorption - Transmission - Reflection<br />
• Fluorescence - Luminescence<br />
• Micro-Fluorescence<br />
• Photon counting<br />
• Single molecule <strong>Spectroscopy</strong><br />
• Plasma studies<br />
• Radiometry<br />
Features Benefits<br />
Compact & rugged design with horizontal and<br />
vertical mounting positions<br />
Portability & ease of integration<br />
Imaging-configurable platform Lens-based accessories enable multi-track <strong>Spectroscopy</strong><br />
Wide range of interchangeable gratings<br />
for optimization of wavelength range and<br />
resolution<br />
Variety of fixed slits for optimization<br />
of resolution<br />
Simple precision locking mechanism for seamless upgradability<br />
Interchangeable laser-cut precision slits from 10 to 200 μm<br />
Large choice of light coupling interfaces Includes fibre-optics and C-mount microscope couplers<br />
Calibrated micrometer drive for wavelength<br />
tuning<br />
See page 31 for<br />
accessory tree<br />
Simple & rapid wavelength adjustment<br />
Spectrograph specifications<br />
Aperture ratio (F/#) F/3.6<br />
Focal length (mm) 163<br />
Reciprocal dispersion 4.22 nm/mm<br />
Resolution 0.17 nm †<br />
Band pass 117 nm †<br />
Mechanical range 0 - 1401 nm †<br />
Resolution calculator<br />
andor.com/calculators<br />
Gratings Single, interchangeable<br />
Slit sizes Fixed: 10, 25, 50, 75, 100, 200 μm<br />
Adjustable (Manual): 10 μm to 3 mm<br />
Size L x W x H 198 x 216 x 96 mm<br />
7.8 x 8.5 x 3.8 in.<br />
Weight kg [Ib] 3.5 [7.71]<br />
† = Nominal values using 1200 l/mm grating, 13.5 μm pixel and<br />
27.6 mm wide sensor, 500 nm central wavelength.<br />
Page 23
Shamrock 303i, 500i and 750<br />
Research grade high performance spectrographs<br />
The Shamrock 303i, 500i and 750 imaging spectrographs are research-grade, high<br />
performance and rugged platforms designed for working with demanding low-light<br />
applications, but equally suited to routine measurements. The Shamrock series boasts a<br />
range of highly versatile accessories and are seamlessly configurable.<br />
These instruments can be integrated with <strong>Andor</strong>’s world-class range of CCDs, Electron-<br />
Multiplying CCDs and Intensified CCDs to offer versatile, yet the most sensitive modular<br />
solutions on the market. <strong>Andor</strong> Solis software offers the most user-friendly and state-ofthe-art<br />
real-time control of detectors, spectrograph and motorized accessories at the touch<br />
of a button.<br />
Page 24
Features Benefits<br />
Pre-aligned, pre-calibrated detector &<br />
spectrograph systems<br />
Image astigmatism correction with<br />
toroidal optics (303i & 500i)<br />
Motorized, individually factory-calibrated systems – out of the box<br />
operation and seamless integration to experimental set-ups<br />
Maximum light throughput and optimized multi-track capabilities<br />
USB 2.0 interface “Plug and play” connectivity, ideal for laptop operation alongside multi<br />
USB camera control<br />
Triple exchangeable grating turret Interchangeable in the field<br />
Double detector outputs For extended wavelength coverage when combining <strong>Andor</strong> UV-VIS<br />
CCD and InGaAs cameras<br />
Wide range of accessories available The ultimate in modular set-up and in-field upgradability, including:<br />
• Motorized slits and filter wheel<br />
• Microscope interfaces<br />
• Shutters<br />
• Fibre-optic and lens couplers<br />
• Multi-way fibre-optic bundles<br />
• Light sources and optics<br />
Monochromator capabilities<br />
(500i and 750)<br />
Extract best optical resolution while allowing use of single point<br />
detectors with sensitivity up to 12 μm<br />
Gold and silver optics coating options Most efficient for NIR detection when used in conjunction with <strong>Andor</strong><br />
InGaAs cameras and single point detectors<br />
Resolution calculator<br />
andor.com/calculators<br />
See page 30 for<br />
accessory tree<br />
Key applications<br />
• Absorption - Transmission - Reflection (UV-NIR and SWIR)<br />
• Raman (244, 532, 785, 833 and 1064 nm)<br />
• Fluorescence - Luminescence (UV-NIR and SWIR)<br />
• Micro-Raman and Micro-Fluorescence<br />
• Photon counting<br />
• Single molecule <strong>Spectroscopy</strong><br />
• Plasma studies<br />
• Laser Induced Breakdown <strong>Spectroscopy</strong> (LIBS)<br />
Spectrograph specifications comparison* 303i 500i 750<br />
Aperture (F/#) F/4 F/6.5 F/9.8<br />
Focal length (mm) 303 500 750<br />
Reciprocal dispersion (nm/mm) 2.41 1.44 1.01<br />
Wavelength resolution (nm) 0.10 0.06 0.04<br />
Bandpass (nm) 67 40 28<br />
Multi-track capability Y Y Y<br />
* = Specifications given for a 1200 l/mm grating at 500 nm, 10 μm slit and 13.5 μm pixel size, 27.6 mm wide CCD ; resolution figures assume FWHM of 5x 13.5 μm pixels.<br />
Page 25
Mechelle 5000<br />
High band pass echelle spectrograph<br />
<strong>Andor</strong>’s Mechelle 5000 spectrograph has been designed to provide simultaneous<br />
recording of a wide wavelength range (200 - 975 nm) in one acquisition. It has no moving<br />
components and is available in a pre-aligned detector/spectrograph format.<br />
Based on the echelle grating principle, its patented optical design provides extremely low<br />
crosstalk and maximum resolution compared with other spectrographs. It is designed to<br />
operate with both <strong>Andor</strong>’s iKon CCD camera and the New iStar DH334T intensified camera<br />
in applications such as LIBS and plasma studies.<br />
Key applications<br />
Page 26<br />
• Laser Induced Breakdown<br />
<strong>Spectroscopy</strong> (LIBS)<br />
• Plasma studies
Echellogramme Example of Mercury-Argon spectrum<br />
Features Benefits<br />
Compact and robust design with no<br />
moving components<br />
Ideal for non-lab based applications<br />
Patented optical design Ensures maximum resolution and extremely low cross-talk<br />
Auto-temperature correction Corrects for the variation of prisms optical refractive index with<br />
temperature<br />
N 2 purged Enables maximum throughput in the UV region<br />
Pre-aligned detector/spectrograph solution Enables fast and efficient experimental set-up<br />
Low F/number Highly efficient light collection<br />
Wide range of accessories available Including fibre optics, slits, aiming laser, collector/collimator and<br />
calibration lamps<br />
Peak labelling with NIST table Easy tagging of known atomic species at the press of a button<br />
View user publications at<br />
andor.com/publications<br />
Spectrograph specifications<br />
Wavelength range (nm) 200 - 975<br />
Focal length (mm) 195<br />
Aperture F/7<br />
Spectral resolution (λ/Δλ)<br />
(corresponding to 3 pixels FWHM)<br />
6,000<br />
Wavelength accuracy Better than ± 0.05 nm<br />
Optical adjacent order cross talk Better than 1 x 10 -2<br />
Stray light Better than 1.5 x 10 -4<br />
Horizontal magnification 0.81<br />
Vertical magnification 1.66<br />
Page 27
Accessories and systems<br />
“Modularity” is <strong>Andor</strong>’s ethos when it comes to <strong>Spectroscopy</strong> systems,<br />
because every researcher’s requirements are unique. This translates into<br />
the need for an extensive range of state-of-the-art accessories, from<br />
light collection to signal analysis and detection. <strong>Andor</strong> combines over<br />
20 years of expertise in the fields of optics, mechanics and electronics,<br />
from designing complex interfaces to extract the very best of its market<br />
leading detectors and spectrographs, to working alongside key suppliers<br />
worldwide.<br />
The result is <strong>Andor</strong>’s ability to offer a comprehensive range of high performance dedicated or extremely versatile<br />
accessories, ranging from multi-cord fibre optics to sample chamber, light sources, gratings, slits and third party<br />
instruments interfaces including microscope and VUV monochromators.<br />
Spectral information tailoring<br />
Selection of low and high density gratings with blazing from<br />
UV to NIR, interchangeable fixed, manual and motorized<br />
slits, mechanical shutters and filter wheel that accommodate<br />
neutral density, Raman edge and long/short pass types.<br />
Fibre optic<br />
Multi-leg fibre ferrules “round-to-line” configurations, for<br />
maximum light collection along spectrograph entrance slit<br />
and multi-channels simultaneous acquisition with imagingoptimized<br />
spectral instruments.<br />
Light sources<br />
Spectral calibration lamps including “pen-ray” style<br />
Mercury, Argon, Neon or Xenon lamps, and Deuterium and<br />
Xenon arc lamps for radiometric calibration or absorption<br />
measurements.<br />
Page 28<br />
Signal input coupling interfaces<br />
Range of opto-mechanical couplers including fibre optics<br />
X-Y adjusters, F/number matchers, sample chamber and<br />
UV to NIR-optimized lenses. <strong>Andor</strong>’s portfolio for modular<br />
Micro-<strong>Spectroscopy</strong> includes C-mount compatible flanges,<br />
wide-aperture slit, modular cage systems and a range of<br />
microscope feet for optical height matching.<br />
Spectrograph/monochromator accessories<br />
Family of single point detectors used in conjunction with<br />
<strong>Andor</strong> Shamrock 500i and 750 for acquisition from UV with<br />
PMTs and silicon photodiode to LWIR (up to 12 μm) region<br />
with InSb and MCT sensors.
See page 30 for<br />
accessory trees<br />
See page 31 for<br />
grating selection<br />
See page 32 for<br />
fibre optics<br />
See page 34 for<br />
Microspectroscopy<br />
Page 29
Spectrograph accessories configurations<br />
Access to an unlimited range of detection system configurations is the basis of <strong>Andor</strong>’s<br />
modular approach to <strong>Spectroscopy</strong>. That is why <strong>Andor</strong> is continuously and dynamically<br />
expanding its range of field-upgradable accessories to meet the ever-growing demand<br />
from researchers. This now includes enhanced options for combining Microscopy &<br />
<strong>Spectroscopy</strong>.<br />
Looking for light coupling interfaces to <strong>Andor</strong> spectrographs? Have an instant view of all standard accessories and just follow<br />
the configuration trees for compatibility check.<br />
Can’t see exactly what you are looking for? Want a grating with different groove density or different blaze angle, FC connection<br />
instead of SMA or custom light coupling between microscope an spectrograph? <strong>Andor</strong>’s experienced and dedicated Customer<br />
Special Request (CSR) team will be eager to discuss your specific needs.<br />
Page 30<br />
Shamrock 303i, 500i, 750<br />
Spacer<br />
F-mount<br />
adapter<br />
Motorized<br />
slit<br />
Newport Oriel<br />
flange adapter<br />
Filter wheel<br />
assembly<br />
Motorized wide<br />
aperture slit<br />
(303i only)<br />
F/# matcher<br />
XY ferrule<br />
fibre adapter<br />
F-mount lens<br />
Shamrock 303i, 500i and 750 accessory tree overview<br />
Fast kinetics<br />
fibre adapter<br />
Motorized slit<br />
cover plate<br />
Optical cage<br />
system adapter<br />
SMA adapter for<br />
F/# matcher<br />
Raman edge filters<br />
Neutral density filters<br />
Long pass filters<br />
Short pass filters<br />
Fixed SMA<br />
fibre adapter<br />
X adjustable<br />
fibre adapter<br />
SMA single<br />
fibre<br />
C-mount<br />
adapter<br />
Fixed FC fibre<br />
adapter<br />
SMA single<br />
fibre<br />
Cage system<br />
Specification sheets<br />
andor.com/spectroscopy<br />
“Round to line“<br />
fibre optic<br />
Fixed fibre<br />
adapter<br />
FC single<br />
fibre<br />
C mount<br />
relay lens<br />
Sample<br />
chamber<br />
Cage system -<br />
microscope flange<br />
C mount lens<br />
Resolution calculator<br />
andor.com/calculators
Shamrock 163<br />
Fixed slit<br />
holder<br />
Adjustable<br />
slit<br />
Fixed slit<br />
Shamrock 163 accessory tree overview<br />
Shutter<br />
assembly<br />
Fibre adapter<br />
C-mount<br />
adapter<br />
C-mount<br />
lens<br />
Filter holder<br />
Fixed SMA<br />
fibre adapter<br />
Have you found what you are looking for?<br />
Slit adapter<br />
Fibre ferrule<br />
SMA fibre<br />
Raman edge filters<br />
Neutral density filters<br />
Long pass filters<br />
Short pass filters<br />
<strong>Andor</strong> offers a large variety of additional grating options, i.e. groove density and blaze. Please contact your local representative<br />
to discuss your specific needs.<br />
Page 31
Page 32<br />
Fibre optics solutions<br />
Fibre optic is one of the most convenient ways to<br />
collect and transport light from an experimental<br />
set-up to a spectrograph-based detection<br />
solution. <strong>Andor</strong>’s series of “round-to-line”, multicore<br />
fibre optic bundles maximises the signal<br />
collection by positioning the multiple cores<br />
alongside the spectrograph entrance slit. <strong>Andor</strong><br />
works with industy leading manufacturers to<br />
deliver solutions to meet any user requirements.<br />
Features<br />
• UV-Vis and Vis-NIR optimized options<br />
• Numerical Aperture = 0.22<br />
• 100 and 200 μm fibre core options<br />
• From 1 to 5 leg options as standard<br />
• Standard SMA connectors to Ø 11 mm<br />
<strong>Andor</strong> ferrule<br />
• 2 m overall length – setup convenience and<br />
minimum transmission losses<br />
• Re-enforced shield and ruggedised connectors<br />
• Compatible with <strong>Andor</strong> Shamrock F/number<br />
matchers and X-Y adjusters
Generic fibre optic bundle configuration<br />
Fibre reference Number of legs Fibre core<br />
diameter<br />
Optimized wavelength region Number of fibre<br />
cores per leg<br />
SR-OPT-8002 1 way 100 μm VIS-NIR (LOH) 19 2.38 2.38 -<br />
SR-OPT-8007 2 way 100 μm VIS-NIR (LOH) 7 2.95 0.875 1.2<br />
SR-OPT-8008 4 way 100 μm VIS-NIR (LOH) 3 5.625 0.375 1.375<br />
SR-OPT-8009 5 way 100 μm VIS-NIR (LOH) 3 5.375 0.375 0.875<br />
SR-OPT-8013 3 way 100 μm VIS-NIR (LOH) 7 5.625 0.875 1.50<br />
SR-OPT-8014 1 way 100 μm UV-VIS (HOH) 19 2.38 2.38 -<br />
SR-OPT-8015 2 way 100 μm UV-VIS (HOH) 7 2.35 0.875 1.2<br />
SR-OPT-8016 3 way 100 μm UV-VIS (HOH) 3 5.625 0.875 1.5<br />
SR-OPT-8017 4 way 100 μm UV-VIS (HOH) 3 5.625 0.375 1.375<br />
SR-OPT-8018 5 way 100 μm UV-VIS (HOH) 3 5.375 0.375 0.875<br />
SR-OPT-8019 1 way 200 μm VIS-NIR (LOH) 19 4.66 4.66 -<br />
SR-OPT-8020 2 way 200 μm VIS-NIR (LOH) 7 5.43 1.745 2.0<br />
SR-OPT-8021 3 way 200 μm VIS-NIR (LOH) 3 5.635 0.735 1.715<br />
SR-OPT-8022 4 way 200 μm VIS-NIR (LOH) 3 5.88 0.735 1.715<br />
SR-OPT-8024 1 way 200 μm UV-VIS (HOH) 19 4.66 4.66 -<br />
SR-OPT-8025 2 way 200 μm UV-VIS (HOH) 7 5.43 1.715 2.0<br />
SR-OPT-8026 3 way 200 μm UV-VIS (HOH) 3 5.635 0.735 1.715<br />
SR-OPT-8027 4 way 200 μm UV-VIS (HOH) 3 5.88 0.735 1.715<br />
a = Total fibre optic bundle height b = Individual channel height (live fibres)<br />
c = Spacing between individual channels (dead fibres)<br />
Have you found what you are looking for?<br />
Need a different fibre core size? A longer overall cable? FC connectors? Additional channels / legs? Please contact your local<br />
<strong>Andor</strong> representative to discuss your specific needs.<br />
a<br />
(mm)<br />
b<br />
(mm)<br />
c<br />
(mm)<br />
Page 33
Micro<strong>Spectroscopy</strong><br />
Modular approach to combined Microscopy and <strong>Spectroscopy</strong><br />
Adding structural and chemical spectral analysis to Microscopy images of bio-samples<br />
such as cells and proteins, or materials such as polymers or semi-conductors, is an ever<br />
increasing demand amongst the research community. <strong>Andor</strong>’s range of modular interfaces<br />
feature cage systems couplers, allowing endlessly configurable connections between<br />
<strong>Andor</strong> Shamrock spectrographs and a wide range of market leading microscopes such as<br />
Nikon, Olympus and Zeiss. The Shamrock “wide-aperture” slit opens the door to a single<br />
setup with a single detector to image the sample, whilst allowing spectral information<br />
collection through the same optical path from the microscope.<br />
Key applications<br />
Page 34<br />
“From sample imaging to analytical information”<br />
• Micro-Raman<br />
• Micro-Fluorescence - Luminescence<br />
• Micro-LIBS
A: Shamrock spectrograph<br />
B: CCD or EMCCD detector<br />
C: Filter wheel (optional)<br />
D: Wide-aperture slit<br />
E: C-mount adapter (spectrograph)<br />
F: Relay optics (microscope dependant)<br />
G: C-mount interface (microscope)<br />
H: Feet for optical height matching<br />
I: Microscope<br />
Features Benefits<br />
B<br />
A<br />
C-mount interfaces Seamless integration of Shamrock spectrograph-based systems to market leading<br />
upright and inverted microscopes<br />
Microscope feet Microscope left or right inverted output options – matches precisely Shamrock<br />
spectrograph optical height for accurate opto-mechanical coupling<br />
Wide-aperture slit Up to 12 mm field of view - <strong>Andor</strong>’s imaging-optimized spectrographs allow high<br />
quality sample image relay, without compromise in spectral information collection<br />
through the same optical channel<br />
Thorlabs or Linos cage<br />
systems compatible<br />
interfaces<br />
F<br />
C<br />
Fully user-configurable optical setups for Micro-Luminescence and Micro-Raman –<br />
compatible with 16, 30 and 60 mm versions<br />
EMCCD compatible <strong>Andor</strong> Newton EM and iXon platforms offer a unique combination of single photon<br />
sensitivity and high spectral rate & frame rate for challenging low-light <strong>Spectroscopy</strong><br />
Software Development Kit Enables seamless integration with third party hardware and SDK under Labview, C/<br />
C++ and Visual Basic<br />
Microscope feet for use with Shamrock :<br />
Microscope configuration 303i based systems 500i & 750 based systems Microscope to cage system adapter<br />
Leica DMI4000 / 6000 B<br />
Left side port TR-LCDM-MNT-127-LP TR-LCDM-MNT-146-LP<br />
Right side port<br />
Nikon Eclipse Ti-E<br />
TR-LCDM-MNT-127-RP TR-LCDM-MNT-146-RP<br />
Left side port TR-NKTI-MNT-127-LP TR-NKTI-MNT-146-LP<br />
Right side port<br />
Nikon TE-2000<br />
TR-NKTI-MNT-127-RP TR-NKTI-MNT-146-LP<br />
Left side port TR-NK2K-MNT-127-LP TR-NK2K-MNT-146-LP<br />
Right side port<br />
Olympus IX71/81<br />
TR-NK2K-MNT-127-RP TR-NK2K-MNT-146-RP<br />
Left side port<br />
Zeiss Axiovert 200<br />
TR-OLIX-MNT-127-LP TR-OLIX-MNT-146-LP<br />
Left side port TR-ZSAV-MNT-127-LP TR-ZSAV-MNT-146-LP<br />
Right side port<br />
Zeiss Axio Observer<br />
TR-ZSAV-MNT-127-RP TR-ZSAV-MNT-146-RP<br />
Left side port TR-ZAXO-MNT-127-LP TR-ZAXO-MNT-146-LP<br />
Right side port TR-ZAXO-MNT-127-RP TR-ZAXO-MNT-146-RP<br />
D<br />
E<br />
F<br />
G<br />
H<br />
I<br />
TR-LCDM-CAGE-ADP<br />
TR-NKTI-CAGE-ADP<br />
TR-NK2K-CAGE-ADP<br />
TR-OLIX-CAGE-ADP<br />
TR-ZSAV-CAGE-ADP<br />
TR-ZAXO-CAGE-ADP<br />
Page 35
Scanning Accessories<br />
Perfect complement to <strong>Andor</strong>’s multi-channel detector portfolio<br />
This latest addition to our <strong>Spectroscopy</strong> portfolio provides a perfect complement to<br />
<strong>Andor</strong>’s extensive range of market leading CCD, ICCD, InGaAs and EMCCD detectors.<br />
Shamrock spectrograph double detector output configurations allow detection from 180<br />
nm to 12 μm with one single setup. Solis Scanning software platform provides a dedicated<br />
single interface for seamless parametring and synchronising of single point detectors,<br />
spectrographs, data acquisition unit and lock-in amplifiers, with an intuitive interface for<br />
complex experiment acquisition sequences.<br />
Page 36<br />
Specification sheets<br />
andor.com/spectroscopy
Shamrock 500i / 750<br />
MCT with<br />
LN 2 Dewar<br />
Features Benefits<br />
Wide range of single point<br />
detectors<br />
Seamless integration with<br />
Shamrock spectrographs<br />
Gold/silver optics coating<br />
options<br />
InSb with<br />
LN 2 Dewar<br />
Data aquisition<br />
unit<br />
Selection of PMTs, silicon photodiode, InGaAs, PbS, InSb and MCT detectors for<br />
sensitivity up to 12 μm<br />
All detectors include Shamrock flange for easy opto-mechanical coupling<br />
Ensures monochromator maximum throughput in the infrared region of the<br />
spectrum – MCT and InSb detectors include gold-coated focusing optics for<br />
maximum detection efficiency<br />
Dedicated software interface Individual set-up interface for SPD, HV power supplies, photon counting and data<br />
acquisition units , lock-in amplifiers and monochromators<br />
Experiment builder interface for complex experiments involving sequential selection<br />
of gratings, filters or monochromators<br />
Dedicated GUI for data display and manipulation, including mathematical operators<br />
and FFT options<br />
3 acquisition modes Versatile interface for scanning monochromator, time-resolved and photon counting<br />
USB 2.0 connectivity Plug-and-play data acquisition unit – allows connection to laptops alongside USBcontrolled<br />
Shamrock monochromators<br />
Part reference Detector type Wavelength coverage Active area (mm) Cooling<br />
ACC-SR-ASM-0042 MCT * 2-12 μm 1 x 1 LN 2<br />
ACC-SR-ASM-0043 InSb * 1-5.5 μm Ø2 LN2 ACC-SR-ASM-0045 PbS 0.8-2.9 μm 4 x 5 Room temperature<br />
ACC-SR-ASM-0044 InGaAs 0.8-1.9 μm Ø3 -40ºC TE cooling<br />
ACC-SR-ASM-0046 Si 200-1100 nm Ø11.28 Room temperature<br />
ACC-SR-ASM-0047 PMT (R928) 185-900 nm 8 x 24 Room temperature<br />
ACC-SR-ASM-0048 PMT (R1527P) 185-680 nm 8 x 24 Room temperature<br />
* Including gold-focusing mirror for maximum signal collection<br />
Part reference Function Features<br />
ACC-SR-ASZ-0053 HV power supply for PMT 0 to 1.5 kV software-controlled range for PMT gain adjustment<br />
ACC-SR-ASZ-0054 Photon counting unit for PMT Software-selectable discrimination thresholds<br />
ACC-SR-ASZ-0055 Data acquisition unit USB 2.0 interface, includes 2x SPD acquisition channels, 2x analog outputs<br />
for PMT HV power supply control and connections to lock-in amplifiers **<br />
Chopper<br />
** Recommended models include SRS SR830 with associated SR540 chopper<br />
PbS<br />
Lock-in<br />
amplifier<br />
PMT<br />
broadband<br />
PMT visible<br />
optimized<br />
High voltage<br />
PSU<br />
InGaAs<br />
Si<br />
Photon<br />
counting unit<br />
TE cooling<br />
PSU<br />
Page 37
Application notes and technical<br />
discussions – <strong>Andor</strong> in action<br />
With over 50,000 users worldwide <strong>Andor</strong> products are represented<br />
in all the major universities, helping researchers to achieve key<br />
advances and discoveries by offering cutting-edge <strong>Spectroscopy</strong><br />
systems based on the latest technologies available. The result<br />
is a great breadth of exciting applications, collaborations and<br />
testimonials across researchers’ publications which <strong>Andor</strong> is<br />
extremely proud to share with the scientific community.<br />
Innovative techniques and cutting edge research:<br />
• Magneto-Photoluminescence – iXon3 897 and Shamrock 303i combine for high-speed and<br />
high sensitivity silicon nanocrystals study<br />
• Near-Infrared Photoluminescence – iDus InGaAs 490-1.7 and characterization of single<br />
semiconductor quantum wires<br />
• Raman Flow-Cytometry – Newton EM and an innovative approach to rapid cells<br />
characterization and sorting<br />
• Tip-Enhanced Raman <strong>Spectroscopy</strong> – iDus, Microscopy and AFM combine for label free<br />
chemical analysis of biofilms nanostructures<br />
• Stand-off Laser Induced Breakdown <strong>Spectroscopy</strong> – iStar 740 and Shamrock 303i in-the-field for<br />
remote explosive residue analysis<br />
Technical discussions – Making sense of sensitivity:<br />
• Detector sensitivity – Key contributing factors and signal-to-noise ratio analysis<br />
• What is the value of LN 2 versus Thermo-Electric cooling for CCDs and InGaAs?<br />
Considerations and facts<br />
• Electron-Multiplying CCD technology for <strong>Spectroscopy</strong> – how to achieve ultra-fast and<br />
ultra-sensitive <strong>Spectroscopy</strong> detection<br />
Page 38<br />
Application & learning centre<br />
andor.com/learning<br />
View user publications at<br />
andor.com/publications
Have you found what you are<br />
looking for?<br />
Cannot see your publications referenced when your work involved<br />
<strong>Andor</strong> equipment? Are you interested to put forward some of your key<br />
innovations and results? Do you have spectacular images, movies or<br />
posters you would be keen to share? Interested in collaboration work<br />
around a particular application? Our team of application specialists will<br />
be eager to discuss your ideas.<br />
Page 39
Application Note<br />
Magneto-PL unveils photoluminescence in<br />
Si nanocrystals<br />
Silicon (Si) as a material has dominated the field of microelectronics for quite some time,<br />
but when it comes to photonic devices it has had little impact due to its poor light emitting<br />
properties. However, nano-structured Si shows a marked increase in light emission<br />
efficiency; this was initially observed in porous Si, and more recently in Si nanocrystals.<br />
Explanation of the source of this light emission has been strongly<br />
debated over the last two decades, with two possible sources being<br />
suggested – a) the influence of localized structural defects and b)<br />
the effects of Quantum Confinement (QC) within the nanostructure.<br />
Work reported by Dr Manus Hayne and co-workers in Nature<br />
Nanotechnology [1, 2], has given much insight into the underlying<br />
mechanisms. Using an elegant technique based around magnetophotoluminescence<br />
(magneto-PL), they were able to distinguish<br />
between the two mechanisms by a cycle of measurements on ascrystallized<br />
samples. This was followed by passivation of defects with<br />
hydrogen, and the subsequent reintroduction of defects by removal of<br />
the hydrogen. A key enabler to their work was the ability to measure<br />
the very weak PL signals using the high sensitivity detection capability<br />
offered by Electron Multiplication (EM) technology.<br />
The quest for silicon-based photonic devices continues unabated with<br />
the ultimate goal of seamless integration of photonic devices, such as<br />
sensors or light emitters, and the associated digital data-processing<br />
electronics. Currently most photonic devices are based on III-V<br />
and II-VI semiconductors, whilst all digital electronics are silicon<br />
based. This leads to challenges and limitations when it comes to the<br />
integration of the different technologies in one system. One example<br />
is the use of optical interconnects from chip-to-chip and board–toboard<br />
in electronic systems. The emission of light from silicon<br />
nanocrystals has given hope to the developments of fully integrated<br />
systems based on one material technology. Hayne and co-workers<br />
at Lancaster University, Albert Ludwigs University in Freiburg, the<br />
Katholieke Universiteit Leuven, and the University of Antwerp set<br />
out to understand the fundamental mechanisms underlying this light<br />
emission.<br />
A schematic of the experimental set up used by the team is shown in<br />
figure 1. The samples consisted of Si nanocrystals – typical diameter<br />
of ~3 nm – embedded in SiO 2 , formed by annealing of SiO/SiO 2<br />
layers on Si substrates. Characterization was carried out using high<br />
resolution TEM (HR-TEM) imaging, electron spin resonance (ESR)<br />
analysis and magneto-PL. PL spectra consisted of broad Gaussian<br />
emissions, typically peaked around 1.61 eV (~770 nm with FWHM<br />
bandpass of ~130 nm) (see figure 2 inset). Samples were mounted<br />
in a cryostatic stage to enable cooling down to 85 K, and a magnetic<br />
field, of varying peak field up to 50 T, was applied perpendicular to<br />
the plane of the sample (figure. 1). Excitation light in the UV was<br />
delivered to the sample via optical fibres which included a bandpass<br />
filter to reduce background fluorescence from the fibres. The emitted<br />
light was collected into a bundle of fibres and delivered to a 0.3 m<br />
(Shamrock 303i) spectrograph with an EMCCD camera (iXon3<br />
DV897-FI). EM gain was set on the camera to enable and optimize<br />
measurement of the signal, with a typical exposure time of 5 ms.<br />
Page 40<br />
In their magneto-PL technique, the application of a high magnetic<br />
field is used to manipulate the confinement effects on the free carriers<br />
within the nanocrystal [3]. As a consequence of this field-induced<br />
‘squeezing’ of the electrons, a characteristic shift in the wavelength<br />
of the light emitted from quantum confinement states should be<br />
observed; the higher the field, the higher the PL energy. However,<br />
electrons associated with highly localized defects with a characteristic<br />
confinement
Optical<br />
probe<br />
Pick-up coil<br />
Collection fibres<br />
Laser fibre<br />
Sample<br />
Cryostat<br />
Ar-ion laser (351 nm)<br />
Figure 1: Schematic of experimental set-up at Katholieke Universiteit Leuven,<br />
Belgium. The samples were mounted in a cryostat (middle) where they were<br />
cooled to 85K. High magnetic fields were applied across the samples as<br />
illustrated in the typical characteristic (lower right). The acquisition of the<br />
PL signal was timed to coincide with the peak of the applied magnetic field<br />
illustrated by the grey bar. The excitation laser was delivered through an optical<br />
fibre (top left) and the resultant PL signal was fed via collection fibres into a<br />
remotely located Shamrock spectrograph with iXon3 detector.<br />
LN 2<br />
Magnet<br />
Shamrock<br />
Optics PC<br />
Figure 2: Shift of the photoluminescence<br />
(PL) energy for the passivated sample in<br />
which there is quantum confinement. The<br />
inset shows typical spectrum before (ascrystallized)<br />
and after passivation. Note that<br />
the PL shift with field is only 1.5 meV and the<br />
line width is 300 meV (Courtesy Dr M Hayne,<br />
Lancaster University).<br />
Acknowledgement: Graphs courtesy of Dr Manus Hayne, Lancaster University, England.<br />
Reference material:<br />
1) S. Godefroo, M. Hayne, M. Jivanescu, A. Stesmans, M. Zacharias, O. I. Lebedev, G. Van Tendeloo and V. V. Moshchalkov, ‘Classification<br />
and control of the origin of photoluminescence from Si nanocrystals’, Nature Nanotechnology,Vol. 3, March 2008, 174-178.<br />
2) U. Gosele, ‘Shedding new light on silicon’, Nature Nanotechnology, Vol. 3, March 2008, p134.<br />
3) M. Hayne, J. Maes, S. Bersier, M. Henini, L. Müller-Kirsch, R. Heitz, D. Bimberg and V.V. Moshchalkov, ‘Pulsed magnetic fields as a<br />
probe of self-assembled semiconductor nanostructures’, Physica B, 346-347 (2004), p421-427.<br />
iXon3<br />
Bank<br />
controller PC<br />
Transient<br />
recorder<br />
Page 41
Application Note<br />
NIR micro-photoluminescence characterisation of Single<br />
semiconductor Quantum Wires<br />
Nanoscale structures (quantum dots and quantum wires) are being studied extensively<br />
with a view to building ever more exotic devices, such as more efficient lasers and LEDs,<br />
or quantum information processing components. One type of material under investigation<br />
consists of semiconductor quantum wires based on InAs.<br />
These are being explored because of their near-infrared optical<br />
properties. Work reported by Dr Benito Alén and co-workers [3] on<br />
fundamental studies of isolated InAs nanowires (QWRs) identifies<br />
novel behaviour based around the metal-insulator transition in<br />
correlated electron systems. They made use of NIR photoluminescence<br />
(NIR-PL) to explore the transition dependencies on both excitation<br />
power and temperature.<br />
The analysis of the photoluminescence of individual semiconductor<br />
quantum wires is an invaluable tool to investigate the role played by<br />
attractive and repulsive Coulomb interactions among electrons and<br />
holes confined to one dimension. In these systems, the electronic<br />
and optical properties change dramatically depending on the number<br />
of trapped carriers, but the effect on the emission spectrum can be<br />
obscured if many QWRs with different sizes contribute to the emitted<br />
light. To ascertain the physics behind and confront the experimental<br />
data against existing theories, the photons emitted from just one QWR<br />
must be examined using high spatial resolution techniques and high<br />
sensitivity light detectors. This approach has been demonstrated<br />
for InAs/InP QWRs emitting at 1.5 μm, by researchers in Spain at<br />
the Consejo Superior de Investigaciones Científicas (CSIC) and the<br />
Universidad de Valencia.<br />
The prediction of low threshold for laser emission, reduced<br />
temperature sensitivity, and slow surface recombination velocity<br />
has largely motivated the research on III-V semiconductor QWRs<br />
for optoelectronic applications in recent years. Among them, selfassembled<br />
InAs/InP QWRs can get their spontaneous emission<br />
tuned beyond 1.6 μm and their areal density reduced down to a few<br />
QWRs per square micron [1]. They are therefore ideal candidates<br />
for the fabrication of advanced light sources in the telecom spectral<br />
region [2], and for the study of novel semiconductor physics. As<br />
for the latter, collective phenomena of one-dimensional excitons<br />
have been directly investigated in these nanostructures using NIR<br />
microphotoluminescence (μ-PL) techniques at low temperature, at the<br />
Universidad de Valencia and published by B. Alén et al. in Physical<br />
Review Letters [3].<br />
The system consisted of a fibre-based confocal microscope<br />
arrangement inserted in the exchange gas chamber of an immersion<br />
liquid He cryostat. Excitation light from a 950 nm diode laser was<br />
brought into the microscope through a single mode optical fibre<br />
whose core acted as the excitation pinhole. The laser light was focused<br />
onto the sample through an objective lens (NA=0.55) producing a<br />
diffraction limited spot at the excitation wavelength. Light emitted<br />
Page 42<br />
by the few QWRs present in the excitation spot (see AFM image<br />
in figure 1) was collected by the same objective and focused onto<br />
a different optical fibre which in turn was connected at its opposite<br />
end to a spectrometer equipped with a TE cooled <strong>Andor</strong> iDus InGaAs<br />
(DU490A-1.7) camera. The faint light emitted from the individual<br />
QWRs could be detected using exposure times of 10 to 100 seconds<br />
thanks to the multichannel detection capabilities of the iDus InGaAs<br />
array and low dark current of the cooled array. The samples were made<br />
using self-assembly methods of epitaxially growing InAs structures on<br />
InP (001) substrates under conditions which preferentially led to the<br />
formation of QWRs rather than quantum dots (QDs). Reflection highenergy<br />
electron diffraction (RHEED) and Atomic Force Microscopy<br />
(AFM) analyses were used to characterize the morphology and aspect<br />
ratio of the individual QWRs. These structures were typically 20<br />
nm wide and 200 nm long, corresponding to aspect ratios of ~1:10.<br />
Experiments were carried out to investigate how the samples behaved<br />
with variation in the excitation power, with powers as low as 8 mW<br />
up to 260 mW. They also investigated the temperature dependence.<br />
Fig 1: AFM image of the investigated QWRs (Courtesy Dr B<br />
Alén, CSIC, Madrid)
Typical examples of μ-PL spectra collected on a single QWR as a<br />
function of excitation power density are depicted in figure 2. Due to the<br />
quantum confinement size effect, the different sized QWRs can emit<br />
at different energies, but they show a similar trend with the increasing<br />
photo-generated carrier density. The analysis of the lineshape of<br />
several spectral features observed at low and high excitation allowed a<br />
detailed study of the metal-insulator transition governed by enhanced<br />
Coulomb correlations in these systems. At low powers the sharp<br />
spectral feature at ~0.812 eV (~1528 nm) dominated whilst at high<br />
powers the broad spectral feature centred at ~0.807 eV(~1538 nm)<br />
dominated. This change in PL emission, induced by changes in carrier<br />
density, was indicative of the metal-insulator transition. The spectra<br />
show that the insulating excitonic gas (associated with high energy<br />
peaks – blue) condenses into a metallic-like electron-hole liquid phase<br />
(associated with the low energy band - red), with an increase in carrier<br />
density.<br />
Novel behaviour on the metal-insulator transition within a correlated<br />
electron system, as realized in single InAs/InP QWRs emitting in<br />
the NIR, was clearly demonstrated by Alén and co-workers. They<br />
developed techniques based on μ-PL, which allowed exploration of<br />
the carrier interactions and its dependence on photo-excitation powers<br />
and temperature. These fundamental studies will underpin future<br />
developments of ever more exotic devices such as high efficiency<br />
micro-/nano- lasers and LEDs.<br />
Figure 2. Typical single QWR emission spectra measured at<br />
5 K with increasing excitation power . (Courtesy Dr B Alén,<br />
CSIC, Madrid)<br />
Acknowledgement: Appreciation is gratefully extended to Dr Benito Alén, IMM-CSIC, Madrid and Prof. Juan Martinez Pastor, Universidad<br />
de Valencia, Spain.<br />
Reference material:<br />
1) D. Fuster, B. Alén, L. González, Y. González and J. Martínez-Pastor, “Initial stages of self-assembled InAs/InP(0 0 1) quantum wire<br />
formation”. Journal of Crystal Growth 301 (2007), 705.<br />
2) L. J. Martínez, B. Alén, I. Prieto, D. Fuster, L. González, Y. González, M. L. Dotor, and P. A.Postigo, “Room temperature continuous wave<br />
operation in a photonic cristal microcavity laser with a single layer of InAs/InP self-assembled quantum wires”, Optics Express 17 (2009),<br />
14993.<br />
3) B. Alén, D. Fuster, G. Muñoz-Matutano, J. Martínez-Pastor, Y. González, J. Canet-Ferrer and L. González, “Exciton Gas Compression and<br />
Metallic Condensation in a Single Semiconductor Quantum Wire”, Phys. Rev. Lett. 101 (2008) 067405.<br />
Page 43
Application Note<br />
Raman Spectral Flow Cytometry<br />
A key and continuing goal in the development of flow cytometry techniques is the ability<br />
to measure ever more parameters for each particle under test. Work carried out by Prof<br />
John Nolan’s group at La Jolla Bioengineering Institute, and reported by Watson et. al.<br />
[1] in Cytometry A, outlines the development and operation of a Raman Spectral Flow<br />
Cytometer (RSFC), which is perhaps the most radical and challenging approach to current<br />
efforts in spectral flow cytometry.<br />
In their ‘proof of principle’ system, Watsons’ team bring together<br />
Raman <strong>Spectroscopy</strong>, via Surface Enhanced Raman (SERS), and<br />
conventional flow cytometry, by substituting a dispersive-optic<br />
spectrograph with multichannel detector (CCD), in place of the<br />
traditional mirrors/beam splitters, filters and photomultipliers (PMT)<br />
of conventional flow cytometers. They demonstrate a system of<br />
sufficient sensitivity to acquire and analyze SERS spectra with good<br />
spectral resolution from samples consisting of nanoparticle SERS tags<br />
bound to microspheres. The functionality and power of the system<br />
is illustrated using two analytical methods, virtual bandpass filtering<br />
and principal component analysis (PCA), to distinguish between the<br />
different Raman species within their test samples.<br />
A significant motivation for the group’s work is to increase the<br />
multiplexing capability of cell and particle-based flow cytometry<br />
applications. This requires the ability to access more parallel data<br />
channels from the same sample at the same time. Conventional systems<br />
have been developed to offer higher numbers of simultaneously<br />
measureable parameters. Specially configured systems with up to<br />
19 parameters are available (direct scatter, side scatter and multiple<br />
fluorescence channels) but this requires multiple PMTs, filters, several<br />
lasers, multiple fluorophore labels and wavelength selective mirrors.<br />
The problem that arises with trying to extend such systems to more<br />
channels, apart from the expense and the operating challenges, is the<br />
inherently broad fluorescence characteristics of the fluorophores. As<br />
the number of fluorophore fluorescent bands is increased, the more<br />
overlapping of bands takes place and it becomes increasingly difficult<br />
to distinguish the individual signal channels. This limits the number<br />
of possible data channels.<br />
Having a dispersive-optic based system provides a simpler setup<br />
configuration and the potential for high resolution <strong>Spectroscopy</strong>. The<br />
La Jolla group has chosen Surface Enhanced Raman <strong>Spectroscopy</strong><br />
(SERS), with its characteristically information-rich narrow band<br />
spectral features, as a route to accessing a higher number of<br />
measureable parameters. Two key technologies are being drawn upon<br />
in the development of fresh approaches to flow cytometry. The first,<br />
a), takes advantage of the ability of silver nanoparticles to enhance<br />
the Raman scattering intensity of an active species by many orders of<br />
magnitude, or as in other work, the use of fluorescent nanocrystals, with<br />
their relatively narrow emission bands, as markers of the species of<br />
interest. The second, b), is the development of Electron Multiplication<br />
CCD detectors (EMCCD), with their enhanced sensitivity which is<br />
advantageous when fast spectral rates and short exposure times are<br />
a requirement. Other groups working on spectral flow cytometry are<br />
focusing on fluorescence signatures [2] to characterize the sample.<br />
Page 44<br />
Some of these groups use multianode PMTs or avalanche photodiodes<br />
(APD) rather than CCDs for the detectors.<br />
Figure 1 illustrates the flow cell and the interaction region where the<br />
laser excites the sample particles or cells. A schematic of the RSFC<br />
instrument is shown in figure 2. It shows the main components used:<br />
the laser and its delivery into the flow cell (FC) with focusing optics<br />
(A); the detection of the Rayleigh side scattered signal, collected<br />
by lens optics (C) into an optical fibre (OF) and delivered to a<br />
photomultiplier (PMT); the SERS signal collected (B) and coupled<br />
into an optical fibre connected to a spectrograph with long pass<br />
filter (LP) to eliminate the Rayleigh scatter at the laser wavelength;<br />
a Newton EMCCD camera captured the spectral data; the forward<br />
scattered data was detected with a photodiode (not shown), which also<br />
acted to deliver triggering for acquisitions by the camera.<br />
Their test samples consisted of glass-encapsulated SERS tags<br />
(Ag nanoparticles of ~67 nm diameter, with an absorbed Raman<br />
reporter molecule and encapsulated in glass), bound to the surface of<br />
polystyrene microspheres (3.3 μm diameter with ~8000 nanoparticles<br />
per microsphere). Four different Raman reporters were used in the<br />
preparations, each giving its own characteristic Raman signature:<br />
each microparticle was tagged with one out of the four Raman<br />
reporters. Data was captured for each particle as it passed through the<br />
interaction region (figure 1) in the form of a Raman spectrum, typical<br />
examples of which are shown in figure 3. Clearly there is potential for<br />
a wealth of information from the sharp and highly resolved spectral<br />
features of these spectra compared with the broadband data attainable<br />
with the traditional filter systems or indeed spectral techniques using<br />
fluorescent markers.<br />
Watson et.al. then proceed to demonstrate two powerful methods for<br />
analyzing their data to discriminate between the four different types<br />
of microparticle. The first approach, referred to as ‘virtual bandpass<br />
filtering’, is analogous to the real-time filtering bandpass techniques<br />
of conventional flow cytometry. It offers the possibility to define<br />
‘optical filters’ to select regions from the SERS spectra to emphasize<br />
differences between the four types of particle, leading to the derivation<br />
of a new set of parameters for comparison purposes. A particularly<br />
nice aspect of this method is the flexibility for optimization, by both<br />
readjustment of the virtual bandpass regions and defining the number<br />
of new parameters to be used. However, Watson et.al. point out that<br />
this approach becomes complex and cumbersome, as the number of<br />
SERS tags increases, with their associated density and overlap of<br />
spectral features.
The second method they used to distinguish the four SERS tags<br />
was that of Principal Component Analysis (PCA). PCA was applied<br />
to the first order derivative that was calculated from the smoothed<br />
and normalized SERS spectra; the ability to discriminate between<br />
different SERS tags, with this advanced and well established analysis<br />
technique, was clearly demonstrated.<br />
The use of a spectrograph with spectral deconvolution algorithms has<br />
the potential for a more comprehensive and flexible approach to multicolor<br />
or multiparameter analysis. The La Jolla group has developed<br />
such a system as a new addition to the tools of flow cytometry, the<br />
Raman Spectral Flow Cytometer (RSFC). Challenges remain in terms<br />
of speed and sensitivity whilst maintaining good resolution. Advances<br />
in camera acquisition rates and digital processing speeds will enable<br />
faster analysis rates – a key requirement of modern flow cytometry.<br />
The coming years will see these challenges being addressed; the<br />
potential benefits as regards biological applications are immense.<br />
EMCCD<br />
Kr Laser 647 nm<br />
Spectrograph and LP filter<br />
Figure 2: Schematic of RSFC instrument<br />
OF<br />
A<br />
B<br />
FC<br />
C<br />
PMT<br />
OF<br />
Flow Channel<br />
Interaction Region<br />
Figure 1: Schematic of the particles in the fluid flow and<br />
interaction region of the laser within the flow cell.<br />
Figure 3: Sample SERS spectra from SERS tag-labelled<br />
microparticles. (D. Sebba and J. Nolan, unpublished data)<br />
Acknowledgment: Appreciation is gratefully extended to Prof John Nolan and his group at La Jolla Bioengineering Institute, CA, USA.<br />
Reference material:<br />
1) Dakota A Watson, Leif O Brown, Danial F Gaskill, Mark Naivar, Steven W Graves, Stephen K Doorn and John P Nolan, ‘A Flow Cytometer<br />
for the Measurement of Raman Spectra’, Cytometry Part A, Vol 73A, p119-128, (2008)<br />
2) Gregory R Goddard, J P Houston, John C Martin, Steven W Graves, James P Freyer, ‘Cellular discrimination based on spectral analysis of<br />
intrinsic fluorescence’, Proc. Of SPIE, Vol. 6859 685908-1, (2008)<br />
3) John P Nolan, ‘Raman <strong>Spectroscopy</strong> Meets Flow Cytometry’, www.photonics.com/content/bio/2008/April/bioFeatures<br />
Page 45
Application Note<br />
TERS – Label-free chemical analysis of nanostructures<br />
in biofilms<br />
Tip-Enhanced Raman <strong>Spectroscopy</strong> (TERS) is developing into a powerful technique<br />
for the characterization of bio-molecules at the nanoscale level [1,2,3,4,5]. It facilitates<br />
chemical imaging on the scale of single molecules, extending well established techniques<br />
such as surface enhanced Raman <strong>Spectroscopy</strong> (SERS) and Raman mapping.<br />
Work by Dr Thomas Schmid and co-workers from Prof. Renato<br />
Zenobi’s group at the Dept of Chemistry and Biosciences, ETH<br />
Zurich, demonstrates the use of TERS for label-free chemical<br />
characterization of nanostructures in biological specimens [1]. The<br />
biofilm system chosen for the investigation was based on calcium<br />
alginate fibres. TERS provides detailed chemical information at very<br />
high spatial resolutions (
Figure 1: Schematic of the set-up used by Schmid<br />
and co-workers for acquisition of TERS spectra.<br />
Figure 2: The TERS concept – a metallized tip is used to enhance the Raman response. An AFM image is shown to the left and<br />
sample Raman spectra taken from biofilm material is shown to the right. (Courtesy of Prof Zenobi’s group, ETH, Zurich)<br />
Acknowledgement: Appreciation is extended to Prof. Zenobi’s group, Dept. of Chemistry & Applied Biosciences, ETH Zurich, Switzerland.<br />
Reference material:<br />
1) T Schmid, A Messmer, Boon-Siang Yeo, Weihua Zhang, and R Zenobi. ‘Towards chemical analysis of nanostructures in biofilms II: tipenhanced<br />
Raman <strong>Spectroscopy</strong> of alginates’. Anal Bioanal Chem, 391, pp1907–1916 (2008)<br />
2) C Vannier, Boon-Siang Yeo, J Melanson, and R Zenobi. ‘Multifunctional microscope for far-field and tip-enhanced Raman <strong>Spectroscopy</strong>’.<br />
Review of Scientific Instruments 77, 023104(1-5) (2006)<br />
3) Boon-Siang Yeo, J Stadler, T Schmid, R Zenobi, and Weihua Zhang. ‘Tip-enhanced Raman <strong>Spectroscopy</strong> – Its status, challenges and future<br />
directions’. Chemical Physics Letters 472, 1–13 (2009)<br />
4) APD Elfick and AR Downes. ‘Development of tip-enhanced optical <strong>Spectroscopy</strong> for biological applications: a review’. Anal. Bioanal.<br />
Chem. 396, pp45-52 (2010)<br />
5) J Steidtner and B Pettinger. ‘Tip-Enhanced Raman <strong>Spectroscopy</strong> and Microscopy on Single Dye Molecules with 15nm Resolution’.<br />
Physical Review Letters, 100, 236101 (2008)<br />
Page 47
Application Note<br />
Stand-off LIBS: a detection technique for explosive<br />
residues<br />
Stand-off techniques have received increasing attention as valuable methods for material<br />
analysis at remote distances. This is particularly relevant when looking at hazardous<br />
contaminants in the environment or residual explosive material, where it is desirable for<br />
the analyst to remain at a safe distance from the material being investigated.<br />
Work carried out by Prof JJ Laserna’s group at the Dept of Analytical<br />
Chemistry in the University of Malaga, reported by González et.al [1],<br />
explores the use of stand-off Laser Induced Breakdown <strong>Spectroscopy</strong><br />
(stand-off LIBS) for the detection of explosive residues in situations<br />
simulating ‘real environment’ scenarios. They looked at the feasibility<br />
of detecting the likes of improvised explosive materials (IEM) through<br />
windows such as those in cars or buildings or within various types of<br />
container. A telescopic system was used to focus a high power pulsed<br />
laser to a spot on the material to produce a micro-plasma. The same<br />
telescope collected the light emission from this plasma which was<br />
then analyzed in a spectrograph using the advanced time-gating of an<br />
intensified CCD camera.<br />
The ability to detect dangerous contaminants, improvised explosives<br />
(IED), home made explosives (HME), or nuclear by-products, has<br />
become of increasing importance due to heightened risks in recent<br />
decades. In their work, Gonzalez and co-workers set out to test the<br />
feasibility of making such measurements with their TELELIBS<br />
sensor, and to assess the influences that the barrier position and its<br />
composition might have on the quality of those measurements.<br />
In allied work the group looked at the influence of atmospheric<br />
turbulence on beam propagation to and from the target [2], where<br />
they showed that measurements over several tens of meters could be<br />
significantly affected by atmospheric turbulence.<br />
A schematic of the typical experimental set up used by the Malaga<br />
group is shown in figure 1. It consists of a telescope which takes the<br />
light from a laser and focuses it on to a target at a distance of typically<br />
30 m. Two Nd:YAG lasers were used at the fundamental wavelength<br />
of 1064 nm, delivering 5 ns long pulses at 10 Hz, and energy of<br />
800 mJ. The two laser outputs were arranged to be overlapped in<br />
space and time so that the overall irradiance on target was doubled.<br />
The emission light from the micro-plasma was collected by the<br />
same telescope and delivered into a 600 μm core diameter fibre via a<br />
dichroic mirror. The excitation source was reflected by the dichroic<br />
mirror into the telescope whilst the returning atomic emission light<br />
was transmitted through the mirror, where it was then coupled into<br />
the optical fibre for delivery to the spectrograph. A Czerny-Turner<br />
spectrograph (Shamrock 303i) with an intensified CCD camera<br />
(iStar DH740-25F-03) was used to detect the emission. In any LIBS<br />
experiment one of the main challenges in attempting to collect<br />
discernible atomic emission line spectra is to reject the broad band<br />
continuum which occurs during the incidence of the laser pulse and<br />
immediately afterwards as the plasma plume evolves. This broad<br />
continuum tends to dominate the emission early in time resulting in<br />
little or no atomic line data being evident. However, an ICCD allows<br />
the acquisition by the camera to be delayed for a time in order to reject<br />
this early continuum. In this work a delay of 400 ns was used along<br />
Page 48<br />
with an exposure or integration time of 9 μs.<br />
Among the substances investigated were sodium chlorate (NaClO 3 ),<br />
dinitrotoluene (DNT), trinitrotoluene (TNT), and some plastic<br />
explosives (C2 and H15). A number of barrier materials, including<br />
clear glass, some tinted glasses, and colorless PMMA (a polymer<br />
material) were placed in the beam path. The team investigated the<br />
influence of the target-to-barrier distance on the measured signal<br />
to background (S/N) ratios, along with the influence of the optical<br />
characteristics of the barrier material, thus accounting for the<br />
transmittance of excitation laser light and the returning plasma<br />
emission. A suite of chemometric tools were used to analyze the<br />
spectral data for the presence or absence of explosive residues.<br />
A number of spectral bands and atomic/ionic emission lines were<br />
chosen for fingerprinting and subsequent identification of the<br />
explosive substances: examples of such features included the CN band<br />
(388.3 nm), the C2 band (471.5 nm, 516.5 nm and 563.5 nm), and the<br />
Al (I) line (469.4 nm) among others. The ability to detect a residue<br />
was determined by the ‘sensitivity’ and ‘specificity’ of the measuring<br />
system. Sensitivity is related to the system’s ability to identify the<br />
presence of an explosive material if it is present i.e. the system flags<br />
up the presence of the material when it should. Specificity is related to<br />
its ability to identify explosives only if they are present i.e. the system<br />
doesn’t flag up the presence of explosive when it shouldn’t. González<br />
and co-workers assessed the capability of their system by measuring<br />
the sensitivity for the different residues with the different barrier<br />
materials. By increasing the number of laser shots it was possible<br />
to increase the detection to 100% sensitivity without impacting on<br />
specificity.<br />
Gonzalez and co-workers successfully demonstrated the feasibility of<br />
using the stand-off or TELELIBS technique for detection of explosive<br />
materials through different types of window or interposed barriers, as<br />
long as there was a clear line of sight from the sensor system to the<br />
target. They also demonstrated that relatively few laser shots were<br />
required to ensure a high level of detection capability and means of<br />
distinguishing different residues and that the position of the barrier<br />
relative to the target and sensor was unimportant to the analysis. A<br />
key enabler for this type of work is the high sensitivity and gating<br />
versatility offered by the iStar ICCD camera. Research and validation<br />
on stand-off analysis techniques has gained much momentum as<br />
demands grow for safe, convenient and quick ways of testing for<br />
improvised explosives devices and other hazardous contaminants in<br />
the environment.<br />
More recently the group have demonstrated the simultaneous use of<br />
both stand-off LIBS/stand-off Raman to analyse such materials [4].
Figure 1: Schematic of the TELELIBS<br />
sensor system used in the experiments<br />
Figure 2: Schematic picture of combined<br />
LIBS-Raman system used by the<br />
Laserna group.<br />
A – laser, B - focusing optics,<br />
C – telescope, D - power supplies,<br />
E – delay generators, F - spectrographs,<br />
G – fibres, H – notch filter, I – laptop.<br />
Acknowledgement: Appreciation is gratefully extended to Prof JJ Laserna and his group, University of Malaga, Spain.<br />
Reference material:<br />
1) González R, Lucena P, Tobaria LM and Laserna JJ. ‘Standoff LIBS detection of explosive residues behind a barrier’. J. Anal. At. Spectrom.,<br />
24, 1123–1126 (2009)<br />
2) Laserna JJ, Fernández Reyes R, González R, Tobaria L, and Lucena P. ‘Study on the effect of beam propagation through atmospheric<br />
turbulence on standoff nanosecond laser induced breakdown <strong>Spectroscopy</strong> measurements’. Optics Express, 17, No. 12, pp 10265-10276<br />
(2009)<br />
3) Luis Alonso Alvarez-Trujillo, Alejandro Ferrero and J. Javier Laserna. ‘Preliminary studies on stand-off laser induced breakdown<br />
<strong>Spectroscopy</strong> detection of aerosols’. J. Anal. At. Spectrom., 23, pp 885–888 (2008)<br />
4) J Moros, JA Lorenzo, P Lucena, LM Tobaria, and JJ Laserna. ‘Simultaneous Raman <strong>Spectroscopy</strong>-Laser-Induced Breakdown <strong>Spectroscopy</strong><br />
for Instant Standoff Analysis of Explosives Using a Mobile Integrated Sensor Platform’. Analytical Chemistry, 82 (4), pp 1389–1400, (2010)<br />
Page 49
Technical Note<br />
Sensitivity of CCD cameras – some key factors<br />
to consider<br />
Sensitivity is a key performance feature of any detection system. When assessing the<br />
sensitivity of any CCD sensor it is the achievable Signal-to-Noise Ratio (SNR) which is<br />
of key importance. This encapsulates the capacity to have the signal stand out from the<br />
surrounding noise.<br />
The approach to ensure the best possible SNR ratio is to a) develop a<br />
sensor with the highest possible quantum efficiency and b) reduce the<br />
various sources of noise to a minimum. Quantum Efficiency (QE) is<br />
related to the ability of the sensor to respond to the incoming photon<br />
signal and the conversion of it to a measurable electron signal. Clearly<br />
the greater the number of photoelectrons produced for a given photon<br />
signal the higher the QE. QE is usually expressed as a probability –<br />
typically given in percentage format – where for example a QE of 0.6<br />
or 60% indicates a 60% chance that a photoelectron will be released<br />
for each incident photon. QE is a wavelength or photon energy<br />
dependent function, and a sensor is generally chosen which has the<br />
highest QE in the wavelength region of interest. Various means have<br />
been employed to improve the quantum efficiency of CCD sensors.<br />
These include:<br />
• Back Illumination – where the sensor is back-thinned and the light<br />
is delivered through the back making it easier for the incident<br />
photons to reach and be absorbed in the active layer of the sensor<br />
• Anti-reflection coatings – optimized for the particular wavelength<br />
region of interest<br />
• Deep-depletion – where the active layer is increased in extent<br />
to increase probability of absorption of photons in the nearinfrared<br />
(NIR) part of the spectrum<br />
• Lumogen coatings – to enhance the sensitivity in the UV region<br />
by the absorption and conversion of UV photons to visible photons<br />
which are more readily detected by the CCD<br />
• Micro-lenses – more relevant to imaging sensors than<br />
<strong>Spectroscopy</strong> – allows more light to be collected into the sensitive<br />
area of the sensor leading to an increase in the fill-factor<br />
The next key challenge is reducing the overall noise to its minimum<br />
(the latter is often referred to as the noise floor). Shot noise within the<br />
photon generated (electronic) signal (S) is an intrinsic contribution<br />
to the overall noise and is related to fundamental quantum physics;<br />
it will always be part of any signal. If the number of photons in the<br />
incident signal is denoted by P and the quantum efficiency by QE,<br />
the photoelectron signal generated will be given by S = (QE.P).<br />
Next to consider is the system or camera noise which has three main<br />
contributors, the dark current (DC) of the sensor, spurious charge such<br />
as clock induced charge (CIC), and the readout noise from the output<br />
electronics (pre-amp and A/D node). The sources of noise and the<br />
means of dealing with them are summarized below:<br />
• Signal Shot Noise (N SN ) – fundamentally intrinsic to any signal<br />
N SN = √S = √(QE.P)<br />
• Dark noise (N DN ) – associated with the thermally generated dark<br />
current N DN =√(DC.t) – where ‘t’ corresponds to the exposure<br />
time: dark current (DC) is reduced by cooling of sensor<br />
• Clock Induced Charge Noise (N CIC ) – spurious noise generated<br />
during the clocking of the pixels when moving the charge out of<br />
the sensor; this is minimised by implementation of fine tuned<br />
and well controlled clocking voltages, in particular fine control<br />
over clocking edges down to nanosecond resolutions<br />
Page 50<br />
• Readout Noise (N RN ) – this arises in the readout electronics<br />
before the digitized signal is sent to the PC and may be reduced by<br />
using lower readout rates and clean clocking pulses<br />
Usually a high performance camera is operated at certain temperatures<br />
and clocking speeds such that the detection limit is determined by<br />
the readout noise. The various sources of noise may be added in<br />
quadrature to give the overall system or camera noise which may be<br />
expressed as:<br />
The system noise characteristics for a typical iDus – BRDD CCD<br />
camera are shown in figure 1. Clearly the dark noise will rise with<br />
increase in exposure times such that for long exposures the overall<br />
system noise (and consequently the detection limit) will become<br />
dominated by the dark noise contribution. With cooling, the dark<br />
noise contribution is reduced significantly and with sufficient cooling<br />
can be reduced to an insignificant level. This shows up as the plateau<br />
region where the system noise is now readout-noise limited. The<br />
advantage of cooling is evident when extremely long exposure times<br />
(>10’s, if not 100’s of seconds) are required in a given experiment.<br />
However, if short exposure times are being used, then it is clear that<br />
there is little benefit in using ultra deep cooling. As an illustration,<br />
consider exposure times less than 1000 seconds (a long exposure<br />
time). There is little or no advantage cooling the sensor below -75ºC,<br />
where the system is operating on the low plateau corresponding to the<br />
read out noise limited regime. Similarly, if exposures less than 10s are<br />
being used, there is little or no benefit to be gained by cooling below<br />
-50ºC. When the temperature dependence of the QE is considered<br />
then one has to be careful when choosing the best operating point or<br />
temperature for optimum performance particularly if working in the<br />
NIR region (see Technical note page 52-53).<br />
The overall signal to noise (SNR) for a given CCD system may be<br />
expressed in the form:<br />
This function enables the performance of any conventional CCD to be<br />
assessed given the values for the key parameters – usually contained<br />
in the specification or performance sheets.
A number of points worth noting are,<br />
• the QE has some temperature dependence which has particular<br />
implications when working in the NIR region – simply cooling a<br />
sensor to the lowest possible temperature does not necessarily<br />
ensure optimum performance of the camera<br />
• the demands on cooling are somewhat reduced when using short<br />
exposure times (10 s)<br />
Advanced detectors have been developed to extend sensitivity to the<br />
level of detecting a single photon. These systems amplify the initially<br />
detected signal using a multiplication process leading to an enhanced<br />
S/N at the read out of the CCD. The two main technologies are:<br />
• ICCD – intensified charge couple devices where an intensifier<br />
tube is added in front of a standard CCD camera; the intensifier<br />
uses a Micro-Channel Plate (MCP) to provide the amplification of<br />
the signal before detection on the CCD<br />
• EMCCD – Electron Multiplication (EM) charge coupled device<br />
which uses a sensor with a special read out register; the EM<br />
register amplifies the electronic signal using a process know as<br />
ion impact ionisation<br />
The degree by which a basic signal is amplified or multiplied is<br />
referred to as the gain factor. This can be selected through the software<br />
and leads to alteration of the voltages across the MCP in the case<br />
of the ICCD and the clocking voltages applied in the EM read out<br />
register of the EMCCD.<br />
When an EMCCD or ICCD is being used an additional source of noise<br />
must be taken into account which is associated with the amplification<br />
process itself; this variation is intrinsic to any multiplication process.<br />
This is quantified by what is termed the Noise Factor (F). For<br />
EMCCD cameras the noise factor is √2 or ~1.41. The noise factor in<br />
ICCDs depends on the type and quality of intensifier tube used: these<br />
can have values from ~1.6 to ~3.5. Taking the noise factor (F) and<br />
the actual or real gain (G) into account, the total noise for systems<br />
offering gain may be expressed as:<br />
The SNR ratio for an EMCCD or ICCD may be written as:<br />
When high performance systems are operated in a deep cooled lownoise<br />
regime, where dark and spurious noise are negligible compared<br />
with the read out noise, this expression for the SNR may be simplified<br />
to:<br />
It can be seen here that by increasing the gain G, the term involving<br />
the read-out noise, N RN , becomes insignificant compared with the<br />
intrinsic shot noise of the signal, leading to ultra-sensitive detection<br />
capability. EMCCD and ICCD systems operated with appropriate<br />
configurations with sufficiently high gain can be used for single<br />
photon counting type experiments.<br />
Figure 1: The detection limit as a function<br />
of exposure time for single pixel (imaging<br />
mode) which are read out at 33 kHz with<br />
readout noise of 4.6 electrons.<br />
Page 51
Technical Note<br />
LN 2 versus TE cooling for BRDD and InGaAs sensors<br />
A widely made assumption when looking for the best performance from a CCD detector<br />
is ‘the cooler the better’. An intrinsic source of noise within all CCD detectors is that<br />
associated with thermally generated ‘dark current’. Cooling is clearly the means of<br />
reducing this particular noise source.<br />
However, it is also very important to remember than the quantum<br />
efficiency (QE) has a temperature dependence, and in this case the QE<br />
actually gets worse with cooling. This is a very important consideration<br />
for some detectors when operated in certain spectral regions, where<br />
extending the deep cooling to ever lower temperatures can lead to<br />
non-optimized operation of the system; that it to say there exists some<br />
temperature beyond which further cooling can be a disadvantage. One<br />
such case is a back-illuminated deep-depletion (BRDD) sensor used<br />
in the NIR region from 750 nm to 1000 nm.<br />
The sensitivity of the fall-off in QE with cooling is depicted in figure<br />
1 for a BRDD sensor. As can be seen the fall-off is quite dramatic<br />
and at the illustrated wavelength of 950 nm, the QE falls in relative<br />
terms by ~40%. This clearly arises a question around the trade-off<br />
between cooling to minimize dark noise and the desire to have QE as<br />
large as possible. To assess if there is an optimum temperature region<br />
for a given set of experimental conditions and what that temperature<br />
might be, it is useful to assess the SNR ratio possible at different<br />
temperatures of the sensor. The SNR ratio is the key parameter in any<br />
discussion on sensitivity.<br />
If we consider the system or camera noise as summarized in the<br />
equation below and illustrated for a typical BRDD sensor in figure<br />
1 on page 51, then it is desirable to be operating at the noise floor<br />
(plateau at base of curves). But if we are working with exposures
sensor needs cooled to just below -70ºC to enter the plateau region;<br />
this is well within the capacity of TE cooling. To ensure optimum<br />
performance from these InGaAs cameras, it is strongly recommended<br />
that liquid coolant is used to enable operation just above the dew point.<br />
Secondly, one has to be careful when measuring signals near the upper<br />
cut-off wavelength. As for silicon, cooling causes a shift in the energy<br />
of the bandgap edge; this leads to a shift in the cut-off wavelength.<br />
In InGaAs, increased cooling causes a striking shift of this cut-off<br />
towards shorter wavelengths. Figure 4 shows relative QE curves<br />
at several temperatures for the InGaAs sensor as used in the iDus<br />
DU490A-1.7 camera. This effect results in a shift dependence of ~0.6<br />
nm/K that leads to a shift of ~70 nm to shorter wavelengths when<br />
cooling down to -100ºC. This effect is of extreme importance if one is<br />
Figure 1: The relative change in QE for the BRDD sensor<br />
between 25˚C and -90˚C.<br />
Figure 3: Dark signal characteristics for an InGaAs iDus<br />
camera where the dark signal depends on both the sensor<br />
temperature and the ambient blackbody radiation. The dark<br />
signal of the sensor is plotted at different temperatures for<br />
different ambient temperatures i.e. temperatures of the front<br />
end of the surrounding camera housing. The flat plateau<br />
regions correspond to background blackbody radiation<br />
limited detection.<br />
working in the wavelength region around 1.6 μm.<br />
As with BRDD sensors working in the NIR region, one must consider<br />
carefully the degree of deep-cooling and the ability to control it, when<br />
ensuring optimum performance of an InGaAs system in terms of<br />
SNR. If using short to medium exposure times then TE cooling is<br />
more than adequate as long as the system is operating in a regime<br />
where the background dark signal is ‘ambient-blackbody-radiation’<br />
limited. The latter is ensured with liquid coolant such that the<br />
camera is operated just above the dew point. If working at the upper<br />
end of the sensor’s wavelength sensitivity, e.g. around 1.6 μm, the<br />
accurate controllability of temperature will be a distinct advantage for<br />
optimization of sensitivity.<br />
Figure 2: SNR versus exposure time for a low light photon<br />
flux of 10 ph/pix/s (950 nm) incident on the pixels of a BRDD<br />
sensor. The readout noise corresponds to the slowest rate of<br />
33 kHz with a readout noise of 4.6 e - .<br />
Figure 4: Variation of the relative QE of an InGaAs sensor<br />
with cooling. The solid curve is experimentally measured<br />
data at ambient (25ºC). The broken curves are modelled data<br />
based on both experimental measurements and theory, which<br />
indicated a shift in the band edge towards higher energies of<br />
~0.75 nm/K and a drop in peak QE of the order of 0.1 %/K,<br />
with fall in temperature.<br />
Page 53
Technical Note<br />
EMCCD technology for <strong>Spectroscopy</strong><br />
Electron Multiplication (EM) technology has been one of the most important<br />
developments in light detection over the last decade. It has revolutionized the whole area<br />
of low-light <strong>Spectroscopy</strong> and imaging, enabling research that hitherto would not have<br />
been possible. EM on the CCD chip allows for the amplification of the captured electron<br />
signal before it is ever read out through the camera electronics resulting in reduction of the<br />
effective readout noise to sub-electron levels.<br />
Sensors implementing EM amplification offer ultra-sensitive detection<br />
down to the single photon level. The first and most powerful EMCCD<br />
camera for <strong>Spectroscopy</strong> – the Newton EM – was introduced by <strong>Andor</strong><br />
in 2005.<br />
Other <strong>Andor</strong> cameras which implement EM sensors are the iXon3 and<br />
Luca EM families which are used primarily for imaging applications<br />
though some are being used for <strong>Spectroscopy</strong> particularly where fast<br />
spectral rates are a prime requirement. The Newton EM has the added<br />
versatility and flexibility of being usable as both a conventional CCD<br />
and as an EMCCD; it is effectively ‘two-cameras-in-one’ with one<br />
simple click in the software to switch between them.<br />
EM technology comes into its own when operating in a low-light<br />
regime (typically
gain is beneficial for the lower photon signals. The characteristic for<br />
the conventional CCD crosses over that of the EMCCD – with gain<br />
x 100 - at a signal of ~53 photons per pixel. This means that weaker<br />
signals below this transition point will benefit from EM gain, whereas<br />
for stronger signals above this level there is a better SNR with the<br />
conventional system. When the systems are operated at the fastest<br />
readout speed of 3 MHz, the readout noise is greater and the benefits<br />
of EM gain would be seen for even stronger photon signals up to just<br />
under 100 photons/pixel. It will be noted that as the photon signal<br />
increases, the SNR ratio for the conventional CCD approaches that<br />
of the ideal curve i.e. the noise becomes limited by the intrinsic shot<br />
noise of the signal. However, in the case of the EMCCD the SNR ratio<br />
approaches the ideal but will always have a systematic offset towards<br />
lower SNR; this offset is associated with the noise factor (F) of the<br />
gain register.<br />
Application areas which benefit from EM technology<br />
• Raman <strong>Spectroscopy</strong><br />
• Micro-<strong>Spectroscopy</strong><br />
• Multi-spectral Imaging<br />
• Hyper-spectral Imaging<br />
• Fast reaction processes<br />
• FRET<br />
• Single molecule <strong>Spectroscopy</strong><br />
• Transient (Pump-Probe) <strong>Spectroscopy</strong><br />
• Nano-dot Photoluminescence<br />
• Organic Luminescence<br />
• Atomic emission <strong>Spectroscopy</strong><br />
• Flow cytometry<br />
• Electroluminescence<br />
Figure 1: Comparison of the EMCCD with the conventional<br />
CCD for low light levels. Even the weakest spectral features<br />
can be observed with the application of EM gain which<br />
would otherwise remain obscured in the background noise<br />
of the conventional CCD. Both spectra taken under the same<br />
conditions apart from the application of gain. Data captured<br />
for a Newton DU971N-BV camera on a Shamrock 500i<br />
spectrograph using single scans with Full Vertical Binning<br />
(FVB).<br />
When operated with very high gain and signals with ultra-low levels,<br />
an EMCCD can be used in ‘photon counting mode’. This is a special<br />
mode of detection where the camera can count single photon events<br />
and build up a spectrum over time based on the discrete counting of<br />
these events. It is this ultra-high sensitivity and extremely fast spectral<br />
readout rates, along with a full featured, versatile and easy-to-use<br />
configuration platform that make the Newton EM the ideal choice for<br />
the most challenging <strong>Spectroscopy</strong> applications.<br />
Figure 2: Signal amplification by electron impact ionization –<br />
EM gain. Schematic shows charge being clocked through the<br />
EM register and being amplified in the process.<br />
Figure 3: Signal to Noise ratios (SNR) for the EM and<br />
conventional CCDs operating in the low photon regime. SNR<br />
ratios here are based on a Newton EM (DU970N) EMCCD<br />
operating at 1 MHz readout rate. The conventional, ideal and<br />
curves for several values of gain are included.<br />
Page 55
Part Numbers<br />
Accessories<br />
Fibre optics assemblies<br />
ME-OPT-8004 1 way fibre, single 50um core, UV/VIS, SMA-SMA, 2 m<br />
SR-OPT-8002 1 way fibre bundle, 100 um core, LOH-VIS/NIR, 2 m<br />
SR-OPT-8007 2 way fibre bundle, 100 um core, LOH-VIS/NIR, 2 m<br />
SR-OPT-8008 4 way fibre bundle, 100 um core, LOH-VIS/NIR, 2 m<br />
SR-OPT-8009 5 way fibre bundle, 100 um core, LOH-VIS/NIR, 2 m<br />
SR-OPT-8013 3 way fibre bundle, 100 um core, LOH-VIS/NIR, 2 m<br />
SR-OPT-8014 1 way fibre bundle, 100 um core, HOH-UV/VIS, 2 m<br />
SR-OPT-8015 2 way fibre bundle, 100 um core, HOH-UV/VIS, 2 m<br />
SR-OPT-8016 3 way fibre bundle, 100 um core, HOH-UV/VIS, 2 m<br />
SR-OPT-8017 4 way fibre bundle, 100 um core, HOH-UV/VIS, 2 m<br />
Filters Neutral Density<br />
TN-0300-001-#UV ND 0.3, UV-Vis<br />
TN-0300-001-NIR ND 0.3, Vis Nir<br />
TN-0400-001-#UV ND 0.4, UV-Vis<br />
TN-0500-001-#UV ND 0.5, UV-Vis<br />
TN-0600-001-#UV ND 0.6, UV-Vis<br />
TN-0600-001-NIR ND 0.6, Vis Nir<br />
TN-0700-001-#UV ND 0.7, UV-Vis<br />
TN-0800-001-#UV ND 0.8, UV-Vis<br />
Filters Long & Short pass<br />
TL-0400-001 400 nm cut-on, 400-2000 nm trans., Ø25.4 mm<br />
TL-0450-001 450 nm cut-on, 450-2000 nm trans., Ø25.4 mm<br />
TL-0500-001 500 nm cut-on, 500-2000 nm trans., Ø25.4 mm<br />
TL-0550-001 550 nm cut-on, 550-2000 nm trans., Ø25.4 mm<br />
TL-0600-001 600 nm cut-on, 600-2000 nm trans., Ø25.4 mm<br />
TL-0650-001 650 nm cut-on, 650-2000 nm trans., Ø25.4 mm<br />
TL-0700-001 700 nm cut-on, 700-2000 nm trans., Ø25.4 mm<br />
TL-0750-001 750 nm cut-on, 750-2000 nm trans., Ø25.4 mm<br />
TL-0800-001 800 nm cut-on, 800-2000 nm trans., Ø25.4 mm<br />
TL-0850-001 850 nm cut-on, 850-2000 nm trans., Ø25.4 mm<br />
TL-0900-001 900 nm cut-on, 900-2000 nm trans., Ø25.4 mm<br />
TL-0950-001 950 nm cut-on, 950-2000 nm trans., Ø25.4mm<br />
TL-1000-001 1000n m cut-on, 1000-2000 nm trans., Ø25.4 mm<br />
Page 56<br />
SR-OPT-8018 5 way fibre bundle, 100 um core, HOH-UV/VIS, 2 m<br />
SR-OPT-8019 1 way fibre bundle, 200 um core, LOH-VIS/NIR, 2 m<br />
SR-OPT-8020 2 way fibre bundle, 200 um core, LOH-VIS/NIR, 2 m<br />
SR-OPT-8021 3 way fibre bundle, 200 um core, LOH-VIS/NIR, 2 m<br />
SR-OPT-8022 4 way fibre bundle, 200 um core, LOH-VIS/NIR, 2 m<br />
SR-OPT-8024 1 way fibre bundle, 200 um core, HOH-UV/VIS, 2 m<br />
SR-OPT-8025 2 way fibre bundle, 200 um core, HOH-UV/VIS, 2 m<br />
SR-OPT-8026 3 way fibre bundle, 200 um core, HOH-UV/VIS, 2 m<br />
SR-OPT-8027 4 way fibre bundle, 200 um core, HOH-UV/VIS, 2 m<br />
TN-0900-001-#UV ND 0.9, UV-Vis<br />
TN-1000-001-#UV ND 1.0, UV-Vis<br />
TN-1000-001-NIR ND 1.0, Vis Nir<br />
TN-1500-001-#UV ND 1.5, UV-Vis<br />
TN-2000-001-#UV ND 2.0, UV-Vis<br />
TN-2000-001-NIR ND 2.0, Vis Nir<br />
TN-3000-001-#UV ND 3.0, UV-Vis<br />
TN-3000-001-NIR ND 3.0, Vis Nir<br />
TS-0400-001 400 nm cut-on, 240-400 nm trans., Ø25.4 mm<br />
TS-0450-001 450 nm cut-on, 270-450 nm trans., Ø25.4mm<br />
TS-0500-001 500 nm cut-on, 300-500 nm trans., Ø25.4 mm<br />
TS-0550-001 550 nm cut-on, 330-550 nm trans., Ø25.4 mm<br />
TS-0600-001 600 nm cut-on, 360-600 nm trans., Ø25.4 mm<br />
TS-0650-001 650 nm cut-on, 390-650 nm trans., Ø25.4 mm<br />
TS-0700-001 700 nm cut-on, 420-700 nm trans., Ø25.4 mm<br />
TS-0750-001 750 nm cut-on, 450-750 nm trans., Ø25.4 mm<br />
TS-0800-001 800 nm cut-on, 480-800 nm trans., Ø25.4 mm<br />
TS-0850-001 850 nm cut-on, 510-850 nm trans., Ø25.4 mm<br />
TS-0900-001 900 nm cut-on, 540-900 nm trans., Ø25.4 mm<br />
TS-0950-001 950 nm cut-on, 570-950 nm trans., Ø25.4 mm<br />
TS-1000-001 1000 nm cut-on, 600-1000 nm trans., Ø25.4 mm
Accessories cont.<br />
Light sources<br />
ACC-OCE-HG-1 Hg-Ar calibration lamp and power supply<br />
LK-##AR-PEN Ar pen ray calibration lamp<br />
LK-##KR-PEN Kr pen ray calibration lamp<br />
LK-##NE-PEN Ne pen ray calibration lamp<br />
LK-##XE-PEN Xe pen ray calibration lamp<br />
LK-DHRD-OCE Deuterium-Halogen lamp, radiometrically calibrated<br />
LK-HGAR-PEN Hg-Ar pen ray calibration lamp<br />
LK-HGNE-PEN Hg-Ne pen ray calibration lamp<br />
Single point detectors & Scanning accessories<br />
ACC-SR-ASM-0042 MCT detector with LN 2 Dewar and Au focusing mirror<br />
ACC-SR-ASM-0043 InSb detector with LN 2 Dewar and Au focusing mirror<br />
ACC-SR-ASM-0044 InGaAs detector + TE cooler and power supply<br />
ACC-SR-ASM-0045 PbS with built-in amplifier<br />
ACC-SR-ASM-0046 Si photodiode, UV-enhanced<br />
Microscope accessories<br />
TR-LCDM-CAGE-ADP Cage system adapter to Leica DMI4000/6000B<br />
TR-LCDM-MNT-127-LP Feet set for Leica DMI4000/6000B left port, SR303i<br />
TR-LCDM-MNT-127-RP Feet set for Leica DMI4000/6000B right port, SR303i<br />
TR-LCDM-MNT-146-LP Feet set for Leica DMI4000/6000B left port,<br />
SR500i/750<br />
TR-LCDM-MNT-146-RP Feet set for Leica DMI4000/6000B right port,<br />
SR500i/750<br />
TR-NKTI-CAGE-ADP Cage system adapter to Nikon Eclipse Ti-E<br />
TR-NKTI-MNT-127-LP Feet set for Nikon Eclipse Ti-E left port, SR303i<br />
TR-NKTI-MNT-127-RP Feet set for Nikon Eclipse Ti-E right port, SR303i<br />
TR-NKTI-MNT-146-LP Feet set for Nikon Eclipse Ti-E left port, SR500i/750<br />
TR-NKTI-MNT-146-RP Feet set for Nikon Eclipse Ti-E right port, SR500i/750<br />
TR-NK2K-CAGE-ADP Cage system adapter to Nikon TE2000<br />
TR-NK2K-MNT-127-LP Feet set for Nikon TE2000 left port, SR303i<br />
TR-NK2K-MNT-127-RP Feet set for Nikon TE2000 right port, SR303i<br />
TR-NK2K-MNT-146-LP Feet set for Nikon TE2000 left port, SR500i/750<br />
TR-NK2K-MNT-146-RP Feet set for Nikon TE2000 right port, SR500i/750<br />
LM-PENA Pen Ray shield type A, 1.02 mm pinhole<br />
LM-PENB Pen Ray shield type B, 7.78x16 mm aperture<br />
LM-PENC Pen Ray shield type C, 4.8x38.1 mm aperture<br />
LM-PENF-#SW Pen Ray Shield with G-275 converter (264 nm)<br />
LM-PENF-#LW Pen Ray Shield with G-278 converter (365 nm)<br />
LP-0220-006 Pen Ray power supply (LK-##XE-PEN)<br />
LP-0220-010 Pen Ray power supply (LK-##AR-PEN, KR, NE)<br />
LP-0220-018 Pen Ray power supply (LK-HGAR-PEN, HGNE)<br />
ACC-SR-ASM-0047 PMT type R928<br />
SR-ASM-0048 PMT type R1527P (Photon counting)<br />
ACC-SR-ASZ-0053 HV power supply for PMT<br />
ACC-SR-ASZ-0054 Photon counting unit for PMT<br />
ACC-SR-ASZ-0055 Data acquisition unit<br />
TR-OLIX-CAGE-ADP Cage system adapter to Olympus IX71/81<br />
TR-OLIX-MNT-127-LP Feet set for Olympus IX71/81 left port, SR303i<br />
TR-OLIX-MNT-146-LP Feet set for Olympus IX71/81 left port, SR500i/750<br />
TR-SPIA-050 C-mount to C-mount 1:1 infinity extender<br />
TR-ZSAV-CAG-ADP Cage system adapter to Zeiss Axiovert 200<br />
TR-ZSAV-MNT-127-LP Feet set for Zeiss Axiovert 200 left port, SR303i<br />
TR-ZSAV-MNT-127-RP Feet set for Zeiss Axiovert 200 right port, SR303i<br />
TR-ZSAV-MNT-146-LP Feet set for Zeiss Axiovert 200 left port, SR500i/750<br />
TR-ZSAV-MNT-146-RP Feet set for Zeiss Axiovert 200 right port, SR500i/750<br />
TR-ZAXO-CAG-ADP Cage system adapter to Zeiss Axio Observer<br />
TR-ZAXO-MNT-127-LP Feet set for Zeiss Axio Observer left port, SR303i<br />
TR-ZAXO-MNT-127-RP Feet set for Zeiss Axio Observer right port, SR303i<br />
TR-ZAXO-MNT-146-LP Feet set for Zeiss Axio Observer left port, SR500i/750<br />
TR-ZAXO-MNT-146-RP Feet set for Zeiss Axio Observer right port,<br />
SR500i/750<br />
Page 57
Cameras<br />
Accessories<br />
ACC-XW-CHIL-160 Oasis 160 ultra compact chiller unit with hose<br />
CCI-010 PCI card MHz for ICCD<br />
CCI-23 PCI card iXon3<br />
IO-160 Input/Output and synchronization box<br />
OPTION-C1-AR1 AR coated window (400-900 nm) for <strong>Spectroscopy</strong> CCD<br />
OPTION-C1-MGF2 MgF 2 window for <strong>Spectroscopy</strong> CCD<br />
iDus & iDus InGaAs<br />
DU401A-BR-DD 1024x128, 26 µm, BI Deep Depletion, 100 kHz, -100ºC<br />
DU401A-BV 1024x127, 26 µm, BI + Vis AR coating, 100 kHz, -100ºC<br />
DU401A-FI 1024x127, 26 µm, Front-Illuminated, 100 kHz, -100ºC<br />
DU420A-BEX2-DD 1024x256, 26 µm, BI Deep Depletion Broadband Dual-AR,<br />
100 kHz, -100ºC<br />
DU420A-BR-DD 1024x256, 26 µm, BI Deep Depletion, 100 kHz, -100ºC<br />
DU420A-BU 1024x255, 26 µm, BI 350 nm-optimized, 100 kHz, -100ºC<br />
DU420A-BU2 1024x255, 26 µm, BI 250 nm-optimized, 100 kHz, -100ºC<br />
DU420A-BV 1024x255, 26 µm, BI + Vis AR coating, 100 kHz, -100ºC<br />
DU420A-OE 1024x255, 26 µm, Open Electrode, 100 kHz, -100ºC<br />
DU490A-1.7 512x1, 25x500 µm, InGaAs 1.7 µm cuttoff, 100 kHz, -85ºC<br />
iStar<br />
DH320T-18F-03 1024x255 CCD, Ø18 mm, Gen 2 Broad, 5 ns, Intelligate<br />
DH320T-18U-03 1024x256 CCD, Ø18 mm, Gen 2 Broad, 5 ns, Intelligate<br />
DH320T-18F-04 1024x255 CCD, Ø18 mm, Gen 2 Broad, 5 ns, P46 , Intelligate<br />
DH320T-18U-04 1024x255 CCD, Ø18 mm, Gen 2 Broad, 2 ns, P46 , Intelligate<br />
DH320T-18F-05 1024x255 CCD, Ø18 mm, Gen 2 Broad, 10 ns, MgF2 ,<br />
Intelligate<br />
DH320T-18U-05 1024x255 CCD, Ø18 mm, Gen 2 Broad, 5 ns, MgF2 ,<br />
Intelligate<br />
DH320T-18H-13 1024x255 CCD, Ø18 mm, Gen 2 Red, 50ns , Intelligate<br />
DH320T-18F-63 1024x255 CCD, Ø18 mm, Gen 3 Vis, 5 ns , Intelligate<br />
DH320T-18U-63 1024x255 CCD, Ø18 mm, Gen 3 Vis, 2 ns , Intelligate<br />
DH320T-18F-73 1024x255 CCD, Ø18 mm, Gen 3 Nir, 5 ns , Intelligate<br />
DH320T-18U-73 1024x255 CCD, Ø18 mm, Gen 3 Nir, 2 ns , Intelligate<br />
Page 58<br />
PS150 ICCD power supply for deep cooling<br />
P25 Shutter Prontor 25 mm standalone shutter<br />
PS25 CCD power supply for deep cooling<br />
SD-166 P25 Prontor 25 mm shutter control<br />
XU-RECR/TRANS USB 2.0 fibre optic extender - emitter and receiver<br />
XW-RECR Koolance Exos II recirculator with mains power supply<br />
DU490A-2.2 512x1, 25x250 µm, InGaAs 2.2 µm cuttoff, 100 kHz, -85ºC<br />
DU491A-1.7 1024x1, 25x500 µm, InGaAs 1.7 um cuttoff, 100 kHz, -85ºC<br />
DU491A-2.2 1024x1, 25x250 µm, InGaAs 2.2 um cuttoff, 100 kHz, -85ºC<br />
DU492A-1.7 512x1, 50x500 µm, InGaAs 1.7 um cuttoff, 100 kHz, -85ºC<br />
DU492A-2.2 512x1, 50x250 µm, InGaAs 2.2 um cuttoff, 100 kHz, -85ºC<br />
DV401A-BV 1024x255, 26 µm, BI + Vis AR coating, 100 kHz, -70ºC<br />
DV401A-FI 1024x255, 26 µm, Front-Illuminated, 100 kHz, -70ºC<br />
DV420A-BU 1024x255, 26 µm, BI 350 nm-optimized, 100 kHz, -70ºC<br />
DV420A-BU2 1024x255, 26 µm, BI 250 nm-optimized, 100 kHz, -70ºC<br />
DV420A-BV 1024x255, 26 µm, BI + Vis AR coating, 100 kHz, -70ºC<br />
DV420A-OE 1024x255, 26 µm, Open Electrode, 100 kHz, -70ºC<br />
DH320T-18H-83 1024x255 CCD, Ø18 mm, Gen 2 UV, 100 ns , Intelligate<br />
DH320T-18F-93 1024x255 CCD, Ø18 mm, Gen 3 InGaAs, 5 ns , Intelligate<br />
DH320T-18U-93 1024x255 CCD, Ø18 mm, Gen 3 InGaAs, 2 ns , Intelligate<br />
DH320T-18F-A3 1024x255 CCD, Ø18 mm, Gen 3 Vis-Nir, 5 ns , Intelligate<br />
DH320T-18U-A3 1024x255 CCD, Ø18 mm, Gen 3 Vis-Nir, 2 ns , Intelligate<br />
DH320T-18F-C3 1024x255 CCD, Ø18 mm, Gen 3 Nir + UV coating, 5 ns ,<br />
Intelligate<br />
DH320T-18U-C3 1024x255 CCD, Ø18 mm, Gen 3 Nir + UV coating, 2 ns ,<br />
Intelligate<br />
DH320T-18F-E3 1024x255 CCD, Ø18 mm, Gen 2 UV, 5 ns , Intelligate<br />
DH320T-18U-E3 1024x255 CCD, Ø18 mm, Gen 2 UV, 2 ns , Intelligate<br />
DH320T-25F-03 1024x255 CCD, Ø25 mm, Gen 2 Broad, 3 ns , Intelligate<br />
DH320T-25U-03 1024x255 CCD, Ø25 mm, Gen 2 Broad, 7 ns , Intelligate
Cameras cont.<br />
DH334T-18F-03 1024x1024 CCD, Ø18 mm, Gen 2 Broad, 5 ns, Intelligate<br />
DH334T-18U-03 1024x1024 CCD, Ø18 mm, Gen 2 Broad, 2 ns , Intelligate<br />
DH334T-18F-04 1024x1024 CCD, Ø18 mm, Gen 2 Broad, 5 ns, P46 , Intelligate<br />
DH334T-18U-04 1024x1024 CCD, Ø18 mm, Gen 2 Broad, 2 ns, P46 , Intelligate<br />
DH334T-18F-05 1024x1024 CCD, Ø18 mm, Gen 2 Broad, 10 ns, MgF2 ,<br />
Intelligate<br />
DH334T-18U-05 1024x1024 CCD, Ø18 mm, Gen 2 Broad, 5 ns, MgF2 ,<br />
Intelligate<br />
DH334T-18H-13 1024x1024 CCD, Ø18 mm, Gen 2 Red, 50ns , Intelligate<br />
DH334T-18F-63 1024x1024 CCD, Ø18 mm, Gen 3 Vis, 5 ns , Intelligate<br />
DH334T-18U-63 1024x1024 CCD, Ø18 mm, Gen 3 Vis, 2 ns , Intelligate<br />
DH334T-18F-73 1024x1024 CCD, Ø18 mm, Gen 3 Nir, 5 ns , Intelligate<br />
DH334T-18U-73 1024x1024 CCD, Ø18 mm, Gen 3 Nir, 2 ns , Intelligate<br />
DH334T-18H-83 1024x1024 CCD, Ø18 mm, Gen 2 UV, 100 ns , Intelligate<br />
DH334T-18F-93 1024x1024 CCD, Ø18 mm, Gen 3 InGaAs, 5 ns , Intelligate<br />
DH334T-18U-93 1024x1024 CCD, Ø18 mm, Gen 3 InGaAs, 2 ns , Intelligate<br />
DH334T-18F-A3 1024x1024 CCD, Ø18 mm, Gen 3 Vis-Nir, 5 ns , Intelligate<br />
DH334T-18U-A3 1024x1024 CCD, Ø18 mm, Gen 3 Vis-Nir, 2 ns , Intelligate<br />
DH334T-18F-C3 1024x1024 CCD, Ø18 mm, Gen 3 Nir + UV coating, 5 ns ,<br />
Intelligate<br />
DH334T-18U-C3 1024x1024 CCD, Ø18 mm, Gen 3 Nir + UV coating, 2 ns ,<br />
Intelligate<br />
DH334T-18F-E3 1024x1024 CCD, Ø18 mm, Gen 2 UV, 5 ns , Intelligate<br />
DH334T-18U-E3 1024x1024 CCD, Ø18 mm, Gen 2 UV, 2 ns , Intelligate<br />
DH334T-25F-03 1024x1024 CCD, Ø25 mm, Gen 2 Broad, 3 ns , Intelligate<br />
DH334T-25U-03 1024x1024 CCD, Ø25 mm, Gen 2 Broad, 7 ns , Intelligate<br />
DH340T-18F-03 2048x512 CCD, Ø18 mm, Gen 2 Broad, 5 ns, Intelligate<br />
DH340T-18U-03 2048x512 CCD, Ø18 mm, Gen 2 Broad, 2 ns , Intelligate<br />
DH340T-18F-04 2048x512 CCD, Ø18 mm, Gen 2 Broad, 5 ns, P46 , Intelligate<br />
DH340T-18U-04 2048x512 CCD, Ø18 mm, Gen 2 Broad, 2 ns, P46 , Intelligate<br />
DH340T-18F-05 2048x512 CCD, Ø18 mm, Gen 2 Broad, 10 ns, MgF2 ,<br />
Intelligate<br />
DH340T-18U-05 2048x512 CCD, Ø18 mm, Gen 2 Broad, 5 ns, MgF2 ,<br />
Intelligate<br />
DH340T-18H-13 2048x512 CCD, Ø18 mm, Gen 2 Red, 50ns , Intelligate<br />
DH340T-18F-63 2048x512 CCD, Ø18 mm, Gen 3 Vis, 5 ns , Intelligate<br />
DH340T-18U-63 2048x512 CCD, Ø18 mm, Gen 3 Vis, 2 ns , Intelligate<br />
DH340T-18F-73 2048x512 CCD, Ø18 mm, Gen 3 Nir, 5 ns , Intelligate<br />
DH340T-18U-73 2048x512 CCD, Ø18 mm, Gen 3 Nir, 2 ns , Intelligate<br />
DH340T-18H-83 2048x512 CCD, Ø18 mm, Gen 2 UV, 100 ns , Intelligate<br />
DH340T-18F-93 2048x512 CCD, Ø18 mm, Gen 3 InGaAs, 5 ns , Intelligate<br />
DH340T-18U-93 2048x512 CCD, Ø18 mm, Gen 3 InGaAs, 3 ns , Intelligate<br />
DH340T-18F-A3 2048x512 CCD, Ø18 mm, Gen 3 Vis-Nir, 5 ns , Intelligate<br />
DH340T-18U-A3 2048x512 CCD, Ø18 mm, Gen 3 Vis-Nir, 2 ns , Intelligate<br />
DH340T-18F-C3 2048x512 CCD, Ø18 mm, Gen 3 Nir + UV coating, 5 ns ,<br />
Intelligate<br />
DH340T-18U-C3 2048x512 CCD, Ø18 mm, Gen 3 Nir + UV coating, 2 ns ,<br />
Intelligate<br />
DH340T-18F-E3 2048x512 CCD, Ø18 mm, Gen 2 UV, 5 ns , Intelligate<br />
DH340T-18U-E3 2048x512 CCD, Ø18 mm, Gen 2 UV, 2 ns , Intelligate<br />
DH340T-25F-03 2048x512 CCD, Ø25 mm, Gen 2 Broad, 3 ns , Intelligate<br />
DH340T-25U-03 2048x512 CCD, Ø25 mm, Gen 2 Broad, 7 ns , Intelligate<br />
Page 59
Cameras cont.<br />
iXon3<br />
DU-888E-C00-#BV EM, 1024x1024, 13 µm, BI + Vis AR coating, 10 MHz,<br />
-100ºC<br />
DU-888E-C00-UVB EM, 1024x1024, 13 µm, BI + UV coating, 10 MHz, -100ºC<br />
DU-897E-C00-#BV EM, 512x512, 16 µm, BI + Vis AR coating, 10 MHz, -100ºC<br />
DU-897E-C00-UVB EM, 512x512, 16 µm, BI + UV coating, 10 MHz, -100ºC<br />
Newton & Newton EM<br />
DU920P-BEX2-DD 1024x256, 26 µm, BI Deep Depletion Broadband Dual-AR,<br />
100 kHz, -100ºC<br />
DU920P-BR-DD 1024x256, 26 µm, BI Deep Depletion, 3 MHz, -100ºC<br />
DU920P-BU 1024x255, 26 µm, BI 350 nm-optimized, 3 MHz, -100ºC<br />
DU920P-BU2 1024x255, 26 µm, BI 250 nm-optimized, 3 MHz, -100ºC<br />
DU920P-BV 1024x255, 26 µm, BI + Vis AR coating, 3 MHz, -100ºC<br />
DU920P-OE 1024x255, 26 µm, Open Electrode, 3 MHz, -100ºC<br />
DU920P-UVB 1024x255, 26 µm, BI + UV coating, 3 MHz, -100ºC<br />
DU940P-BU 2048x512, 13.5 µm, BI 350 nm-optimized, 3 MHz, -100ºC<br />
DU940P-BU2 2048x512, 13.5 µm, BI 250 nm-optimized, 3 MHz, -100ºC<br />
DU940P-BV 2048x512, 13.5 µm, BI + Vis AR coating, 3 MHz, -100ºC<br />
Spectrographs<br />
Mechelle & specific accessories<br />
ME5000 Mechelle 5000 unit<br />
ME-OPT-0007 UV-VIS-NIR collector-collimator<br />
ME-SHT-9002 Shutter assembly<br />
ME-SLT-10*50 10x50 µm slit<br />
ME-SLT-100*50 100x50 µm slit<br />
Shamrock 163 & specific accessories<br />
SR-163 Shamrock 163 base unit<br />
SR1-ASM-0020 Manual adjustable input slit, 3 mm high<br />
SR1-ASM-0020-EQ Manual adjustable input slit, 6 mm high<br />
SR1-ASM-0023 C-mount input adapter<br />
SR1-ASM-7003 Ø1" filter holder<br />
SR1-ASM-7004 Rectangular 1" filter holder<br />
SR1-ASM-8032 Fixed ferrule adapter<br />
SR1-ASM-8035 Fixed SMA input adapter<br />
SR1-ASM-8036 Fibre ferrule adapter (adjustable slit & shutter)<br />
Page 60<br />
DU940P-FI 2048x512, 13.5 µm, Front-Illuminated, 3 MHz, -100ºC<br />
DU940P-UV 2048x512, 13.5 µm, FI + UV coating, 3 MHz, -100ºC<br />
DU970P-BV EM, 1600x200, 16 µm, BI + Vis-AR coating, 3 MHz, -100ºC<br />
DU970P-FI EM, 1600x200, 16 µm, Front-Illuminated, 3 MHz, -100ºC<br />
DU970P-UV EM, 1600x200, 16 µm, FI + UV coating, 3 MHz, -100ºC<br />
DU970P-UVB EM, 1600x200, 16 µm, BI + UV coating, 3 MHz, -100ºC<br />
DU971P-BV EM, 1600x400, 16 µm, BI + Vis AR coating, 3 MHz, -100ºC<br />
DU971P-FI EM, 1600x400, 16 µm, Front-Illuminated, 3 MHz, -100ºC<br />
DU971P-UV EM, 1600x400, 16 µm, FI + UV coating, 3 MHz, -100ºC<br />
DU971P-UVB EM, 1600x400, 16 µm, BI + UV coating, 3 MHz, -100ºC<br />
ME-SLT-200*50 200x50 µm slit<br />
ME-SLT-25*25 25x25 µm slit<br />
ME-SLT-25*50 25x50 µm slit<br />
ME-SLT-50*25 50x25 µm slit<br />
ME-SLT-50*50 50x50 µm slit<br />
SR1-ASM-8038 Fixed slit holder<br />
SR1-ASZ-8033 Fixed SMA input adapter (correction lens)<br />
SR1-ASZ-8034 Fixed slit input adapter (correction lens)<br />
SR1-ASZ-8044 InGaAs flange (correction lens)<br />
SR1-GRT-0085-0130 Grating 85 l/mm, 130 nm blaze<br />
SR1-GRT-0100-1600 Grating 100 l/mm, 1600 nm blaze<br />
SR1-GRT-0150-0300 Grating 150 l/mm, 300 nm blaze<br />
SR1-GRT-0150-0500 Grating 150 l/mm, 500 nm blaze<br />
SR1-GRT-0150-0800 Grating 150 l/mm, 800 nm blaze
Spectrographs cont.<br />
SR1-GRT-0150-1250 Grating 150 l/mm, 1250 nm blaze<br />
SR1-GRT-0150-2000 Grating 150 l/mm, 2000 nm blaze<br />
SR1-GRT-0200-0750 Grating 200 l/mm, 750 nm blaze<br />
SR1-GRT-0200-1700 Grating 200 l/mm, 1700 nm blaze<br />
SR1-GRT-0235-0750 Grating 200 l/mm, 1700 nm blaze<br />
SR1-GRT-0300-0300 Grating 300 l/mm, 300 nm blaze<br />
SR1-GRT-0300-0422 Grating 200 l/mm, 1700 nm blaze<br />
SR1-GRT-0300-0500 Grating 300 l/mm, 500 nm blaze<br />
SR1-GRT-0300-0760 Grating 300 l/mm, 760 nm blaze<br />
SR1-GRT-0300-0860 Grating 300 l/mm, 860 nm blaze<br />
SR1-GRT-0300-1000 Grating 300 l/mm, 1000 nm blaze<br />
SR1-GRT-0300-1200 Grating 300 l/mm, 1200 nm blaze<br />
SR1-GRT-0300-1700 Grating 300 l/mm, 1700 nm blaze<br />
SR1-GRT-0400-0400 Grating 400 l/mm, 400 nm blaze<br />
SR1-GRT-0400-0550 Grating 400 l/mm, 550 nm blaze<br />
SR1-GRT-0500-0330 Grating 500 l/mm, 330nm blaze<br />
SR1-GRT-0500-0560 Grating 500 l/mm, 560nm blaze<br />
SR1-GRT-0600-0300 Grating 600 l/mm, 300 nm blaze<br />
SR1-GRT-0600-0500 Grating 600 l/mm, 500 nm blaze<br />
SR1-GRT-0600-0650 Grating 600 l/mm, 650 nm blaze<br />
SR1-GRT-0600-0750 Grating 600 l/mm, 750 nm blaze<br />
SR1-GRT-0600-1000 Grating 600 l/mm, 1000 nm blaze<br />
SR1-GRT-0600-1200 Grating 600 l/mm, 1200 nm blaze<br />
SR1-GRT-0600-1600 Grating 600 l/mm, 1600 nm blaze<br />
SR1-GRT-0600-1900 Grating 600 l/mm, 1900nm blaze<br />
SR1-GRT-1200-0300 Grating 1200 l/mm, 300 nm blaze<br />
SR1-GRT-1200-0400 Grating 1200 l/mm, 400 nm blaze<br />
Shamrock 303i & specific accessories<br />
SR-303I-A Shamrock 303i base unit, single output port<br />
SR-303I-B Shamrock 303i base unit, double output port<br />
MFL-SR303I-888 iXon3 mounting flange kit DU888<br />
MFL-SR303I-INTER Intermediate plane CCD mounting flange (Imaging)<br />
MFL-SR303I-IXON iXon3 mounting flange kit (Not 888)<br />
SR-ASM-0003 Additionnal blank grating turret<br />
SR-ASM-0022 Adjustable feet set (4off)<br />
SR-ASZ-0005 Slit assembly for second exit port<br />
SR-ASZ-0034 Wide-aperture entrance slit<br />
SR-SHT-9001 Entrance shutter for SR-303i<br />
SR1-GRT-1200-0500 Grating 1200 l/mm, 500 nm blaze<br />
SR1-GRT-1200-0750 Grating 1200 l/mm, 750 nm blaze<br />
SR1-GRT-1200-1080 Grating 1200 l/mm, 1080 nm blaze<br />
SR1-GRT-1200-EH Grating 1200 l/mm, Holographic, 400-1200 nm<br />
SR1-GRT-1500-0250 Grating 1500 l/mm, 250 nm blaze<br />
SR1-GRT-1800-0400 Grating 1800 l/mm, 400 nm blaze<br />
SR1-GRT-1800-0500 Grating 1800 l/mm, 500 nm blaze<br />
SR1-GRT-1800-DH Grating 1800 l/mm, Holographic, 190-900 nm<br />
SR1-GRT-1800-FH Grating 1800 l/mm, Holographic, 350-900 nm<br />
SR1-GRT-2400-0300 Grating 2400 l/mm, 300 nm blaze<br />
SR1-GRT-2400-BH Grating 2400 l/mm, Holographic, 190-800 nm<br />
SR1-GRT-2400-GH Grating 2400 l/mm, Holographic, 250-600 nm<br />
SR1-SLT-9003 Shutter assembly (PCI)<br />
SR1-SLT-9004 Shutter assembly (I 2 C)<br />
SR1-SLH-0010-3 10 um x 3 mm slit for shutter<br />
SR1-SLH-0025-3 25 um x 3 mm slit for shutter<br />
SR1-SLH-0050-3 50 um x 3 mm slit for shutter<br />
SR1-SLH-0075-3 75 um x 3 mm slit for shutter<br />
SR1-SLH-0100-3 100um x 3 mm slit for shutter<br />
SR1-SLH-0200-3 200 um x 3 mm slit for shutter<br />
SR1-SLT-0010-3 10 um x 3 mm slit<br />
SR1-SLT-0025-3 25 um x 3 mm slit<br />
SR1-SLT-0050-3 50 um x 3 mm slit<br />
SR1-SLT-0075-3 75 um x 3 mm slit<br />
SR1-SLT-0100-3 100 um x 3 mm slit<br />
SR1-SLT-0200-3 200 um x 3 mm slit<br />
SR3-GRT-0050-0600 Grating 50 l/mm, 600 nm blaze<br />
SR3-GRT-0060-0750 Grating 60 l/mm, 750 nm blaze<br />
SR3-GRT-0120-0330 Grating 120 l/mm, 330nm blaze<br />
SR3-GRT-0150-0300 Grating 150 l/mm, 300 nm blaze<br />
SR3-GRT-0150-0500 Grating 150 l/mm, 500 nm blaze<br />
SR3-GRT-0150-0800 Grating 150 l/mm, 800nm blaze<br />
SR3-GRT-0150-1250 Grating 150 l/mm, 1250 nm blaze<br />
SR3-GRT-0150-2000 Grating 150 l/mm, 2000 nm blaze<br />
SR3-GRT-0235-0750 Grating 235 l/mm, 750 nm blaze<br />
SR3-GRT-0300-0300 Grating 300 l/mm, 300 nm blaze<br />
Page 61
Spectrographs cont.<br />
SR3-GRT-0300-0500 Grating 300 l/mm, 500 nm blaze<br />
SR3-GRT-0300-0760 Grating 300 l/mm, 760 nm blaze<br />
SR3-GRT-0300-1000 Grating 300 l/mm, 1000 nm blaze<br />
SR3-GRT-0300-1200 Grating 300 l/mm, 1200 nm blaze<br />
SR3-GRT-0300-1700 Grating 300 l/mm, 1700 nm blaze<br />
SR3-GRT-0300-2000 Grating 300 l/mm, 2000 nm blaze<br />
SR3-GRT-0300-3000 Grating 300 l/mm, 3000 nm blaze<br />
SR3-GRT-0400-0850 Grating 400 l/mm, 850 nm blaze<br />
SR3-GRT-0500-0230 Grating 500 l/mm, 230 nm blaze<br />
SR3-GRT-0600-0300 Grating 600 l/mm, 300 nm blaze<br />
SR3-GRT-0600-0400 Grating 600 l/mm, 400 nm blaze<br />
SR3-GRT-0600-0500 Grating 600 l/mm, 500 nm blaze<br />
SR3-GRT-0600-0650 Grating 600 l/mm, 650 nm blaze<br />
SR3-GRT-0600-0750 Grating 600 l/mm, 750 nm blaze<br />
SR3-GRT-0600-1000 Grating 600 l/mm, 1000 nm blaze<br />
SR3-GRT-0600-1200 Grating 600 l/mm, 1200 nm blaze<br />
SR3-GRT-0900-0550 Grating 900 l/mm, 550 nm blaze<br />
SR3-GRT-1000-0250 Grating 1000 l/mm, 250 nm blaze<br />
Shamrock 500i/750 & specific accessories<br />
SR-500I-A SR500i base, single entrance slit, CCD exit port<br />
SR-500I- B1 SR500i base, single entrance and exit slit, CCD exit port<br />
SR-500I-B2 SR500i base, single entrance slit, dual CCD exit ports<br />
SR-500I-C SR500i base, double entrance slit, CCD exit port<br />
SR-500I-D1 SR500i base, double entrance slit, CCD exit port and<br />
exit slit<br />
SR-500I-D2 SR500i base, double entrance slit, dual CCD exit port<br />
SR-750-A SR750 base, single entrance slit, CCD exit port<br />
SR-750-B1 SR750 base, single entrance and exit slit, CCD exit port<br />
SR-750-B2 SR750 base, single entrance slit, dual CCD exit ports<br />
SR-750-C SR750 base, double entrance slit, CCD exit port<br />
SR-750-D1 SR750 base, double entrance slit, CCD exit port and<br />
exit slit<br />
SR-750-D2 SR750 base, double entrance slit, dual CCD exit port<br />
MFL-SR500 CCD mounting flange kit<br />
MFL-SR500-IXON iXon mounting flange kit<br />
SR-ASM-0025 Manual slit assembly baffle, 6W x 4H<br />
SR-ASM-0026 Manual slit assembly baffle, 6W x 6H<br />
SR-ASM-0027 Manual slit assembly baffle, 6W x 8H<br />
SR-ASM-0028 Manual slit assembly baffle, 6W x 10H<br />
Page 62<br />
SR3-GRT-1000-1300 Grating 1000 l/mm, 1300 nm blaze<br />
SR3-GRT-1200-0300 Grating 1200 l/mm, 300 nm blaze<br />
SR3-GRT-1200-0350 Grating 1200 l/mm, 350 nm blaze<br />
SR3-GRT-1200-0400 Grating 1200 l/mm, 400 nm blaze<br />
SR3-GRT-1200-0500 Grating 1200 l/mm, 500 nm blaze<br />
SR3-GRT-1200-0600 Grating 1200 l/mm, 600 nm blaze<br />
SR3-GRT-1200-0750 Grating 1200 l/mm, 750 nm blaze<br />
SR3-GRT-1200-1000 Grating 1200 l/mm, 1000 nm blaze<br />
SR3-GRT-1200-1100 Grating 1200 l/mm, 1100 nm blaze<br />
SR3-GRT-1200-EH Grating 1200 l/mm, Holographic, 400-1200 nm<br />
SR3-GRT-1800-0500 Grating 1800 l/mm, 500 nm blaze<br />
SR3-GRT-1800-DH Grating 1800 l/mm, Holographic, 190-900 nm<br />
SR3-GRT-1800-FH Grating 1800 l/mm, Holographic, 350-900 nm<br />
SR3-GRT-2400-0300 Grating 2400 l/mm, 300 nm blaze<br />
SR3-GRT-2400-BH Grating 2400 l/mm, Holographic, 190-800 nm<br />
SR3-GRT-2400-GH Grating 2400 l/mm, Holographic, 250-600 nm<br />
SR3-GRT-MR-AL+MGF2 Shamrock SR-303i flat mirror for grating turret,<br />
Al+MgF 2 coating<br />
SR-ASM-0029 Manual slit assembly baffle, 6W x 14H<br />
SR-ASM-0059 Additionnal blank grating turret<br />
SR-ASM-0062 Exit port slit adapter for CCD flange<br />
SR-ASZ-0030 Manual exit port slit<br />
SR-ASZ-0032 Motorized entrance slit (front port)<br />
SR-ASZ-0033 SR750 InGaAs camera flange<br />
SR-ASZ-0035 Motorized entrance slit (side port)<br />
SR-ASZ-0036 Motorized slit for second exit port<br />
SR-ASZ-7005 Motorized filter wheel<br />
SR-SHT-9002 Shutter for entrance ports<br />
SR5-GRT-0075-12000 Grating, 75 l/mm blazed at 12000 nm<br />
SR5-GRT-0085-1350 Grating, 85 l/mm blazed at 1350 nm<br />
SR5-GRT-0150-0300 Grating, 150 l/mm blazed at 300 nm<br />
SR5-GRT-0150-0500 Grating, 150 l/mm blazed at 500 nm<br />
SR5-GRT-0150-0800 Grating, 150 l/mm blazed at 800 nm<br />
SR5-GRT-0150-1250 Grating, 150 l/mm blazed at 1250 nm<br />
SR5-GRT-0150-2000 Grating, 150 l/mm blazed at 2000 nm<br />
SR5-GRT-0150-8000 Grating, 150 l/mm blazed at 8000 nm<br />
SR5-GRT-0300-0300 Grating, 300 l/mm blazed at 300 nm
Spectrographs cont.<br />
SR5-GRT-0300-0500 Grating, 300 l/mm blazed at 500 nm<br />
SR5-GRT-0300-0760 Grating, 300 l/mm blazed at 760 nm<br />
SR5-GRT-0300-1000 Grating, 300 l/mm blazed at 1000 nm<br />
SR5-GRT-0300-1200 Grating, 300 l/mm blazed at 1200 nm<br />
SR5-GRT-0300-1700 Grating, 300 l/mm blazed at 1700 nm<br />
SR5-GRT-0300-2000 Grating, 300 l/mm blazed at 2000 nm<br />
SR5-GRT-0300-3000 Grating, 300 l/mm blazed at 3000 nm<br />
SR5-GRT-0300-4800 Grating, 300 l/mm blazed at 4800 nm<br />
SR5-GRT-0600-0300 Grating, 600 l/mm blazed at 300 nm<br />
SR5-GRT-0600-0500 Grating, 600 l/mm blazed at 500 nm<br />
SR5-GRT-0600-0750 Grating, 600 l/mm blazed at 750 nm<br />
SR5-GRT-0600-1000 Grating, 600 l/mm blazed at 1000 nm<br />
SR5-GRT-0600-1200 Grating, 600 l/mm blazed at 1200 nm<br />
SR5-GRT-0600-1600 Grating, 600 l/mm blazed at 1600 nm<br />
SR5-GRT-0600-1900 Grating, 600 l/mm blazed at 1900 nm<br />
SR5-GRT-0600-2500 Grating, 600 l/mm blazed at 2500 nm<br />
SR5-GRT-0720-2000 Grating, 720 l/mm blazed at 2000 nm<br />
Shamrock 303i, 500i and 750 generic accessories<br />
ACC-SR-ASZ-0056 Sample chamber<br />
SR-ASM-0002 Oriel 1.5" flange adapter<br />
SR-ASM-0010 Motorized slit baffle - 6x8 mm (WxH)<br />
SR-ASM-0011 Motorized slit baffle - 6x14 mm (WxH)<br />
SR-ASM-0013 Nikon lens F-mount input adapter<br />
SR-ASM-0014 Pen ray lamp mount for entrance slit<br />
SR-ASM-0015 Motorized slit baffle - Ø15 mm<br />
SR-ASM-0016 Motorized slit baffle - 6x4 mm (WxH)<br />
SR-ASM-0017 Motorized slit baffle - 6x6 mm (WxH)<br />
Software<br />
ANDOR-SDK-CCD Software Development Kit - CCD and EMCCD<br />
ANDOR-SDK-ICCD Software Development Kit - ICCD<br />
ANDOR-SR-STANDALONE Shamrock standalone GUI interface<br />
SR5-GRT-0830-1200 Grating, 830 l/mm blazed at 1200 nm<br />
SR5-GRT-0900-0550 Grating, 900 l/mm blazed at 550 nm<br />
SR5-GRT-1000-1310 Grating, 1000 l/mm blazed at 1310 nm<br />
SR5-GRT-1200-0300 Grating, 1200 l/mm blazed at 300 nm<br />
SR5-GRT-1200-0500 Grating, 1200 l/mm blazed at 500 nm<br />
SR5-GRT-1200-0750 Grating, 1200 l/mm blazed at 750 nm<br />
SR5-GRT-1200-1000 Grating, 1200 l/mm blazed at 1000 nm<br />
SR5-GRT-1200-EH Grating 1200 l/mm, Holographic, 400-1200 nm<br />
SR5-GRT-1800-0500 Grating, 1800 l/mm blazed at 500 nm<br />
SR5-GRT-1800-DH Grating 1800 l/mm, Holographic, 190-900 nm<br />
SR5-GRT-1800-FH Grating 1800 l/mm, Holographic, 350-900 nm<br />
SR5-GRT-2400-0240 Grating, 2400 l/mm blazed at 240 nm<br />
SR5-GRT-2400-0300 Grating, 2400 l/mm blazed at 300 nm<br />
SR5-GRT-2400-BH Grating 2400 l/mm, Holographic, 190-800 nm<br />
SR5-GRT-2400-GH Grating 2400 l/mm, Holographic, 250-600 nm<br />
SR-ASM-0021 C-mount input adapter<br />
SR-ASM-0038 F/Matcher for SR-303i, 11 mm ferrule input<br />
SR-ASM-0039 F/Matcher for 500i, ferrule input<br />
SR-ASM-0040 F/Matcher for 750, ferrule input<br />
SR-ASM-0041 SMA adaptor for F/matcher<br />
SR-ASM-0065 Cage system adapter<br />
SR-ASM-8006 X-adjustable fibre ferrule adapter<br />
SR-ASM-8010 XY adjustable fibre ferrule adapter<br />
SR-ASM-8040 Purge plug for Shamrock<br />
SOLIS (S) Solis <strong>Spectroscopy</strong> Software<br />
SOLIS (SC) Solis Scanning monochromator Software<br />
Page 63
<strong>Andor</strong> Customer Support<br />
<strong>Andor</strong> products are regularly used in critical applications and we can provide a<br />
variety of customer support services to maximise the return on your investment and<br />
ensure that your product continues to operate at its optimum performance.<br />
<strong>Andor</strong> has customer support teams located across North America, Asia and<br />
Europe, allowing us to provide local technical assistance and advice. Requests<br />
for support can be made at any time by contacting our technical support team at<br />
andor.com/support.<br />
<strong>Andor</strong> offers a variety of support under the following format:<br />
• On-site product specialists can assist you with the installation and<br />
commissioning of your chosen product<br />
• Training services can be provided on-site or remotely via the Internet<br />
• A testing service to confirm the integrity and optimize the performance of<br />
existing equipment in the field is also available on request.<br />
A range of extended warranty packages are available for <strong>Andor</strong> products giving you<br />
the flexibility to choose one appropriate for your needs. These warranties allow you<br />
to obtain additional levels of service and include both on-site and remote support<br />
options, and may be purchased on a multi-year basis allowing users to fix their<br />
support costs over the operating lifecycle of the products.<br />
Head Office<br />
7 Millennium Way<br />
Springvale Business Park<br />
Belfast BT12 7AL<br />
Northern Ireland<br />
Tel: +44 (28) 9023 7126<br />
Fax: +44 (28) 9031 0792<br />
North America<br />
425 Sullivan Avenue<br />
Suite 3<br />
South Windsor, CT 06074<br />
USA<br />
Tel: +1 (860) 290 9211<br />
Fax: +1 (860) 290 9566<br />
Japan<br />
4F NE Sarugakucho Building<br />
2-7-6 Sarugaku-Cho<br />
Chiyoda-Ku<br />
Tokyo 101-0064<br />
Japan<br />
Tel: +81 (3) 3518 6488<br />
Fax: +81 (3) 3518 6489<br />
China<br />
Room 1213, Building B<br />
Luo Ke Time Square<br />
No. 103 Huizhongli<br />
Chaoyang District<br />
Beijing 100101<br />
China<br />
Tel: +86 (10) 5129 4977<br />
Fax: +86 (10) 6445 5401<br />
SSB 1112