Final Report
Final Report
Final Report

You also want an ePaper? Increase the reach of your titles
YUMPU automatically turns print PDFs into web optimized ePapers that Google loves.
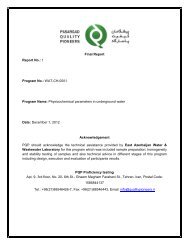
<strong>Final</strong> <strong>Report</strong><br />
<strong>Report</strong> No.: 4<br />
Program No.: WAT-CL-0001<br />
Program Name: Residual chlorine in water<br />
Date: March 12, 2013<br />
Acknowledgement<br />
PQP should acknowledge the technical assistance provided by East Azerbaijan Water &<br />
Wastewater Laboratory for this program which was included technical advice in different<br />
stages of this program including design, execution and evaluation of participants results.<br />
PQP Proficiency testing<br />
Apt. 9- 3rd floor- No. 20- 6th St.- Ghaem Magham Farahani St., Tehran- Iran, Postal Code:<br />
1586844137<br />
Tel.: +98(21)88546426-7, Fax: +98(21)88546443, Email: info@qualitypioneers.ir
<strong>Report</strong> No.: 4<br />
This page intentionally left blank.<br />
Page 2 of 17
<strong>Report</strong> No.: 4<br />
Table of Contents<br />
1. Introduction ....................................................................................................................... 5<br />
2- Test Materials ....................................................................................................................... 5<br />
2-1- Preparation of samples ................................................................................................. 5<br />
2-2- Samples homogeneity .................................................................................................. 5<br />
2-3- Samples Stability .......................................................................................................... 5<br />
2-4- Distribution .................................................................................................................... 5<br />
3- Statistical design of the program ....................................................................................... 5<br />
4- Features of the program ...................................................................................................... 6<br />
4-1- Number of Participants ................................................................................................. 6<br />
4-2- Supplied samples .......................................................................................................... 6<br />
4-3- Parameters .................................................................................................................... 6<br />
4-4- Participants instruction ................................................................................................ 6<br />
4-5- Confidentiality ............................................................................................................... 6<br />
4-6- Appeals .......................................................................................................................... 6<br />
5- Summary of results ............................................................................................................. 7<br />
6- Statistical evaluation of results .......................................................................................... 7<br />
6-1- General........................................................................................................................... 7<br />
6-2- Calculation of assigned value ...................................................................................... 7<br />
6-3- Standard deviation for proficiency assessment (SDPA) ............................................ 7<br />
6-4- Measurement uncertainty of the assigned value (u x ) ................................................. 7<br />
6-5- Purpose of performance scoring ................................................................................. 7<br />
6-6- z-scores ......................................................................................................................... 8<br />
7- PQP and technical advisor comments ............................................................................... 8<br />
7-1- Metrological Traceability of Assigned Values ............................................................. 8<br />
7-2- Methodology summary ................................................................................................. 8<br />
7-3- Overall performance ..................................................................................................... 9<br />
8- References ........................................................................................................................... 9<br />
Appendix A- Results and data analysis .................................................................................10<br />
Appendix B- Homogeneity and stability testing ...................................................................14<br />
B-1- Homogeneity testing ...................................................................................................14<br />
B-2- Stability testing ............................................................................................................15<br />
Page 3 of 17
<strong>Report</strong> No.: 4<br />
Appendix C- Documents .....................................................................................................16<br />
C-1- Instructions to participants .........................................................................................16<br />
C-2- Results Sheet ...............................................................................................................17<br />
Page 4 of 17
<strong>Report</strong> No.: 4<br />
1. Introduction<br />
This report is a summary of the results of participating laboratories in proficiency testing<br />
program residual chlorine in water round no. 1. The aim of this program is to enable<br />
laboratories to monitor and improve the quality of their routine analytical measurements, for the<br />
benefit of their customers. It also enables laboratories to demonstrate to customers, regulators<br />
and accreditation bodies the validity of their analytical measurements.<br />
Participation in PQP proficiency testing provides independent evidence of laboratory<br />
performance for both laboratory management and customers.<br />
This proficiency testing was performed by Pasargad Quality Pioneers (PQP) in February, 2013.<br />
The program coordinator was Ms. Bahar Hosseinzadeh. This report was authorized by Mr.<br />
Hamidreza Dehnad, PQP proficiency testing technical manager on March 12, 2013<br />
Signature:<br />
2- Test Materials<br />
2-1- Preparation of samples<br />
The test material was prepared by ERA Company. The samples distributed to the participants<br />
were Certified Reference Materials with ERA code 696 Lot No. S193-696.<br />
2-2- Samples homogeneity<br />
Certified reference materials with the same lot number were supplied to the participants. ERA is<br />
a reference material producer and has been accredited by A2LA according to ISO/IEC Guide<br />
34: 2009, Certificate no. 1539.03 so it can be concluded that the samples are considered to be<br />
adequately homogenous therefore any results later identified as outliers could not be attributed<br />
to sample variability.<br />
2-3- Samples Stability<br />
Certified reference materials with the same lot number were supplied to the participants. ERA is<br />
a reference material producer and has been accredited by A2LA according to ISO/IEC Guide<br />
34: 2009, Certificate no. 1539.03. In the material certificate of analysis the expiry date is defined<br />
as July 31, 2016 so it can be concluded that the samples are considered to be adequately<br />
stable therefore any results later identified as outliers could not be attributed to sample<br />
instability.<br />
2-4- Distribution<br />
The dispatch date was February 12, 2013. Each laboratory received 1 x 2mL sample together<br />
with a covering letter, participants instruction and a result sheet.<br />
3- Statistical design of the program<br />
Participating laboratories were each supplied 1 x 2mL sample labeled “Sample 1 (WAT-CL-<br />
0001)”. One result was reported for all tests. For each statistically analysed test, robust<br />
statistical procedures were used to generate the z-scores and summary statistics for each test.<br />
Page 5 of 17
<strong>Report</strong> No.: 4<br />
The assigned value (X) and the standard deviation of proficiency assessment ( ) has been<br />
determined according to the criteria given in clause 6 of this report.<br />
4- Features of the program<br />
4-1- Number of Participants<br />
A total of 6 laboratories received samples. A total of 6 laboratories returned results for inclusion<br />
in this report.<br />
4-2- Supplied samples<br />
Participating laboratories were each supplied 1 x 2mL sample labeled “Sample 1 (WAT-CL-<br />
0001)”.<br />
4-3- Parameters<br />
The following determinations were to be performed on the samples:<br />
<br />
<br />
Free residual chlorine<br />
Total residual chlorine<br />
4-4- Participants instruction<br />
Laboratories were requested to perform the tests according to the “Instructions to Participants"<br />
and to record their results on the accompanying "Results Sheet”, all of which were distributed to<br />
participants with the samples (Appendix C).<br />
The methods used by each participant are summarized in Appendix A.<br />
4-5- Confidentiality<br />
Each laboratory was randomly allocated a unique code number for the program to enable<br />
confidentiality of results. Reference to each laboratory in this report is made by its code number.<br />
National Water and Wastewater Engineering Company as a regulatory authority has requested<br />
PQP to directly provide the proficiency testing results to them so the performance of the affected<br />
participants i.e. laboratories of water and wastewater companies in this program has also been<br />
reported to National Water and Wastewater Engineering Company.<br />
4-6- Appeals<br />
The participants are able to appeal against the evaluation of their performance in this program<br />
through the program coordinator. In one week period after receiving the appeal, PQP sends a<br />
letter to the participant to acknowledge the receipt of the appeal and ensure the participant that<br />
their appeal will be handled in a timely manner.<br />
The participant will be notified of the results after the actions are confirmed with a response<br />
letter.<br />
Page 6 of 17
<strong>Report</strong> No.: 4<br />
5- Summary of results<br />
Results for this proficiency test are summarized as follows:<br />
Test<br />
Free residual<br />
chlorine<br />
Total residual<br />
chlorine<br />
No. of<br />
Results<br />
Assigned<br />
Value<br />
(mg/L)<br />
SDPA 1<br />
( )<br />
Expanded<br />
uncertainty of<br />
the assigned<br />
value (U x )<br />
No. of<br />
satisfactory<br />
scores<br />
( )<br />
Satisfactory<br />
(%)<br />
6 0.78 0.085 5.80% 3 50.0<br />
1 0.78 0.061 5.80% 1 100.0<br />
6- Statistical evaluation of results<br />
6-1- General<br />
The object of the statistical procedure employed is to obtain a simple and transparent result,<br />
which the participant and other interested parties can readily appreciate. The procedure follows<br />
that recommended in ISO 13528: 2005, Statistical methods for use in proficiency testing by<br />
interlaboratory comparisons.<br />
6-2- Calculation of assigned value<br />
The assigned value is the value selected as being the best estimate of the ‘true value’ for the<br />
parameter under test.<br />
Since the material used in this proficiency test is a certified reference material (CRM), its<br />
certified reference value is used as the assigned value X.<br />
6-3- Standard deviation for proficiency assessment (SDPA)<br />
The standard deviation used to assess the proficiency of participants in this round of scheme<br />
is calculated using fixed acceptance criteria specified in US NELAC 2 proficiency testing<br />
requirements.<br />
6-4- Measurement uncertainty of the assigned value (u x )<br />
The uncertainty of the assigned value is derived from the information on uncertainty provided on<br />
the certificate on analysis.<br />
6-5- Purpose of performance scoring<br />
Once the assigned value for the parameters under test has been established, participant<br />
laboratories are assessed on the difference between their result and the assigned value, with<br />
this difference being represented by a performance score, normally the z-score. The<br />
advantages of a z-score are:<br />
- Results can be expressed in a form that is relatively easy to interpret and understand<br />
1 Standard Deviation of Proficiency Assessment<br />
2 National Environmental Laboratory Accreditation Conference<br />
Page 7 of 17
<strong>Report</strong> No.: 4<br />
- Results can be summarized in graphical or tabular form to depict overall performance<br />
- A performance score allows participants to directly compare their own result with others<br />
- If consistent statistical values are applied, a performance score enables participants to<br />
monitor and trend their own performance over time.<br />
6-6- z-scores<br />
Z-score of the participants is calculated using the following formula:<br />
In which:<br />
x: participant result<br />
µ: assigned value<br />
SDPA: Standard deviation for proficiency assessment<br />
For the purposes of performance assessment for a single round, z scores are interpreted as<br />
follows:<br />
Z-Score<br />
Interpretation<br />
Satisfactory Result<br />
Questionable result<br />
Unsatisfactory result<br />
7- PQP and technical advisor comments<br />
7-1- Metrological Traceability of Assigned Values<br />
The assigned value is a certified value reported in the material COA 3 (ERA Catalog No. 696).<br />
ERA standards or their stock solutions are analysed against the applicable NIST 4 SRM 5 listed in<br />
the certificate so it can be assumed that the assigned value is metrologically traceable. All<br />
gravimetric and volumetric measurements related to its manufacture are traceable to NIST<br />
through an unbroken chain of comparisons.<br />
7-2- Methodology summary<br />
Participants’ methods are tabulated according to the information supplied by the participants.<br />
Free residual chlorine<br />
Method<br />
Number of<br />
results<br />
% of total Sat. (%)<br />
Colorimetry 5 83.3 60<br />
Titration 1 16.7 0<br />
3 Certificate of Analysis<br />
4 National Institute of Standards and Technology<br />
5 Standard Reference Materials<br />
Page 8 of 17
<strong>Report</strong> No.: 4<br />
Total residual chlorine<br />
Method<br />
Number of<br />
results<br />
% of total Sat. (%)<br />
Colorimetry 1 100.0 100<br />
7-3- Overall performance<br />
Colorimetry method is a suitable method for analyzing residual chlorine. Calibration of the<br />
instrument before analysis is very important in this method.<br />
8- References<br />
1- ISO/IEC 17025: 2005, general requirements for the competence of testing and<br />
calibration laboratories.<br />
2- ISO/IEC 17043: 2010, Conformity assessment — General requirements for proficiency<br />
testing<br />
3- ISO 13528: 2005, Statistical methods for use in proficiency testing by interlaboratory<br />
comparisons<br />
4- PR-14- rev. 00, PQP Performance evaluation Procedure<br />
5- PR-15- rev. 00, PQP Homogeneity and stability Procedure<br />
Page 9 of 17
Frequency<br />
<strong>Report</strong> No.: 4<br />
Appendix A- Results and data analysis<br />
Free residual chlorine<br />
Lab. Code Method Result (mg/L) Z-score<br />
Data Statistics<br />
4 Colorimetry 0.60 -2.12<br />
13 Titration 0.50 -3.29<br />
14 Colorimetry 0.49 -3.41<br />
33 Colorimetry 0.78 0.00<br />
34 Colorimetry 0.90 1.41<br />
35 Colorimetry 0.63 -1.76<br />
Number of results 6<br />
Number of excluded results* 0<br />
Assigned value 0.78<br />
Uncertainty of assigned 0.02<br />
value<br />
SDPA 0.085<br />
* The influence of outliers on summary statistics has been minimized by the use of robust<br />
statistical methods but obvious blunders, such as those with incorrect units, decimal point<br />
errors, and results for a different proficiency test item are removed from the data set and treated<br />
separately. These results are not the subject to outlier tests or robust statistical methods.<br />
2.5<br />
Histogram of participants Z-scores for Free<br />
Residual Chlorine<br />
2<br />
1.5<br />
1<br />
0.5<br />
0<br />
-4 -3 -2 -1 0 1 2 More<br />
Z-scores<br />
Page 10 of 17
Z-score<br />
<strong>Report</strong> No.: 4<br />
4<br />
3<br />
2<br />
1<br />
0<br />
-1<br />
14 13 4 35 33 34<br />
-2<br />
-3<br />
-4<br />
Lab No.<br />
Methodology Summary<br />
Method<br />
Number of<br />
results<br />
% of total Sat. (%)<br />
Colorimetry 5 83.3 60<br />
Titration 1 16.7 0<br />
Page 11 of 17
Frequency<br />
<strong>Report</strong> No.: 4<br />
Total residual chlorine<br />
Lab. Code Method Result (mg/L) Z-score<br />
34 Colorimetry 0.9 1.98<br />
Data Statistics<br />
Number of results 1<br />
Number of excluded 0<br />
results*<br />
Assigned value 0.78<br />
Uncertainty of assigned 0.02<br />
value<br />
SDPA 0.061<br />
* The influence of outliers on summary statistics has been minimized by the use of robust<br />
statistical methods but obvious blunders, such as those with incorrect units, decimal point<br />
errors, and results for a different proficiency test item are removed from the data set and treated<br />
separately. These results are not the subject to outlier tests or robust statistical methods.<br />
1.2<br />
Histogram of participants Z-scores for Total<br />
Residual Chlorine<br />
1<br />
0.8<br />
0.6<br />
0.4<br />
0.2<br />
0<br />
1 2 More<br />
Z-scores<br />
Page 12 of 17
Z-score<br />
<strong>Report</strong> No.: 4<br />
4<br />
3<br />
2<br />
1<br />
0<br />
-1<br />
34<br />
-2<br />
-3<br />
-4<br />
Lab No.<br />
Methodology Summary<br />
Method<br />
Number of<br />
results<br />
% of total Sat. (%)<br />
Colorimetry 1 100.0 100<br />
Page 13 of 17
<strong>Report</strong> No.: 4<br />
Appendix B- Homogeneity and stability testing<br />
B-1- Homogeneity testing<br />
Certified reference materials with the same lot number were supplied to the participants. ERA is<br />
a reference material producer and has been accredited by A2LA according to ISO/IEC Guide<br />
34: 2009, Certificate no. 1539.03 so it can be concluded that the samples are considered to be<br />
adequately homogenous therefore any results later identified as outliers could not be attributed<br />
to sample variability.<br />
Page 14 of 17
<strong>Report</strong> No.: 4<br />
B-2- Stability testing<br />
Certified reference materials with the same lot number were supplied to the participants. ERA is<br />
a reference material producer and has been accredited by A2LA according to ISO/IEC Guide<br />
34: 2009, Certificate no. 1539.03. In the material certificate of analysis the expiry date is defined<br />
as July 31, 2016 so it can be concluded that the samples are considered to be adequately<br />
stable therefore any results later identified as outliers could not be attributed to sample<br />
instability.<br />
Page 15 of 17
<strong>Report</strong> No.: 4<br />
Appendix C- Documents<br />
C-1- Instructions to participants<br />
Sample WAT-CL-0001 Preparation Instruction<br />
Materials Supplied:<br />
WAT-CL-0001<br />
- One 2 mL screw-cap vial labeled as<br />
Sample 1 (WAT-CL-0001)<br />
Sample 1 (WAT-CL-0001)<br />
-<br />
Preparation:<br />
1- Add 100-200 mL of organic/chlorine-free<br />
water to a clean 1000 mL class A volumetric<br />
flask.<br />
2- Carefully snap the top off of the Residual<br />
Chlorine ampule.<br />
3- Using a clean, dry, class A pipet,<br />
volumetrically pipet 1.0 mL of the concentrate<br />
into the 1000 mL volumetric flask.<br />
4- Dilute the flask to final volume with<br />
organic/chlorine-free water.<br />
5- Cap the flask and mix well.<br />
6- Immediately analyze the diluted sample by<br />
your normal procedures.<br />
7- <strong>Report</strong> your results as mg/L for the diluted<br />
sample<br />
1.0 mL<br />
mg/L<br />
A<br />
A<br />
100-200 mL<br />
1000 mL<br />
1000 mL<br />
Remarks:<br />
1- The result should be reported in the results<br />
sheet form and the test method should be<br />
specified.<br />
2- The laboratory should calculate and report<br />
the expanded measurement uncertainty with<br />
95% confidence interval (coverage factor<br />
k=2). It should be noted that the reported<br />
value of uncertainty won’t be used for<br />
performance evaluation of your laboratory.<br />
3- The sample can be stored at room<br />
temperature.<br />
4- This concentrate is not preserved.<br />
k=2<br />
Page 16 of 17
<strong>Report</strong> No.: 4<br />
C-2- Results Sheet<br />
Residual chlorine in water proficiency testing program- Round 1<br />
WAT-CL-0001 :(Program No.)<br />
(Laboratory Code)<br />
Parameter Result Unit<br />
(±MU)<br />
Method<br />
Free Residual<br />
Chlorine<br />
mg/L<br />
Total Residual<br />
Chlorine<br />
mg/L<br />
(Signature)<br />
(Date)<br />
Page 17 of 17