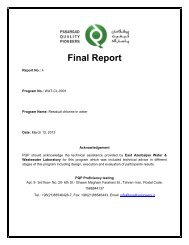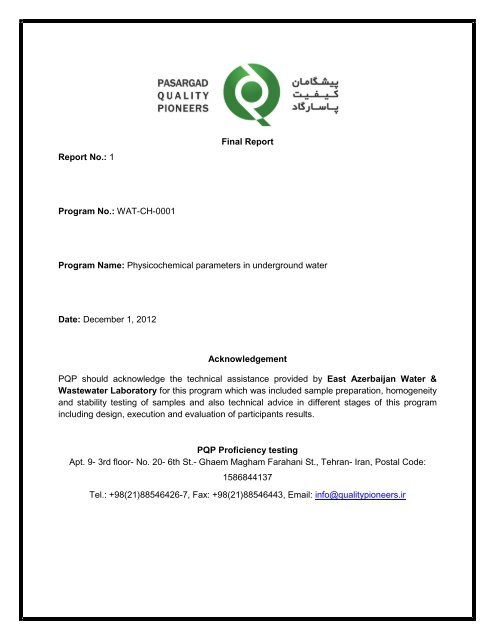
Final Report Report No.: 1 Program No.: WAT-CH-0001 Program ...
Final Report Report No.: 1 Program No.: WAT-CH-0001 Program ...
Final Report Report No.: 1 Program No.: WAT-CH-0001 Program ...

Create successful ePaper yourself
Turn your PDF publications into a flip-book with our unique Google optimized e-Paper software.
<strong>Report</strong> <strong>No</strong>.: 1<br />
<strong>Final</strong> <strong>Report</strong><br />
<strong>Program</strong> <strong>No</strong>.: <strong>WAT</strong>-<strong>CH</strong>-<strong>0001</strong><br />
<strong>Program</strong> Name: Physicochemical parameters in underground water<br />
Date: December 1, 2012<br />
Acknowledgement<br />
PQP should acknowledge the technical assistance provided by East Azerbaijan Water &<br />
Wastewater Laboratory for this program which was included sample preparation, homogeneity<br />
and stability testing of samples and also technical advice in different stages of this program<br />
including design, execution and evaluation of participants results.<br />
PQP Proficiency testing<br />
Apt. 9- 3rd floor- <strong>No</strong>. 20- 6th St.- Ghaem Magham Farahani St., Tehran- Iran, Postal Code:<br />
1586844137<br />
Tel.: +98(21)88546426-7, Fax: +98(21)88546443, Email: info@qualitypioneers.ir
<strong>Report</strong> <strong>No</strong>.: 1<br />
This page intentionally left blank.<br />
Page 2 of 57
<strong>Report</strong> <strong>No</strong>.: 1<br />
Table of Contents<br />
1. Introduction ....................................................................................................................... 5<br />
2- Test Materials ....................................................................................................................... 5<br />
2-1- Preparation of samples ................................................................................................. 5<br />
2-2- Samples homogeneity .................................................................................................. 5<br />
2-3- Samples Stability .......................................................................................................... 5<br />
2-4- Distribution .................................................................................................................... 5<br />
3- Statistical design of the program ....................................................................................... 5<br />
4- Features of the program ...................................................................................................... 6<br />
4-1- Number of Participants ................................................................................................. 6<br />
4-2- Supplied samples .......................................................................................................... 6<br />
4-3- Parameters .................................................................................................................... 6<br />
4-4- Participants instruction ................................................................................................ 6<br />
4-5- Confidentiality ............................................................................................................... 6<br />
4-6- Appeals .......................................................................................................................... 7<br />
5- Summary of results ............................................................................................................. 7<br />
6- Statistical evaluation of results .......................................................................................... 8<br />
6-1- General........................................................................................................................... 8<br />
6-2- Calculation of assigned value ...................................................................................... 8<br />
6-3- Standard deviation for proficiency assessment (SDPA) ............................................ 9<br />
6-4- Measurement uncertainty of the assigned value (u x ) ................................................. 9<br />
6-5- Purpose of performance scoring ................................................................................. 9<br />
6-6- z-scores ......................................................................................................................... 9<br />
7- PQP and technical advisor comments ..............................................................................10<br />
7-1- Metrological Traceability of Assigned Values ............................................................10<br />
7-2- Methodology summary ................................................................................................10<br />
7-3- Overall performance ....................................................................................................12<br />
8- References ..........................................................................................................................13<br />
Appendix A- Results and data analysis .................................................................................14<br />
Appendix B- Homogeneity and stability testing ...................................................................46<br />
B-1- Homogeneity testing ...................................................................................................46<br />
B-2- Stability testing ............................................................................................................54<br />
Page 3 of 57
<strong>Report</strong> <strong>No</strong>.: 1<br />
Appendix C- Documents .....................................................................................................55<br />
C-1- Instructions to participants .........................................................................................55<br />
C-2- Results Sheet ...............................................................................................................57<br />
Page 4 of 57
<strong>Report</strong> <strong>No</strong>.: 1<br />
1. Introduction<br />
This report is a summary of the results of participating laboratories in proficiency testing<br />
program Physicochemical parameters in underground water round no. 1. The aim of this<br />
program is to enable laboratories to monitor and improve the quality of their routine analytical<br />
measurements, for the benefit of their customers. It also enables laboratories to demonstrate to<br />
customers, regulators and accreditation bodies the validity of their analytical measurements.<br />
Participation in PQP proficiency testing provides independent evidence of laboratory<br />
performance for both laboratory management and customers.<br />
This proficiency testing was performed by Pasargad Quality Pioneers (PQP) in <strong>No</strong>vember,<br />
2012. The program coordinator was Ms. Bahar Hosseinzadeh. This report was authorized by<br />
Mr. Hamidreza Dehnad, PQP proficiency testing technical manager on December 1, 2012<br />
Signature:<br />
2- Test Materials<br />
2-1- Preparation of samples<br />
The test material was prepared by East Azerbaijan Water & Wastewater Laboratory. The<br />
samples were taken from one of the underground sources of drinking water in Tabriz.<br />
The samples were stored at 4 °C until dispatch.<br />
2-2- Samples homogeneity<br />
Ten randomly selected samples were analysed in duplicate for homogeneity by East<br />
Azerbaijan Water & Wastewater Laboratory. Based on the results of this testing, it was<br />
concluded that the samples were sufficiently homogeneous, therefore any results later identified<br />
as outliers could not be attributed to sample variability. The results of homogeneity testing have<br />
been summarized in Appendix B.<br />
2-3- Samples Stability<br />
Three randomly selected samples were analysed in duplicate for stability by East Azerbaijan<br />
Water & Wastewater Laboratory at a date later than homogeneity testing according to the<br />
results submission deadline defined for the participants. Based on the results of this testing, it<br />
was concluded that the samples were sufficiently stable during the period of program execution,<br />
therefore any results later identified as outliers could not be attributed to sample instability. The<br />
results of stability testing have been summarized in Appendix B.<br />
2-4- Distribution<br />
The dispatch date was <strong>No</strong>vember 4, 2012. Each laboratory received 2 x 1 L water samples<br />
together with a covering letter, participants instruction and a result sheet.<br />
3- Statistical design of the program<br />
Participating laboratories were each supplied 2 x 1 L water samples labeled “Sample 1 & 2<br />
(<strong>WAT</strong>-<strong>CH</strong>-<strong>0001</strong>)”. One result was reported for all tests. For each statistically analysed test,<br />
Page 5 of 57
<strong>Report</strong> <strong>No</strong>.: 1<br />
robust statistical procedures were used to generate the z-scores and summary statistics for<br />
each test.<br />
The assigned value (X) and the standard deviation of proficiency assessment ( ) has been<br />
determined according to the criteria given in clause 6 of this report.<br />
4- Features of the program<br />
4-1- Number of Participants<br />
A total of 31 laboratories received samples. A total of 27 laboratories returned results for<br />
inclusion in this report.<br />
4-2- Supplied samples<br />
Participating laboratories were each supplied 2 x 1 L water samples sample labeled “Sample 1<br />
& 2 (<strong>WAT</strong>-<strong>CH</strong>-<strong>0001</strong>)”.<br />
4-3- Parameters<br />
The following determinations were to be performed on the samples:<br />
<br />
<br />
<br />
<br />
<br />
<br />
<br />
<br />
<br />
<br />
<br />
Calcium<br />
Magnesium<br />
Total Hardness<br />
Alkalinity<br />
Sodium<br />
Potassium<br />
Chloride<br />
Sulphate<br />
Fluoride<br />
Conductivity<br />
Total Dissolved Solids (TDS)<br />
4-4- Participants instruction<br />
Laboratories were requested to perform the tests according to the “Instructions to Participants"<br />
and to record their results on the accompanying "Results Sheet”, all of which were distributed to<br />
participants with the samples (Appendix C).<br />
The methods used by each participant are summarized in Appendix A.<br />
4-5- Confidentiality<br />
Each laboratory was randomly allocated a unique code number for the program to enable<br />
confidentiality of results. Reference to each laboratory in this report is made by its code number.<br />
National Water and Wastewater Engineering Company as a regulatory authority has requested<br />
PQP to directly provide the proficiency testing results to them so the performance of the affected<br />
Page 6 of 57
<strong>Report</strong> <strong>No</strong>.: 1<br />
participants i.e. laboratories of water and wastewater companies in this program has also been<br />
reported to National Water and Wastewater Engineering Company.<br />
4-6- Appeals<br />
The participants are able to appeal against the evaluation of their performance in this program<br />
through the program coordinator. In one week period after receiving the appeal, PQP sends a<br />
letter to the participant to acknowledge the receipt of the appeal and ensure the participant that<br />
their appeal will be handled in a timely manner.<br />
The participant will be notified of the results after the actions are confirmed with a response<br />
letter.<br />
5- Summary of results<br />
Results for this proficiency test are summarized as follows:<br />
Test<br />
Calcium<br />
(mgCa/L)<br />
Magnesium<br />
(mgMg/L)<br />
Total Hardness<br />
(mgCaCO3/L)<br />
Alkalinity<br />
(mgCaCO3/L)<br />
Sodium<br />
(mgNa/L)<br />
Potassium<br />
(mgK/L)<br />
Choride<br />
(mgCl/L)<br />
Sulphate<br />
(mgSO4/L)<br />
<strong>No</strong>. of<br />
Results<br />
Assigned<br />
Value<br />
SDPA 1<br />
( )<br />
standard<br />
uncertainty<br />
of the<br />
assigned<br />
value (u x )<br />
<strong>No</strong>. of<br />
satisfactory<br />
scores<br />
( )<br />
Satisfactory<br />
(%)<br />
27 152.01 8.90 2.14 24 88.9<br />
27 29.73 4.64 1.12 25 92.6<br />
27 500.63 15.00 3.61 21 77.8<br />
26 334.10 10.04 2.46 17 65.4<br />
25 115.30 6.80 1.70 18 72.0<br />
24 6.65 0.77 0.21 21 87.5<br />
27 101.16 7.21 0.08 21 77.8<br />
27 268.50 19.48 4.69 20 74.1<br />
Fluoride (mgF/L) 25 0.43 0.23 0.058 --- ---<br />
Conductivity<br />
(µS/cm @ 25°C)<br />
Total Dissolved<br />
Solids (mg/L)<br />
27 1403.29 64.46 15.51 23 85.2<br />
26 880.22 109.78 26.91 25 96.2<br />
1 Standard Deviation of Proficiency Assessment<br />
Page 7 of 57
<strong>Report</strong> <strong>No</strong>.: 1<br />
6- Statistical evaluation of results<br />
6-1- General<br />
The object of the statistical procedure employed is to obtain a simple and transparent result,<br />
which the participant and other interested parties can readily appreciate. The procedure follows<br />
that recommended in ISO 13528: 2005, Statistical methods for use in proficiency testing by<br />
interlaboratory comparisons.<br />
6-2- Calculation of assigned value<br />
The assigned value is the value selected as being the best estimate of the ‘true value’ for the<br />
parameter under test. The assigned value X for the test material used in this round of a<br />
proficiency testing scheme is the robust average of the results reported by all the participants in<br />
the round using the below algorithm:<br />
Denote the p items of data, sorted into increasing order, by:<br />
x 1 , x 2 , ..., x i , ..., x p<br />
Denote the robust average and robust standard deviation of these data by x* and s*.<br />
Calculate initial values for x* and s* as:<br />
x* = median of x i (i = 1, 2, ..., p)<br />
s* = 1,483 median of x i − x * (i = 1, 2, ..., p)<br />
Update the values of x* and s* as follows. Calculate:<br />
δ = 1,5s*<br />
For each x i (i = 1, 2, ..., p), calculate:<br />
δ<br />
δ<br />
δ<br />
δ<br />
Calculate the new values of x* and s* from:<br />
The robust estimates x* and s* has been derived by an iterative calculation, i.e. by updating the<br />
values of x* and s* several times using the modified data, until the process converges.<br />
Convergence is assumed when there is no change from one iteration to the next in the third<br />
Page 8 of 57
<strong>Report</strong> <strong>No</strong>.: 1<br />
significant figure of the robust standard deviation and of the equivalent figure in the robust<br />
average.<br />
6-3- Standard deviation for proficiency assessment (SDPA)<br />
The standard deviation used to assess the proficiency of participants in this round of scheme<br />
is derived from the results reported by the participants in the round Two methods have been<br />
used for determination of SDPA as follows:<br />
Method 1: Robust standard deviation (s*)<br />
The standard deviation is the robust standard deviation of the results (s*) reported by all the<br />
participants, calculated using the algorithm in 6-2.<br />
Method 2: IQR<br />
The standard deviation is the interquartile range (IQR). IQR is a measure of the variability of the<br />
results. It is equal to the interquartile range (IQR) multiplied by a correction factor of 0.7413,<br />
which makes it comparable to a standard deviation. The interquartile range is the difference<br />
between the lower and upper quartiles. The lower quartile (Q1) is the value below which, as<br />
near as possible, a quarter of the results lie. Similarly the upper quartile (Q3) is the value above<br />
which a quarter of the results lie. The IQR = Q3 – Q1 and the normalised IQR = IQR × 0.7413.<br />
6-4- Measurement uncertainty of the assigned value (u x )<br />
The standard uncertainty of the assigned value X is estimated as:<br />
Where p is the number of participants.<br />
6-5- Purpose of performance scoring<br />
Once the assigned value for the parameters under test has been established, participant<br />
laboratories are assessed on the difference between their result and the assigned value, with<br />
this difference being represented by a performance score, normally the z-score. The<br />
advantages of a z-score are:<br />
- Results can be expressed in a form that is relatively easy to interpret and understand<br />
- Results can be summarized in graphical or tabular form to depict overall performance<br />
- A performance score allows participants to directly compare their own result with others<br />
- If consistent statistical values are applied, a performance score enables participants to<br />
monitor and trend their own performance over time.<br />
6-6- z-scores<br />
Z-score of the participants is calculated using the following formula:<br />
Page 9 of 57
<strong>Report</strong> <strong>No</strong>.: 1<br />
In which:<br />
x: participant result<br />
µ: assigned value<br />
SDPA: Standard deviation for proficiency assessment<br />
For the purposes of performance assessment for a single round, z scores are interpreted as<br />
follows:<br />
Z-Score<br />
Interpretation<br />
Satisfactory Result<br />
Questionable result<br />
Unsatisfactory result<br />
7- PQP and technical advisor comments<br />
7-1- Metrological Traceability of Assigned Values<br />
Consensus values derived from the participants’ results are used in this program. These values<br />
are not metrologically traceable to any external reference.<br />
7-2- Methodology summary<br />
Participants’ methods are tabulated according to the information supplied by the participants.<br />
Calcium<br />
Method<br />
Number of<br />
results<br />
% of total Median Sat. (%)<br />
Atomic Absorption Spectroscopy 1 3.7% 163.90 100%<br />
Ion chromatography 1 3.7% 149.94 100%<br />
Photometry 3 11.1% 146.00 67%<br />
Titration 21 77.8% 151.75 90%<br />
Other 1 3.7% 156.40 100%<br />
Magnesium<br />
Method<br />
Number of % of<br />
results total<br />
Median Sat. (%)<br />
Atomic Absorption Spectroscopy 1 3.7% 24.20 100%<br />
Calculation 15 55.6% 29.04 87%<br />
Ion Chromatography 1 3.7% 26.78 100%<br />
Photometry 4 14.8% 29.60 100%<br />
Titration 5 18.5% 29.00 100%<br />
Other 1 3.7% 28.8 100%<br />
Page 10 of 57
<strong>Report</strong> <strong>No</strong>.: 1<br />
Total hardness<br />
Method<br />
Number of<br />
results<br />
% of total Median Sat. (%)<br />
Photometry 3 11.1% 490.00 33%<br />
Titration 24 88.9% 501.50 83%<br />
Alkalinity<br />
Method<br />
Number of<br />
results<br />
% of total Median Sat. (%)<br />
Photometry 2 7.7% 325.00 100%<br />
Titration 24 92.3% 335.95 63%<br />
Comments: since only two laboratories have used photometry method so the comparison of<br />
two methods based on the satisfactory results is not suitabl and titration method is an<br />
acceptable method for analysis of alkalinity.<br />
Sodium<br />
Method<br />
Number<br />
of results<br />
% of total Median Sat. (%)<br />
Atomic Absorption Spectroscopy 2 8.0% 110.15 100%<br />
Calculation 1 4.0% 92.00 0%<br />
Flame Photometry 15 60.0% 117.50 67%<br />
Ion Chromatography 4 16.0% 119.10 100%<br />
Other 3 12.0% 103.50 67%<br />
Potassium<br />
Method<br />
Number<br />
of results<br />
% of total Median Sat. (%)<br />
Atomic Absorption Spectroscopy 2 8.3% 11.90 50%<br />
Flame Photometry 16 66.7% 6.67 94%<br />
Ion Chromatography 3 12.5% 6.57 100%<br />
Other 3 12.5% 5.00 67%<br />
Chloride<br />
Method<br />
Number of<br />
results<br />
% of total Median Sat. (%)<br />
Colorimetry 5 18.5% 96.00 60%<br />
Ion Chromatography 7 25.9% 98.43 100%<br />
titration 12 44.4% 104.75 83%<br />
other 3 11.1% 126.00 33%<br />
Page 11 of 57
<strong>Report</strong> <strong>No</strong>.: 1<br />
Sulphate<br />
Method<br />
Number of<br />
results<br />
% of total Median Sat. (%)<br />
Ion Chromatography 6 22.2% 271.40 100%<br />
Turbidimetry 17 63.0% 266.40 65%<br />
other 4 14.8% 266.50 75%<br />
Fluoride<br />
Method<br />
Number of<br />
results<br />
% of total Median Sat. (%)<br />
Ion Chromatography 6 25.0% 0.24 ---<br />
Spectrophotometry 14 58.3% 0.48 ---<br />
other 4 16.7% 0.38 ---<br />
Comments: in case of using ion chromatography method, the analysis should be done by using<br />
a suitable effluent and removal of interferences.<br />
Conductivity<br />
Method<br />
Number of<br />
results<br />
% of total Median Sat. (%)<br />
Conductivity Meter 24 88.9% 1399.50 88%<br />
other 3 11.1% 1408.00 67%<br />
Total Dissolved Solids<br />
Method<br />
Number of<br />
results<br />
% of total Median Sat. (%)<br />
Drying @ 180°C 12 46.2% 945.50 100%<br />
Calculation 4 15.4% 903.50 100%<br />
other 10 38.5% 777.00 90%<br />
7-3- Overall performance<br />
Samples have been collected and prepared according to standard methods for the examination<br />
of water and wastewater.<br />
Assigned values for each parameter have been determined form the participants results in this<br />
program and statistical calculations.<br />
In case of fluoride, due to the variations in the results the evaluation of participants performance<br />
is not possible. Since the analysis of fluoride is a very sensitive procedure and diferrent<br />
parameters such as sample and standards temperature can affect the measurement process so<br />
it is expected to improve the test methods results by carefully take the above mentioned<br />
cautions into consideration.<br />
Page 12 of 57
<strong>Report</strong> <strong>No</strong>.: 1<br />
8- References<br />
1- ISO/IEC 17025: 2005, general requirements for the competence of testing and<br />
calibration laboratories.<br />
2- ISO/IEC 17043: 2010, Conformity assessment — General requirements for proficiency<br />
testing<br />
3- ISO 13528: 2005, Statistical methods for use in proficiency testing by interlaboratory<br />
comparisons<br />
4- PR-14- rev. 00, PQP Performance evaluation Procedure<br />
5- PR-15- rev. 00, PQP Homogeneity and stability Procedure<br />
Page 13 of 57
<strong>Report</strong> <strong>No</strong>.: 1<br />
Appendix A- Results and data analysis<br />
Calcium<br />
Lab. Code Method Result (mgCa/L) Z-score<br />
1 Titration 157.50 0.62<br />
2 AAS 163.90 1.34<br />
3 Titration 156.80 0.54<br />
4 Other 156.40 0.49<br />
5 Titration 153.00 0.11<br />
6 Titration 160.00 0.90<br />
7 Titration 144.29 -0.87<br />
8 Titration 140.60 -1.28<br />
9 Titration 143.23 -0.99<br />
10 Ion Chromatography 149.94 -0.23<br />
11 Photometry 168.00 1.80<br />
12 Titration 156.00 0.45<br />
13 Titration 163.60 1.30<br />
14 Titration 156.00 0.45<br />
15 Photometry 146.00 -0.67<br />
16 Titration 151.75 -0.03<br />
17 Titration 150.60 -0.16<br />
18 Titration 155.20 0.36<br />
23 Titration 143.50 -0.96<br />
24 Titration 149.90 -0.24<br />
25 Photometry 112.80 -4.40<br />
26 Titration 150.00 -0.23<br />
27 Titration 146.80 -0.58<br />
28 Titration 110.00 -4.72<br />
29 Titration 185.60 3.77<br />
30 Titration 157.17 0.58<br />
31 Titration 145.00 -0.79<br />
Page 14 of 57
Frequency<br />
<strong>Report</strong> <strong>No</strong>.: 1<br />
Data Statistics<br />
Number of results 27<br />
Number of excluded 0<br />
results*<br />
Assigned value 152.01<br />
Uncertainty of assigned 2.14<br />
value<br />
SDPA** 8.90<br />
* The influence of outliers on summary statistics has been minimized by the use of robust<br />
statistical methods but obvious blunders, such as those with incorrect units, decimal point<br />
errors, and results for a different proficiency test item are removed from the data set and treated<br />
separately. These results are not the subject to outlier tests or robust statistical methods.<br />
** Method 1 in clause 6-3 (robust standard deviation) has been used for determination of SDPA.<br />
12<br />
Histogram of participants Z-scores for Ca<br />
10<br />
8<br />
6<br />
4<br />
Frequency<br />
2<br />
0<br />
-5 -4 -3 -2 -1 0 1 2 3 4 5 More<br />
Z-scores<br />
Page 15 of 57
Z-score<br />
<strong>Report</strong> <strong>No</strong>.: 1<br />
5.00<br />
4.00<br />
3.00<br />
2.00<br />
1.00<br />
0.00<br />
-1.00<br />
-2.00<br />
-3.00<br />
-4.00<br />
-5.00<br />
-6.00<br />
28 25 8 9 23 7 31 15 27 24 10 26 17 16 5 18 12 14 4 3 30 1 6 13 2 11 29<br />
Lab <strong>No</strong>.<br />
Methodology Summary<br />
Method<br />
Number of<br />
results<br />
% of total Median Sat. (%)<br />
Atomic Absorption Spectroscopy 1 3.7% 163.90 100%<br />
Ion chromatography 1 3.7% 149.94 100%<br />
Photometry 3 11.1% 146.00 67%<br />
Titration 21 77.8% 151.75 90%<br />
Other 1 3.7% 156.40 100%<br />
Page 16 of 57
<strong>Report</strong> <strong>No</strong>.: 1<br />
Magnesium<br />
Lab. Code Method Result (mgMg/L) Z-score<br />
1 Calculation 28.08 -0.36<br />
2 AAS 24.20 -1.19<br />
3 Calculation 33.60 0.83<br />
4 Calculation 28.00 -0.37<br />
5 Titration 29.00 -0.16<br />
6 Titration 26.00 -0.81<br />
7 Calculation 24.12 -1.21<br />
8 Calculation 36.36 1.43<br />
9 Calculation 39.56 2.12<br />
10 Ion Chromatography 26.78 -0.64<br />
11 Photometry 33.30 0.77<br />
12 Calculation 23.40 -1.37<br />
13 Photometry 29.20 -0.12<br />
14 Calculation 26.75 -0.64<br />
15 Photometry 30.00 0.06<br />
16 Titration 28.56 -0.25<br />
17 Calculation 27.06 -0.58<br />
18 Calculation 28.80 -0.20<br />
23 Calculation 33.90 0.90<br />
24 Titration 37.90 1.76<br />
25 Photometry 22.46 -1.57<br />
26 Other 28.80 -0.20<br />
27 Calculation 29.70 -0.01<br />
28 Calculation 41.96 2.64<br />
29 Titration 38.40 1.87<br />
30 Calculation 29.04 -0.15<br />
31 Calculation 33.40 0.79<br />
Page 17 of 57
Frequency<br />
<strong>Report</strong> <strong>No</strong>.: 1<br />
Data Statistics<br />
Number of results 27<br />
Number of excluded 0<br />
results*<br />
Assigned value 29.73<br />
Uncertainty of assigned 1.12<br />
value<br />
SDPA** 4.64<br />
* The influence of outliers on summary statistics has been minimized by the use of robust<br />
statistical methods but obvious blunders, such as those with incorrect units, decimal point<br />
errors, and results for a different proficiency test item are removed from the data set and treated<br />
separately. These results are not the subject to outlier tests or robust statistical methods.<br />
** Method 1 in clause 6-3 (robust standard deviation) has been used for determination of SDPA.<br />
14<br />
Histogram of participants Z-scores for Mg<br />
12<br />
10<br />
8<br />
6<br />
4<br />
2<br />
0<br />
-3 -2 -1 0 1 2 3 More<br />
Z-scores<br />
Page 18 of 57
Z-score<br />
<strong>Report</strong> <strong>No</strong>.: 1<br />
3.00<br />
2.00<br />
1.00<br />
0.00<br />
25 12 7 2 6 14 10 17 4 1 16 18 26 5 30 13 27 15 11 31 3 23 8 24 29 9 28<br />
-1.00<br />
-2.00<br />
-3.00<br />
Lab <strong>No</strong>.<br />
Methodology Summary<br />
Method<br />
Number of % of<br />
results total<br />
Median Sat. (%)<br />
Atomic Absorption Spectroscopy 1 3.7% 24.20 100%<br />
Calculation 15 55.6% 29.04 87%<br />
Ion Chromatography 1 3.7% 26.78 100%<br />
Photometry 4 14.8% 29.60 100%<br />
Titration 5 18.5% 29.00 100%<br />
Other 1 3.7% 28.8 100%<br />
Page 19 of 57
<strong>Report</strong> <strong>No</strong>.: 1<br />
Total hardness<br />
Lab. Code Method Result (mgCaCO3/L) Z-score<br />
1 Titration 508.00 0.49<br />
2 Titration 500.00 -0.04<br />
3 Titration 532.00 2.09<br />
4 Titration 507.70 0.47<br />
5 Titration 503.00 0.16<br />
6 Titration 506.00 0.36<br />
7 Titration 458.00 -2.84<br />
8 Titration 503.00 0.16<br />
9 Titration 520.00 1.29<br />
10 Titration 480.00 -1.38<br />
11 Photometry 558.60 3.86<br />
12 Titration 487.50 -0.88<br />
13 Titration 504.00 0.22<br />
14 Titration 500.00 -0.04<br />
15 Photometry 490.00 -0.71<br />
16 Titration 498.38 -0.15<br />
17 Titration 486.60 -0.94<br />
18 Titration 508.00 0.49<br />
23 Titration 497.00 -0.24<br />
24 Titration 530.00 1.96<br />
25 Photometry 374.00 -8.44<br />
26 Titration 495.00 -0.38<br />
27 Titration 491.00 -0.64<br />
28 Titration 450.00 -3.38<br />
29 Titration 624.00 8.23<br />
30 Titration 511.94 0.75<br />
31 Titration 500.00 -0.04<br />
Page 20 of 57
Frequency<br />
<strong>Report</strong> <strong>No</strong>.: 1<br />
Data Statistics<br />
Number of results 27<br />
Number of excluded 0<br />
results*<br />
Assigned value 500.63<br />
Uncertainty of assigned 3.61<br />
value<br />
SDPA** 15.00<br />
* The influence of outliers on summary statistics has been minimized by the use of robust<br />
statistical methods but obvious blunders, such as those with incorrect units, decimal point<br />
errors, and results for a different proficiency test item are removed from the data set and treated<br />
separately. These results are not the subject to outlier tests or robust statistical methods.<br />
** Method 1 in clause 6-3 (robust standard deviation) has been used for determination of SDPA.<br />
12<br />
10<br />
8<br />
6<br />
4<br />
2<br />
0<br />
Histogram of participants Z-scores for Total<br />
Hardness<br />
Z-scores<br />
Page 21 of 57
Z-score<br />
<strong>Report</strong> <strong>No</strong>.: 1<br />
10.00<br />
9.00<br />
8.00<br />
7.00<br />
6.00<br />
5.00<br />
4.00<br />
3.00<br />
2.00<br />
1.00<br />
0.00<br />
-1.00<br />
-2.00<br />
-3.00<br />
-4.00<br />
-5.00<br />
-6.00<br />
-7.00<br />
-8.00<br />
-9.00<br />
25 28 7 10 17 12 15 27 26 23 16 2 14 31 5 8 13 6 4 1 18 30 9 24 3 11 29<br />
Lab <strong>No</strong>.<br />
Methodology Summary<br />
Method<br />
Number of<br />
results<br />
% of total Median Sat. (%)<br />
Photometry 3 11.1% 490.00 33%<br />
Titration 24 88.9% 501.50 83%<br />
Page 22 of 57
<strong>Report</strong> <strong>No</strong>.: 1<br />
Alkalinity<br />
Lab. Code Method Result (mgCaCO3/L) Z-score<br />
1 Titration 339.00 0.49<br />
2 Titration 360.00 2.58<br />
3 Titration 334.00 -0.01<br />
4 Titration 336.90 0.28<br />
5 Titration 82.00 -25.10<br />
6 Titration 334.00 -0.01<br />
7 Titration 315.00 -1.90<br />
8 Titration 332.00 -0.21<br />
9 Titration 355.60 2.14<br />
10 Titration 216.00 -11.76<br />
11 Titration 310.00 -2.40<br />
12 Titration 335.00 0.09<br />
14 Titration 330.00 -0.41<br />
15 Photometry 320.00 -1.40<br />
16 Titration 339.50 0.54<br />
17 Titration 356.90 2.27<br />
18 Titration 340.00 0.59<br />
23 Titration 340.00 0.59<br />
24 Titration 346.00 1.18<br />
25 Photometry 330.00 -0.41<br />
26 Titration 304.00 -3.00<br />
27 Titration 338.19 0.41<br />
28 Titration 240.00 -9.37<br />
29 Titration 332.00 -0.21<br />
30 Titration 337.30 0.32<br />
31 Titration 380.00 4.57<br />
Page 23 of 57
Frequency<br />
<strong>Report</strong> <strong>No</strong>.: 1<br />
Data Statistics<br />
Number of results 26<br />
Number of excluded 0<br />
results*<br />
Assigned value 334.10<br />
Uncertainty of assigned 2.46<br />
value<br />
SDPA** 10.04<br />
* The influence of outliers on summary statistics has been minimized by the use of robust<br />
statistical methods but obvious blunders, such as those with incorrect units, decimal point<br />
errors, and results for a different proficiency test item are removed from the data set and treated<br />
separately. These results are not the subject to outlier tests or robust statistical methods.<br />
** Method 1 in clause 6-3 (robust standard deviation) has been used for determination of SDPA.<br />
9<br />
8<br />
7<br />
6<br />
5<br />
4<br />
3<br />
2<br />
1<br />
0<br />
Histogram of participants Z-scores for Alkalinity<br />
-26 -25 -12 -11 -10 -9 -3 -2 -1 0 1 2 3 4 5 More<br />
Z-scores<br />
Page 24 of 57
Z-score<br />
<strong>Report</strong> <strong>No</strong>.: 1<br />
6.00<br />
5.00<br />
4.00<br />
3.00<br />
2.00<br />
1.00<br />
0.00<br />
-1.00<br />
-2.00<br />
-3.00<br />
-4.00<br />
-5.00<br />
-6.00<br />
-7.00<br />
-8.00<br />
-9.00<br />
-10.00<br />
-11.00<br />
-12.00<br />
-13.00<br />
-14.00<br />
5 10 28 26 11 7 15 14 25 8 29 3 6 12 4 30 27 1 16 18 23 24 9 17 2 31<br />
Lab <strong>No</strong>.<br />
Methodology Summary<br />
Method<br />
Number of<br />
results<br />
% of total Median Sat. (%)<br />
Photometry 2 7.7% 325.00 100%<br />
Titration 24 92.3% 335.95 63%<br />
Page 25 of 57
<strong>Report</strong> <strong>No</strong>.: 1<br />
Sodium<br />
Lab. Code Method Result (mgNa/L) Z-score<br />
1 Ion Chromatography 125.00 1.43<br />
2 Ion Chromatography 119.20 0.57<br />
3 Flame Photometry 117.50 0.32<br />
4 other 117.00 0.25<br />
6 Ion Chromatography 119.00 0.54<br />
7 Flame Photometry 132.00 2.46<br />
8 AAS 113.60 -0.25<br />
9 Flame Photometry 81.40 -4.99<br />
10 Ion Chromatography 116.35 0.15<br />
11 AAS 106.70 -1.27<br />
12 Flame Photometry 124.00 1.28<br />
13 other 118.40 0.46<br />
14 Flame Photometry 112.50 -0.41<br />
15 Calculation 92.00 -3.43<br />
16 Flame Photometry 121.25 0.88<br />
17 Flame Photometry 119.73 0.65<br />
18 Flame Photometry 119.20 0.57<br />
24 Flame Photometry 118.00 0.40<br />
25 Flame Photometry 92.00 -3.43<br />
26 Flame Photometry 118.00 0.40<br />
27 Flame Photometry 115.00 -0.04<br />
28 other 90.00 -3.72<br />
29 Flame Photometry 110.40 -0.72<br />
30 Flame Photometry 90.66 -3.63<br />
31 Flame Photometry 100.00 -2.25<br />
Page 26 of 57
Frequency<br />
<strong>Report</strong> <strong>No</strong>.: 1<br />
Data Statistics<br />
Number of results 25<br />
Number of excluded 0<br />
results*<br />
Assigned value 115.30<br />
Uncertainty of assigned 1.70<br />
value<br />
SDPA** 6.80<br />
* The influence of outliers on summary statistics has been minimized by the use of robust<br />
statistical methods but obvious blunders, such as those with incorrect units, decimal point<br />
errors, and results for a different proficiency test item are removed from the data set and treated<br />
separately. These results are not the subject to outlier tests or robust statistical methods.<br />
** Method 1 in clause 6-3 (robust standard deviation) has been used for determination of SDPA.<br />
12<br />
Histogram of participants Z-scores for Sodium<br />
10<br />
8<br />
6<br />
4<br />
2<br />
0<br />
-5 -4 -3 -2 -1 0 1 2 3 4 More<br />
Z-scores<br />
Page 27 of 57
Z-score<br />
<strong>Report</strong> <strong>No</strong>.: 1<br />
3.00<br />
2.00<br />
1.00<br />
0.00<br />
-1.00<br />
9 28 30 15 25 31 11 29 14 8 27 10 4 3 24 26 13 6 2 18 17 16 12 1 7<br />
-2.00<br />
-3.00<br />
-4.00<br />
-5.00<br />
Lab <strong>No</strong>.<br />
Methodology Summary<br />
Method<br />
Number<br />
of results<br />
% of total Median Sat. (%)<br />
Atomic Absorption Spectroscopy 2 8.0% 110.15 100%<br />
Calculation 1 4.0% 92.00 0%<br />
Flame Photometry 15 60.0% 117.50 67%<br />
Ion Chromatography 4 16.0% 119.10 100%<br />
Other 3 12.0% 103.50 67%<br />
Page 28 of 57
<strong>Report</strong> <strong>No</strong>.: 1<br />
Potassium<br />
Lab. Code Method Result (mgK/L) Z-score<br />
1 Ion Chromatography 6.50 -0.19<br />
2 Ion Chromatography 7.64 1.29<br />
3 Flame Photometry 6.60 -0.06<br />
4 other 6.40 -0.33<br />
7 Flame Photometry 8.00 1.76<br />
8 AAS 16.80 13.25<br />
9 Flame Photometry 7.15 0.65<br />
10 Ion Chromatography 6.57 -0.10<br />
11 AAS 7.00 0.46<br />
12 Flame Photometry 7.25 0.78<br />
13 other 6.20 -0.59<br />
14 Flame Photometry 7.00 0.46<br />
15 Flame Photometry 7.50 1.11<br />
16 Flame Photometry 6.00 -0.85<br />
17 Flame Photometry 6.74 0.12<br />
18 Flame Photometry 6.52 -0.17<br />
24 Flame Photometry 5.50 -1.50<br />
25 Flame Photometry 6.80 0.20<br />
26 Flame Photometry 6.60 -0.06<br />
27 Flame Photometry 7.10 0.59<br />
28 other 5.00 -2.15<br />
29 Flame Photometry 6.10 -0.72<br />
30 Flame Photometry 5.99 -0.86<br />
31 Flame Photometry 5.00 -2.15<br />
Page 29 of 57
Frequency<br />
<strong>Report</strong> <strong>No</strong>.: 1<br />
Data Statistics<br />
Number of results 24<br />
Number of excluded 0<br />
results*<br />
Assigned value 6.65<br />
Uncertainty of assigned 0.21<br />
value<br />
SDPA** 0.77<br />
* The influence of outliers on summary statistics has been minimized by the use of robust<br />
statistical methods but obvious blunders, such as those with incorrect units, decimal point<br />
errors, and results for a different proficiency test item are removed from the data set and treated<br />
separately. These results are not the subject to outlier tests or robust statistical methods.<br />
** Method 1 in clause 6-3 (robust standard deviation) has been used for determination of SDPA.<br />
12<br />
Histogram of participants Z-scores for Potassium<br />
10<br />
8<br />
6<br />
4<br />
2<br />
0<br />
-3 -2 -1 0 1 2 3 13 14 More<br />
Z-scores<br />
Page 30 of 57
Z-score<br />
<strong>Report</strong> <strong>No</strong>.: 1<br />
9.00<br />
8.00<br />
7.00<br />
6.00<br />
5.00<br />
4.00<br />
3.00<br />
2.00<br />
1.00<br />
0.00<br />
-1.00<br />
-2.00<br />
-3.00<br />
28 31 24 30 16 29 13 4 1 18 10 3 26 17 25 11 14 27 9 12 15 2 7 8<br />
Lab <strong>No</strong>.<br />
Methodology Summary<br />
Method<br />
Number<br />
of results<br />
% of total Median Sat. (%)<br />
Atomic Absorption Spectroscopy 2 8.3% 11.90 50%<br />
Flame Photometry 16 66.7% 6.67 94%<br />
Ion Chromatography 3 12.5% 6.57 100%<br />
Other 3 12.5% 5.00 67%<br />
Page 31 of 57
<strong>Report</strong> <strong>No</strong>.: 1<br />
Chloride<br />
Lab. Code Method Result (mgCl/L) Z-score<br />
1 Ion Chromatography 93.00 -1.13<br />
2 Ion Chromatography 99.40 -0.24<br />
3 Other 103.00 0.26<br />
4 Other 126.00 3.45<br />
5 Titration 94.00 -0.99<br />
6 Titration 97.00 -0.58<br />
7 Ion Chromatography 99.46 -0.24<br />
8 Ion Chromatography 99.40 -0.24<br />
9 Titration 108.50 1.02<br />
10 Titration 116.20 2.09<br />
11 Colorimetry 84.70 -2.28<br />
12 Titration 99.40 -0.24<br />
13 Colorimetry 96.00 -0.72<br />
14 Ion Chromatography 95.27 -0.82<br />
15 Colorimetry 140.00 5.39<br />
16 Ion Chromatography 98.43 -0.38<br />
17 Titration 107.60 0.89<br />
18 Titration 97.00 -0.58<br />
23 Titration 106.40 0.73<br />
24 Titration 103.50 0.32<br />
25 Other 140.00 5.39<br />
26 Titration 106.00 0.67<br />
27 Colorimetry 102.46 0.18<br />
28 Titration 126.00 3.45<br />
29 Colorimetry 94.29 -0.95<br />
30 Ion Chromatography 94.52 -0.92<br />
31 Titration 95.00 -0.85<br />
Page 32 of 57
Frequency<br />
<strong>Report</strong> <strong>No</strong>.: 1<br />
Data Statistics<br />
Number of results 27<br />
Number of excluded results* 0<br />
Assigned value 101.16<br />
Uncertainty of assigned<br />
0.08<br />
value<br />
SDPA** 7.21<br />
* The influence of outliers on summary statistics has been minimized by the use of robust<br />
statistical methods but obvious blunders, such as those with incorrect units, decimal point<br />
errors, and results for a different proficiency test item are removed from the data set and treated<br />
separately. These results are not the subject to outlier tests or robust statistical methods.<br />
** Method 1 in clause 6-3 (robust standard deviation) has been used for determination of SDPA.<br />
14<br />
Histogram of participants Z-scores for Chloride<br />
12<br />
10<br />
8<br />
6<br />
4<br />
2<br />
0<br />
-3 -2 -1 0 1 2 3 4 5 6 More<br />
Z-scores<br />
Page 33 of 57
Z-score<br />
<strong>Report</strong> <strong>No</strong>.: 1<br />
9.00<br />
8.00<br />
7.00<br />
6.00<br />
5.00<br />
4.00<br />
3.00<br />
2.00<br />
1.00<br />
0.00<br />
-1.00<br />
-2.00<br />
-3.00<br />
11 1 5 29 30 31 14 13 6 18 16 2 8 12 7 27 3 24 26 23 17 9 10 4 28 15 25<br />
Lab <strong>No</strong>.<br />
Methodology Summary<br />
Method<br />
Number of<br />
results<br />
% of total Median Sat. (%)<br />
Colorimetry 5 18.5% 96.00 60%<br />
Ion Chromatography 7 25.9% 98.43 100%<br />
titration 12 44.4% 104.75 83%<br />
other 3 11.1% 126.00 33%<br />
Page 34 of 57
<strong>Report</strong> <strong>No</strong>.: 1<br />
Sulphate<br />
Lab. Code Method Result (mgSO4/L) Z-score<br />
1 Ion Chromatography 266.00 -0.13<br />
2 Ion Chromatography 277.52 0.46<br />
3 Other 293.00 1.26<br />
4 Other 290.00 1.10<br />
5 Turbidimetry 260.00 -0.44<br />
6 Turbidimetry 261.00 -0.38<br />
7 Ion Chromatography 265.16 -0.17<br />
8 Turbidimetry 347.00 4.03<br />
9 Turbidimetry 160.00 -5.57<br />
10 Turbidimetry 214.00 -2.80<br />
11 Turbidimetry 277.30 0.45<br />
12 Turbidimetry 266.40 -0.11<br />
13 Turbidimetry 268.60 0.01<br />
14 Ion Chromatography 262.00 -0.33<br />
15 Turbidimetry 190.00 -4.03<br />
16 Ion Chromatography 306.53 1.95<br />
17 Turbidimetry 456.20 9.64<br />
18 Turbidimetry 280.55 0.62<br />
23 Turbidimetry 265.00 -0.18<br />
24 Turbidimetry 270.00 0.08<br />
25 Other 193.00 -3.88<br />
26 Turbidimetry 258.00 -0.54<br />
27 Turbidimetry 300.00 1.62<br />
28 Other 243.00 -1.31<br />
29 Turbidimetry 320.00 2.64<br />
30 Ion Chromatography 276.79 0.43<br />
31 Turbidimetry 240.00 -1.46<br />
Page 35 of 57
Frequency<br />
<strong>Report</strong> <strong>No</strong>.: 1<br />
Data Statistics<br />
Number of results 27<br />
Number of excluded 0<br />
results*<br />
Assigned value 268.50<br />
Uncertainty of assigned 4.69<br />
value<br />
SDPA** 19.48<br />
* The influence of outliers on summary statistics has been minimized by the use of robust<br />
statistical methods but obvious blunders, such as those with incorrect units, decimal point<br />
errors, and results for a different proficiency test item are removed from the data set and treated<br />
separately. These results are not the subject to outlier tests or robust statistical methods.<br />
** Method 2 in clause 6-3 (inter quartile range) has been used for determination of SDPA.<br />
9<br />
8<br />
7<br />
6<br />
5<br />
4<br />
3<br />
2<br />
1<br />
0<br />
Histogram of participants Z-scores for Sulphate<br />
-6 -5 -4 -2 -1 0 1 2 3 3 4 5 6 7 8 9 10<br />
Z-scores<br />
Page 36 of 57
Z-score<br />
<strong>Report</strong> <strong>No</strong>.: 1<br />
7.00<br />
6.00<br />
5.00<br />
4.00<br />
3.00<br />
2.00<br />
1.00<br />
0.00<br />
-1.00<br />
-2.00<br />
-3.00<br />
-4.00<br />
-5.00<br />
9 15 25 10 31 28 26 5 6 14 23 7 1 12 13 24 30 11 2 18 4 3 27 16 29 8 17<br />
Lab <strong>No</strong>.<br />
Methodology Summary<br />
Method<br />
Number of<br />
results<br />
% of total Median Sat. (%)<br />
Ion Chromatography 6 22.2% 271.40 100%<br />
Turbidimetry 17 63.0% 266.40 65%<br />
other 4 14.8% 266.50 75%<br />
Page 37 of 57
<strong>Report</strong> <strong>No</strong>.: 1<br />
Fluoride<br />
Lab. Code Method Result (mgF/L)<br />
1 Ion Chromatography 0.270<br />
2 Ion Chromatography 0.237<br />
3 Other
<strong>Report</strong> <strong>No</strong>.: 1<br />
Data Statistics<br />
Number of results 25<br />
Number of excluded 1<br />
results*<br />
Assigned value 0.42<br />
Uncertainty of assigned ---<br />
value<br />
SDPA ---<br />
* The influence of outliers on summary statistics has been minimized by the use of robust<br />
statistical methods but obvious blunders, such as those with incorrect units, decimal point<br />
errors, and results for a different proficiency test item are removed from the data set and treated<br />
separately. These results are not the subject to outlier tests or robust statistical methods.<br />
Methodology Summary<br />
Method<br />
Number of<br />
results<br />
% of total Median Sat. (%)<br />
Ion Chromatography 6 25.0% 0.24 ---<br />
Spectrophotometry 14 58.3% 0.48 ---<br />
other 4 16.7% 0.38 ---<br />
Page 39 of 57
<strong>Report</strong> <strong>No</strong>.: 1<br />
Conductivity<br />
Lab. Code<br />
Method<br />
Result (µS/cm @<br />
25°C)<br />
Z-score<br />
1 Other 1634.127 3.58<br />
2 Conductivity Meter 1440.000 0.57<br />
3 Conductivity Meter 1390.000 -0.21<br />
4 Other 1351.000 -0.81<br />
5 Conductivity Meter 1219.000 -2.86<br />
6 Conductivity Meter 1400.000 -0.05<br />
7 Conductivity Meter 1360.000 -0.67<br />
8 Other 1408.000 0.07<br />
9 Conductivity Meter 1368.775 -0.54<br />
10 Conductivity Meter 1363.246 -0.62<br />
11 Conductivity Meter 1277.700 -1.95<br />
12 Conductivity Meter 1422.000 0.29<br />
13 Conductivity Meter 1413.000 0.15<br />
14 Conductivity Meter 1520.246 1.81<br />
15 Conductivity Meter 1550.099 2.28<br />
16 Conductivity Meter 1399.000 -0.07<br />
17 Conductivity Meter 1456.000 0.82<br />
18 Conductivity Meter 1352.000 -0.80<br />
23 Conductivity Meter 1413.000 0.15<br />
24 Conductivity Meter 1332.289 -1.10<br />
25 Conductivity Meter 1470.000 1.03<br />
26 Conductivity Meter 1392.000 -0.18<br />
27 Conductivity Meter 1554.521 2.35<br />
28 Conductivity Meter 1289.000 -1.77<br />
29 Conductivity Meter 1470.493 1.04<br />
30 Conductivity Meter 1399.000 -0.07<br />
31 Conductivity Meter 1400.000 -0.05<br />
Page 40 of 57
Frequency<br />
<strong>Report</strong> <strong>No</strong>.: 1<br />
Data Statistics<br />
Number of results 27<br />
Number of excluded 0<br />
results*<br />
Assigned value 1403.29<br />
Uncertainty of assigned 15.51<br />
value<br />
SDPA** 64.46<br />
* The influence of outliers on summary statistics has been minimized by the use of robust<br />
statistical methods but obvious blunders, such as those with incorrect units, decimal point<br />
errors, and results for a different proficiency test item are removed from the data set and treated<br />
separately. These results are not the subject to outlier tests or robust statistical methods.<br />
** Method 1 in clause 6-3 (robust standard deviation) has been used for determination of SDPA.<br />
12<br />
10<br />
8<br />
6<br />
4<br />
2<br />
0<br />
Histogram of participants Z-scores for<br />
Conductivity<br />
-3 -2 -1 0 1 2 3 4 More<br />
Z-scores<br />
Page 41 of 57
Z-score<br />
<strong>Report</strong> <strong>No</strong>.: 1<br />
4.00<br />
3.00<br />
2.00<br />
1.00<br />
0.00<br />
-1.00<br />
5 11 28 24 4 18 7 10 9 3 26 16 30 6 31 8 13 23 12 2 17 25 29 14 15 27 1<br />
-2.00<br />
-3.00<br />
-4.00<br />
Lab <strong>No</strong>.<br />
Methodology Summary<br />
Method<br />
Number of<br />
results<br />
% of total Median Sat. (%)<br />
Conductivity Meter 24 88.9% 1399.50 88%<br />
other 3 11.1% 1408.00 67%<br />
Page 42 of 57
<strong>Report</strong> <strong>No</strong>.: 1<br />
Total Dissolved Solids<br />
Lab. Code Method Result (mg/L) Z-score<br />
2 Drying @ 180°C 960.00 0.73<br />
3 Drying @ 180°C 995.00 1.05<br />
4 Calculation 864.60 -0.14<br />
5 Drying @ 180°C 1001.00 1.10<br />
6 Other 756.00 -1.13<br />
7 Other 750.00 -1.19<br />
8 Drying @ 180°C 986.00 0.96<br />
9 Drying @ 180°C 693.28 -1.70<br />
10 Other 605.00 -2.51<br />
11 Drying @ 180°C 873.60 -0.06<br />
12 Drying @ 180°C 930.00 0.45<br />
13 Other 989.00 0.99<br />
14 Drying @ 180°C 894.00 0.13<br />
15 Calculation 897.00 0.15<br />
16 Drying @ 180°C 920.00 0.36<br />
17 Calculation 928.30 0.44<br />
18 Drying @ 180°C 1027.00 1.34<br />
23 Other 904.00 0.22<br />
24 Other 722.00 -1.44<br />
25 Other 876.80 -0.03<br />
26 Drying @ 180°C 931.00 0.46<br />
27 Other 696.00 -1.68<br />
28 Other 812.00 -0.62<br />
29 Other 798.00 -0.75<br />
30 Drying @ 180°C 970.00 0.82<br />
31 Calculation 910.00 0.27<br />
Page 43 of 57
Frequency<br />
<strong>Report</strong> <strong>No</strong>.: 1<br />
Data Statistics<br />
Number of results 26<br />
Number of excluded 0<br />
results*<br />
Assigned value 880.22<br />
Uncertainty of assigned 26.91<br />
value<br />
SDPA** 109.78<br />
* The influence of outliers on summary statistics has been minimized by the use of robust<br />
statistical methods but obvious blunders, such as those with incorrect units, decimal point<br />
errors, and results for a different proficiency test item are removed from the data set and treated<br />
separately. These results are not the subject to outlier tests or robust statistical methods.<br />
** Method 1 in clause 6-3 (robust standard deviation) has been used for determination of SDPA.<br />
14<br />
Histogram of participants Z-scores for TDS<br />
12<br />
10<br />
8<br />
6<br />
4<br />
2<br />
0<br />
-3 -2 -1 0 1 2 3 More<br />
Z-scores<br />
Page 44 of 57
Z-score<br />
<strong>Report</strong> <strong>No</strong>.: 1<br />
4.00<br />
3.00<br />
2.00<br />
1.00<br />
0.00<br />
-1.00<br />
10 9 27 24 7 6 29 28 4 11 25 14 15 23 31 16 17 12 26 2 30 8 13 3 5 18<br />
-2.00<br />
-3.00<br />
-4.00<br />
Lab <strong>No</strong>.<br />
Methodology Summary<br />
Method<br />
Number of<br />
results<br />
% of total Median Sat. (%)<br />
Drying @ 180°C 12 46.2% 945.50 100%<br />
Calculation 4 15.4% 903.50 100%<br />
other 10 38.5% 777.00 90%<br />
Page 45 of 57
<strong>Report</strong> <strong>No</strong>.: 1<br />
Appendix B- Homogeneity and stability testing<br />
B-1- Homogeneity testing<br />
Samples for this program were obtained from a natural water source by East Azerbaijan water<br />
and wastewater laboratory. A random selection of 10 samples was chosen prior to sample<br />
dispatch. Each of the selected test samples have been divided into two test portions using<br />
techniques appropriate to the test material to minimize between-test-portion differences.<br />
The results of the homogeneity testing has been analysed by PQP, in order to determine<br />
whether the samples are sufficiently homogeneous.<br />
The selected samples were analysed by East Azerbaijan water and wastewater laboratory for<br />
homogeneity. The homogeneity of the samples has been checked by applying ANOVA- Single<br />
Factor technique to compare between-samples and within-samples variations. If there is no<br />
significance difference between these two sources of variations then it can be concluded that<br />
the samples are homogeneous.<br />
The results of the homogeneity testing are as follows:<br />
Page 46 of 57
<strong>Report</strong> <strong>No</strong>.: 1<br />
Total Hardness<br />
Sample<br />
Portion 1 Result Portion 2 Result<br />
(mgCaCO3/L) (mgCaCO3/L)<br />
A 487.5 485.0<br />
B 487.5 487.5<br />
C 490.0 487.5<br />
D 487.5 487.5<br />
E 490.0 490.0<br />
F 485 487.5<br />
G 487.5 485.0<br />
H 485.0 487.5<br />
I 487.5 485.0<br />
J 487.5 487.5<br />
The results of ANOVA- single factor analysis are as follows:<br />
Anova: Single Factor<br />
SUMMARY<br />
Groups Count Sum Average Variance<br />
A 2 972.5 486.25 3.125<br />
B 2 975 487.5 0<br />
C 2 977.5 488.75 3.125<br />
D 2 975 487.5 0<br />
E 2 980 490 0<br />
F 2 972.5 486.25 3.125<br />
G 2 972.5 486.25 3.125<br />
H 2 972.5 486.25 3.125<br />
I 2 972.5 486.25 3.125<br />
J 2 975 487.5 0<br />
ANOVA<br />
Source of<br />
Variation SS df MS F P-value F crit<br />
Between<br />
3.33333333 1.77777777 0.19144420<br />
Groups 30 9<br />
3<br />
8<br />
3<br />
Within Groups 18.75 10 1.875<br />
Total 48.75 19<br />
3.02038294<br />
7<br />
Considering the results of ANOVA analysis, it can be concluded that the samples are<br />
homogenous for this parameter.<br />
Page 47 of 57
<strong>Report</strong> <strong>No</strong>.: 1<br />
Alkalinity<br />
Sample<br />
Portion 1 Result Portion 2 Result<br />
(mgCaCO3/L) (mgCaCO3/L)<br />
A 335.0 335.0<br />
B 337.5 335.0<br />
C 335.0 335.0<br />
D 337.5 335.0<br />
E 335.0 335.0<br />
F 337.5 335.0<br />
G 337.5 335.0<br />
H 337.5 335.0<br />
I 335.0 335.0<br />
J 335.0 337.5<br />
The results of ANOVA- single factor analysis are as follows:<br />
Anova: Single<br />
Factor<br />
SUMMARY<br />
Groups Count Sum Average Variance<br />
A 2 670 335 0<br />
B 2 672.5 336.25 3.125<br />
C 2 670 335 0<br />
D 2 672.5 336.25 3.125<br />
E 2 670 335 0<br />
F 2 672.5 336.25 3.125<br />
G 2 672.5 336.25 3.125<br />
H 2 672.5 336.25 3.125<br />
I 2 670 335 0<br />
J 2 672.5 336.25 3.125<br />
ANOVA<br />
Source of<br />
Variation SS df MS F P-value F crit<br />
0.83333333 0.44444444 0.88107921<br />
Between Groups 7.5 9<br />
3<br />
4<br />
1<br />
Within Groups 18.75 10 1.875<br />
Total 26.25 19<br />
3.02038294<br />
7<br />
Considering the results of ANOVA analysis, it can be concluded that the samples are<br />
homogenous for this parameter.<br />
Page 48 of 57
<strong>Report</strong> <strong>No</strong>.: 1<br />
Potassium<br />
Sample<br />
Portion 1 Result Portion 2 Result<br />
(mgK/L)<br />
(mgK/L)<br />
A 7.20 7.20<br />
B 7.20 7.20<br />
C 7.20 7.250<br />
D 7.20 7.30<br />
E 7.20 7.20<br />
F 7.20 7.25<br />
G 7.20 7.20<br />
H 7.30 7.20<br />
I 7.20 7.25<br />
J 7.25 7.30<br />
The results of ANOVA- single factor analysis are as follows:<br />
Anova: Single<br />
Factor<br />
SUMMARY<br />
Groups Count Sum Average Variance<br />
A 2 14.4 7.2 0<br />
B 2 14.4 7.2 0<br />
C 2 14.45 7.225 0.00125<br />
D 2 14.5 7.25 0.005<br />
E 2 14.4 7.2 0<br />
F 2 14.45 7.225 0.00125<br />
G 2 14.4 7.2 0<br />
H 2 14.5 7.25 0.005<br />
I 2 14.45 7.225 0.00125<br />
J 2 14.55 7.275 0.00125<br />
ANOVA<br />
Source of<br />
Variation SS df MS F P-value F crit<br />
Between Groups 0.0125 9 0.001388889 0.925925926 0.541304 3.020382947<br />
Within Groups 0.015 10 0.0015<br />
Total 0.0275 19<br />
Considering the results of ANOVA analysis, it can be concluded that the samples are<br />
homogenous for this parameter.<br />
Page 49 of 57
<strong>Report</strong> <strong>No</strong>.: 1<br />
Sulphate<br />
Sample Portion 1 Result<br />
(mgSO4/L)<br />
Portion 2 Result<br />
(mgSO4/L)<br />
A 266.4 265.5<br />
B 257.4 258.2<br />
C 260.8 267.3<br />
D 257.0 263.1<br />
E 259.9 262.5<br />
F 267.8 266.5<br />
G 262.1 259.5<br />
H 266.4 257.5<br />
I 259.2 264.6<br />
J 266.1 266.5<br />
The results of ANOVA- single factor analysis are as follows:<br />
Anova: Single<br />
Factor<br />
SUMMARY<br />
Groups Count Sum Average Variance<br />
A 2 531.9 265.95 0.405<br />
B 2 515.6 257.8 0.32<br />
C 2 528.1 264.05 21.125<br />
D 2 520.1 260.05 18.605<br />
E 2 522.4 261.2 3.38<br />
F 2 534.3 267.15 0.845<br />
G 2 521.6 260.8 3.38<br />
H 2 523.9 261.95 39.605<br />
I 2 523.8 261.9 14.58<br />
J 2 532.6 266.3 0.08<br />
ANOVA<br />
Source of<br />
Variation SS df MS F P-value F crit<br />
Between 166.480<br />
18.4978333 1.80775307 0.18475495<br />
Groups<br />
5 9<br />
3<br />
4<br />
8<br />
Within Groups 102.325 10 10.2325<br />
Total<br />
268.805<br />
5 19<br />
3.02038294<br />
7<br />
Considering the results of ANOVA analysis, it can be concluded that the samples are<br />
homogenous for this parameter.<br />
Page 50 of 57
<strong>Report</strong> <strong>No</strong>.: 1<br />
Fluoride<br />
Sample<br />
Portion 1 Result Portion 2 Result<br />
(mgF/L)<br />
(mgF/L)<br />
A 0.457 0.451<br />
B 0.456 0.455<br />
C 0.458 0.453<br />
D 0.455 0.451<br />
E 0.457 0.454<br />
F 0.456 0.453<br />
G 0.457 0.452<br />
H 0.456 0.455<br />
I 0.457 0.453<br />
J 0.454 0.457<br />
The results of ANOVA- single factor analysis are as follows:<br />
Anova: Single Factor<br />
SUMMARY<br />
Groups Count Sum Average Variance<br />
A 2 0.908 0.454 0.0<strong>0001</strong>8<br />
B 2 0.911 0.4555 5E-07<br />
C 2 0.911 0.4555 0.0<strong>0001</strong>25<br />
D 2 0.906 0.453 8E-06<br />
E 2 0.911 0.4555 4.5E-06<br />
F 2 0.909 0.4545 4.5E-06<br />
G 2 0.909 0.4545 0.0<strong>0001</strong>25<br />
H 2 0.911 0.4555 5E-07<br />
I 2 0.91 0.455 8E-06<br />
J 2 0.911 0.4555 4.5E-06<br />
ANOVA<br />
Source of<br />
Variation SS df MS F P-value F crit<br />
Between 0.0<strong>0001</strong>30<br />
0.19727891 0.98869786<br />
Groups<br />
5 9 1.45E-06<br />
2<br />
2<br />
Within Groups 7.35E-05 10 7.35E-06<br />
Total 8.655E-05 19<br />
3.02038294<br />
7<br />
Considering the results of ANOVA analysis, it can be concluded that the samples are<br />
homogenous for this parameter.<br />
Page 51 of 57
<strong>Report</strong> <strong>No</strong>.: 1<br />
Chloride<br />
Sample<br />
Portion 1 Result Portion 2 Result<br />
(mgCl/L)<br />
(mgCl/L)<br />
A 99.4 97.6<br />
B 99.4 97.6<br />
C 97.6 97.6<br />
D 99.4 97.6<br />
E 99.4 99.4<br />
F 97.6 99.4<br />
G 97.6 97.6<br />
H 99.4 99.4<br />
I 99.4 97.6<br />
J 99.4 99.4<br />
The results of ANOVA- single factor analysis are as follows:<br />
Anova: Single<br />
Factor<br />
SUMMARY<br />
Groups Count Sum Average Variance<br />
A 2 197 98.5 1.62<br />
B 2 197 98.5 1.62<br />
C 2 195.2 97.6 0<br />
D 2 197 98.5 1.62<br />
E 2 198.8 99.4 0<br />
F 2 197 98.5 1.62<br />
G 2 195.2 97.6 0<br />
H 2 198.8 99.4 0<br />
I 2 197 98.5 1.62<br />
J 2 198.8 99.4 0<br />
ANOVA<br />
Source of<br />
Variation SS df MS F P-value F crit<br />
Between Groups 7.938 9 0.882 1.088888889 0.444612742 3.020382947<br />
Within Groups 8.1 10 0.81<br />
Total 16.038 19<br />
Considering the results of ANOVA analysis, it can be concluded that the samples are<br />
homogenous for this parameter.<br />
Page 52 of 57
<strong>Report</strong> <strong>No</strong>.: 1<br />
Conductivity<br />
Sample Portion 1 Result<br />
(µS/cm@25°C)<br />
Portion 2 Result<br />
(µS/cm@25°C)<br />
A 1421 1421<br />
B 1421 1423<br />
C 1423 1421<br />
D 1423 1420<br />
E 1422 1418<br />
F 1421 1422<br />
G 1419 1421<br />
H 1422 1423<br />
I 1418 1420<br />
J 1419 1420<br />
The results of ANOVA- single factor analysis are as follows:<br />
Anova: Single<br />
Factor<br />
SUMMARY<br />
Groups Count Sum Average Variance<br />
A 2 2842 1421 0<br />
B 2 2844 1422 2<br />
C 2 2844 1422 2<br />
D 2 2843 1421.5 4.5<br />
E 2 2840 1420 8<br />
F 2 2843 1421.5 0.5<br />
G 2 2840 1420 2<br />
H 2 2845 1422.5 0.5<br />
I 2 2838 1419 2<br />
J 2 2839 1419.5 0.5<br />
ANOVA<br />
Source of<br />
Variation SS df MS F P-value F crit<br />
Between<br />
2.86666666 1.30303030 0.34138613<br />
Groups 25.8 9<br />
7<br />
3<br />
9<br />
Within Groups 22 10 2.2<br />
Total 47.8 19<br />
3.02038294<br />
7<br />
Considering the results of ANOVA analysis, it can be concluded that the samples are<br />
homogenous for this parameter.<br />
Page 53 of 57
<strong>Report</strong> <strong>No</strong>.: 1<br />
B-2- Stability testing<br />
Samples for this program were obtained from a natural water source by East Azerbaijan water<br />
and wastewater laboratory. A random selection of 3 samples was chosen 30 days after the<br />
sample dispatch. Each of the selected test samples have been divided into two test portions<br />
using techniques appropriate to the test material to minimize between-test-portion differences.<br />
The results of the stability testing has been analysed by PQP, in order to determine whether the<br />
samples are sufficiently stable. The selected samples were analysed by East Azerbaijan water<br />
and wastewater laboratory for stability. The general average of the measurements obtained in<br />
the homogeneity check is compared with the general average of the results obtained in the<br />
stability check. The samples are considered to be adequately stable if:<br />
The results of the stability testing are as follows:<br />
Parameter<br />
Total<br />
hardness<br />
(mgCaCO3/L)<br />
Alkalinity<br />
(mgCaCO3/L)<br />
Potassium<br />
(mgK/L)<br />
Chloride<br />
(mgCl/L)<br />
Sulphate<br />
(mgSO4/L)<br />
Sample<br />
SDPA<br />
A’ B’ C’<br />
?<br />
485.0 487.5 487.5 487.5 487.5 485.0 15 Yes<br />
335.0 335.0 337.5 335.0 337.5 335.0 10.04 Yes<br />
7.25 7.20 7.20 7.25 7.25 7.25 0.77 Yes<br />
99.4 99.4 99.4 97.6 99.4 97.6 7.21 Yes<br />
262.1 263.1 265.2 263.3 261.5 259.9 24.40 Yes<br />
Fluoride<br />
(mgF/L)<br />
Conductivity<br />
(µS/cm@25°C<br />
)<br />
0.451 0.456 0.457 0.455 0.452 0.454 0.23 Yes<br />
1420 1421 1422 1421 1423 1422 0.6 64.46 Yes<br />
Considering the results of stability analysis, it can be concluded that the samples are stable for the program’s<br />
parameters.<br />
Page 54 of 57
<strong>Report</strong> <strong>No</strong>.: 1<br />
Appendix C- Documents<br />
C-1- Instructions to participants<br />
Sample <strong>WAT</strong>-<strong>CH</strong>-<strong>0001</strong> Preparation Instruction<br />
Materials Supplied:<br />
- 2 x 1L samples in PE bottles labeled as Sample<br />
1 & 2 (<strong>WAT</strong>-<strong>CH</strong>-<strong>0001</strong>)<br />
<strong>WAT</strong>-<strong>CH</strong>-<strong>0001</strong><br />
Sample 1 & 2 (<strong>WAT</strong>-<strong>CH</strong>-<strong>0001</strong>)<br />
-<br />
Preparation:<br />
Parameter<br />
Bottle for<br />
Analysis<br />
Instruction<br />
Calcium<br />
Magnesium<br />
Total<br />
Hardness<br />
Alkalinity<br />
Sodium<br />
Potassium<br />
Chloride<br />
Sulphate<br />
Fluoride<br />
Conductivity<br />
Total<br />
Dissolved<br />
Solids (TDS)<br />
Remarks:<br />
Sample 1 & 2<br />
(<strong>WAT</strong>-<strong>CH</strong>-<strong>0001</strong>)<br />
Sample 1 & 2<br />
(<strong>WAT</strong>-<strong>CH</strong>-<strong>0001</strong>)<br />
Sample 1 & 2<br />
(<strong>WAT</strong>-<strong>CH</strong>-<strong>0001</strong>)<br />
Sample 1 & 2<br />
(<strong>WAT</strong>-<strong>CH</strong>-<strong>0001</strong>)<br />
Sample 1 & 2<br />
(<strong>WAT</strong>-<strong>CH</strong>-<strong>0001</strong>)<br />
Sample 1 & 2<br />
(<strong>WAT</strong>-<strong>CH</strong>-<strong>0001</strong>)<br />
Sample 1 & 2<br />
(<strong>WAT</strong>-<strong>CH</strong>-<strong>0001</strong>)<br />
Sample 1 & 2<br />
(<strong>WAT</strong>-<strong>CH</strong>-<strong>0001</strong>)<br />
Sample 1 & 2<br />
(<strong>WAT</strong>-<strong>CH</strong>-<strong>0001</strong>)<br />
Sample 1 & 2<br />
(<strong>WAT</strong>-<strong>CH</strong>-<strong>0001</strong>)<br />
Sample 1 & 2<br />
(<strong>WAT</strong>-<strong>CH</strong>-<strong>0001</strong>)<br />
Analyze as<br />
supplied<br />
Analyze as<br />
supplied<br />
Analyze as<br />
supplied<br />
Analyze as<br />
supplied<br />
Analyze as<br />
supplied<br />
Analyze as<br />
supplied<br />
Analyze as<br />
supplied<br />
Analyze as<br />
supplied<br />
Analyze as<br />
supplied<br />
Analyze as<br />
supplied<br />
Analyze as<br />
supplied<br />
Sample 1 & 2<br />
(<strong>WAT</strong>-<strong>CH</strong>-<br />
<strong>0001</strong>)<br />
Sample 1 & 2<br />
(<strong>WAT</strong>-<strong>CH</strong>-<br />
<strong>0001</strong>)<br />
Sample 1 & 2<br />
(<strong>WAT</strong>-<strong>CH</strong>-<br />
<strong>0001</strong>)<br />
Sample 1 & 2<br />
(<strong>WAT</strong>-<strong>CH</strong>-<br />
<strong>0001</strong>)<br />
Sample 1 & 2<br />
(<strong>WAT</strong>-<strong>CH</strong>-<br />
<strong>0001</strong>)<br />
Sample 1 & 2<br />
(<strong>WAT</strong>-<strong>CH</strong>-<br />
<strong>0001</strong>)<br />
Sample 1 & 2<br />
(<strong>WAT</strong>-<strong>CH</strong>-<br />
<strong>0001</strong>)<br />
Sample 1 & 2<br />
(<strong>WAT</strong>-<strong>CH</strong>-<br />
<strong>0001</strong>)<br />
Sample 1 & 2<br />
(<strong>WAT</strong>-<strong>CH</strong>-<br />
<strong>0001</strong>)<br />
Sample 1 & 2<br />
(<strong>WAT</strong>-<strong>CH</strong>-<br />
<strong>0001</strong>)<br />
Sample 1 & 2<br />
(<strong>WAT</strong>-<strong>CH</strong>-<br />
<strong>0001</strong>)<br />
Calcium<br />
Magnesium<br />
Total<br />
Hardness<br />
Alkalinity<br />
Sodium<br />
Potassium<br />
Chloride<br />
Sulphate<br />
Fluoride<br />
Conductivity<br />
Total<br />
Dissolved<br />
Solids (TDS)<br />
Page 55 of 57
<strong>Report</strong> <strong>No</strong>.: 1<br />
Sample <strong>WAT</strong>-<strong>CH</strong>-<strong>0001</strong> Preparation Instruction<br />
1- For all the above mentioned parameters the<br />
results should be reported in the results sheet<br />
form and the test method should be specified.<br />
2- The laboratory should calculate and report the<br />
expanded measurement uncertainty with 95%<br />
confidence interval (coverage factor k=2). It<br />
should be noted that the reported value of<br />
uncertainty won’t be used for performance<br />
evaluation of your laboratory.<br />
<strong>WAT</strong>-<strong>CH</strong>-<strong>0001</strong><br />
k=2<br />
Page 56 of 57
<strong>Report</strong> <strong>No</strong>.: 1<br />
C-2- Results Sheet<br />
Physicochemical parameters in underground water proficiency testing program- Round 1<br />
<strong>WAT</strong>-<strong>CH</strong>-<strong>0001</strong><br />
(<strong>Program</strong> <strong>No</strong>.)<br />
(Laboratory Code)<br />
Parameter Result Unit<br />
(±MU)<br />
Method<br />
Calcium<br />
mgCa/L<br />
Magnesium<br />
mgMg/L<br />
Total Hardness<br />
mgCaCO3/L<br />
Alkalinity<br />
mgCaCO3/L<br />
Sodium<br />
mgNa/L<br />
Potassium<br />
mgK/L<br />
Chloride<br />
mgCl/L<br />
Sulphate<br />
mgSO4/L<br />
Fluoride<br />
Conductivity<br />
Total Dissolved<br />
Solids (TDS)<br />
mgF/L<br />
µS/cm (20°C) <br />
µS/cm (25°C) <br />
mg/L<br />
:(Signature)<br />
تاريخ :(Date)<br />
امضا<br />
Page 57 of 57