Final Report Report No.: 1 Program No.: WAT-CH-0001 Program ...
Final Report Report No.: 1 Program No.: WAT-CH-0001 Program ...
Final Report Report No.: 1 Program No.: WAT-CH-0001 Program ...

Create successful ePaper yourself
Turn your PDF publications into a flip-book with our unique Google optimized e-Paper software.
<strong>Report</strong> <strong>No</strong>.: 1<br />
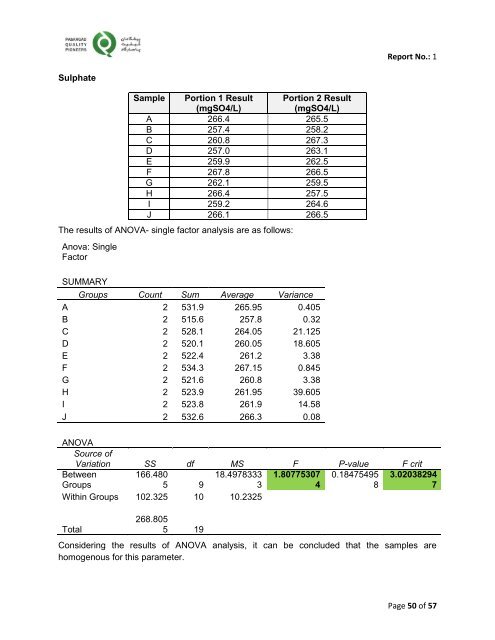
Sulphate<br />
Sample Portion 1 Result<br />
(mgSO4/L)<br />
Portion 2 Result<br />
(mgSO4/L)<br />
A 266.4 265.5<br />
B 257.4 258.2<br />
C 260.8 267.3<br />
D 257.0 263.1<br />
E 259.9 262.5<br />
F 267.8 266.5<br />
G 262.1 259.5<br />
H 266.4 257.5<br />
I 259.2 264.6<br />
J 266.1 266.5<br />
The results of ANOVA- single factor analysis are as follows:<br />
Anova: Single<br />
Factor<br />
SUMMARY<br />
Groups Count Sum Average Variance<br />
A 2 531.9 265.95 0.405<br />
B 2 515.6 257.8 0.32<br />
C 2 528.1 264.05 21.125<br />
D 2 520.1 260.05 18.605<br />
E 2 522.4 261.2 3.38<br />
F 2 534.3 267.15 0.845<br />
G 2 521.6 260.8 3.38<br />
H 2 523.9 261.95 39.605<br />
I 2 523.8 261.9 14.58<br />
J 2 532.6 266.3 0.08<br />
ANOVA<br />
Source of<br />
Variation SS df MS F P-value F crit<br />
Between 166.480<br />
18.4978333 1.80775307 0.18475495<br />
Groups<br />
5 9<br />
3<br />
4<br />
8<br />
Within Groups 102.325 10 10.2325<br />
Total<br />
268.805<br />
5 19<br />
3.02038294<br />
7<br />
Considering the results of ANOVA analysis, it can be concluded that the samples are<br />
homogenous for this parameter.<br />
Page 50 of 57