Final Report Report No.: 1 Program No.: WAT-CH-0001 Program ...
Final Report Report No.: 1 Program No.: WAT-CH-0001 Program ...
Final Report Report No.: 1 Program No.: WAT-CH-0001 Program ...

Create successful ePaper yourself
Turn your PDF publications into a flip-book with our unique Google optimized e-Paper software.
<strong>Report</strong> <strong>No</strong>.: 1<br />
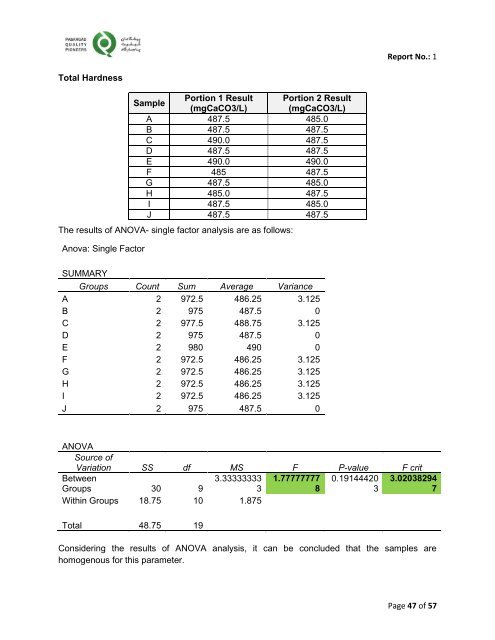
Total Hardness<br />
Sample<br />
Portion 1 Result Portion 2 Result<br />
(mgCaCO3/L) (mgCaCO3/L)<br />
A 487.5 485.0<br />
B 487.5 487.5<br />
C 490.0 487.5<br />
D 487.5 487.5<br />
E 490.0 490.0<br />
F 485 487.5<br />
G 487.5 485.0<br />
H 485.0 487.5<br />
I 487.5 485.0<br />
J 487.5 487.5<br />
The results of ANOVA- single factor analysis are as follows:<br />
Anova: Single Factor<br />
SUMMARY<br />
Groups Count Sum Average Variance<br />
A 2 972.5 486.25 3.125<br />
B 2 975 487.5 0<br />
C 2 977.5 488.75 3.125<br />
D 2 975 487.5 0<br />
E 2 980 490 0<br />
F 2 972.5 486.25 3.125<br />
G 2 972.5 486.25 3.125<br />
H 2 972.5 486.25 3.125<br />
I 2 972.5 486.25 3.125<br />
J 2 975 487.5 0<br />
ANOVA<br />
Source of<br />
Variation SS df MS F P-value F crit<br />
Between<br />
3.33333333 1.77777777 0.19144420<br />
Groups 30 9<br />
3<br />
8<br />
3<br />
Within Groups 18.75 10 1.875<br />
Total 48.75 19<br />
3.02038294<br />
7<br />
Considering the results of ANOVA analysis, it can be concluded that the samples are<br />
homogenous for this parameter.<br />
Page 47 of 57