Final Report Report No.: 1 Program No.: WAT-CH-0001 Program ...
Final Report Report No.: 1 Program No.: WAT-CH-0001 Program ...
Final Report Report No.: 1 Program No.: WAT-CH-0001 Program ...

You also want an ePaper? Increase the reach of your titles
YUMPU automatically turns print PDFs into web optimized ePapers that Google loves.
<strong>Report</strong> <strong>No</strong>.: 1<br />
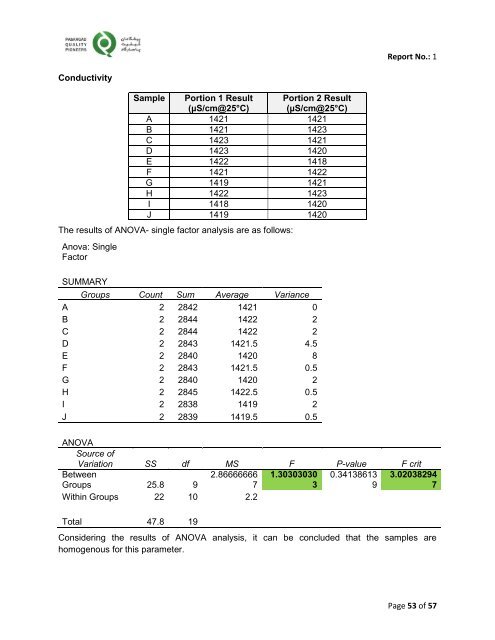
Conductivity<br />
Sample Portion 1 Result<br />
(µS/cm@25°C)<br />
Portion 2 Result<br />
(µS/cm@25°C)<br />
A 1421 1421<br />
B 1421 1423<br />
C 1423 1421<br />
D 1423 1420<br />
E 1422 1418<br />
F 1421 1422<br />
G 1419 1421<br />
H 1422 1423<br />
I 1418 1420<br />
J 1419 1420<br />
The results of ANOVA- single factor analysis are as follows:<br />
Anova: Single<br />
Factor<br />
SUMMARY<br />
Groups Count Sum Average Variance<br />
A 2 2842 1421 0<br />
B 2 2844 1422 2<br />
C 2 2844 1422 2<br />
D 2 2843 1421.5 4.5<br />
E 2 2840 1420 8<br />
F 2 2843 1421.5 0.5<br />
G 2 2840 1420 2<br />
H 2 2845 1422.5 0.5<br />
I 2 2838 1419 2<br />
J 2 2839 1419.5 0.5<br />
ANOVA<br />
Source of<br />
Variation SS df MS F P-value F crit<br />
Between<br />
2.86666666 1.30303030 0.34138613<br />
Groups 25.8 9<br />
7<br />
3<br />
9<br />
Within Groups 22 10 2.2<br />
Total 47.8 19<br />
3.02038294<br />
7<br />
Considering the results of ANOVA analysis, it can be concluded that the samples are<br />
homogenous for this parameter.<br />
Page 53 of 57