Final Report Report No.: 1 Program No.: WAT-CH-0001 Program ...
Final Report Report No.: 1 Program No.: WAT-CH-0001 Program ...
Final Report Report No.: 1 Program No.: WAT-CH-0001 Program ...

Create successful ePaper yourself
Turn your PDF publications into a flip-book with our unique Google optimized e-Paper software.
<strong>Report</strong> <strong>No</strong>.: 1<br />
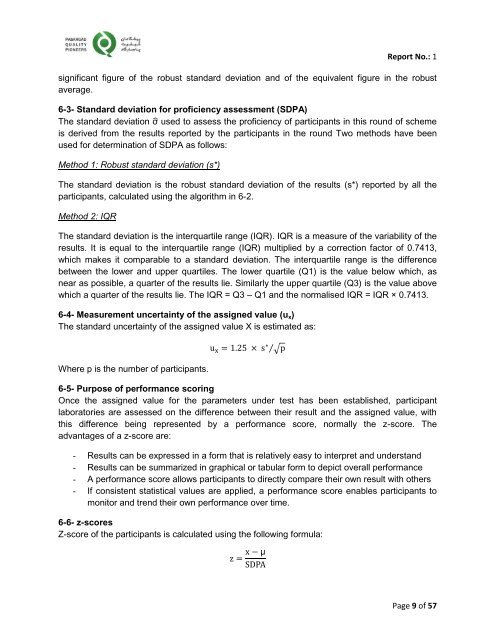
significant figure of the robust standard deviation and of the equivalent figure in the robust<br />
average.<br />
6-3- Standard deviation for proficiency assessment (SDPA)<br />
The standard deviation used to assess the proficiency of participants in this round of scheme<br />
is derived from the results reported by the participants in the round Two methods have been<br />
used for determination of SDPA as follows:<br />
Method 1: Robust standard deviation (s*)<br />
The standard deviation is the robust standard deviation of the results (s*) reported by all the<br />
participants, calculated using the algorithm in 6-2.<br />
Method 2: IQR<br />
The standard deviation is the interquartile range (IQR). IQR is a measure of the variability of the<br />
results. It is equal to the interquartile range (IQR) multiplied by a correction factor of 0.7413,<br />
which makes it comparable to a standard deviation. The interquartile range is the difference<br />
between the lower and upper quartiles. The lower quartile (Q1) is the value below which, as<br />
near as possible, a quarter of the results lie. Similarly the upper quartile (Q3) is the value above<br />
which a quarter of the results lie. The IQR = Q3 – Q1 and the normalised IQR = IQR × 0.7413.<br />
6-4- Measurement uncertainty of the assigned value (u x )<br />
The standard uncertainty of the assigned value X is estimated as:<br />
Where p is the number of participants.<br />
6-5- Purpose of performance scoring<br />
Once the assigned value for the parameters under test has been established, participant<br />
laboratories are assessed on the difference between their result and the assigned value, with<br />
this difference being represented by a performance score, normally the z-score. The<br />
advantages of a z-score are:<br />
- Results can be expressed in a form that is relatively easy to interpret and understand<br />
- Results can be summarized in graphical or tabular form to depict overall performance<br />
- A performance score allows participants to directly compare their own result with others<br />
- If consistent statistical values are applied, a performance score enables participants to<br />
monitor and trend their own performance over time.<br />
6-6- z-scores<br />
Z-score of the participants is calculated using the following formula:<br />
Page 9 of 57