NEPAL VEHICLE OPERATING COSTS - About Department of Road
NEPAL VEHICLE OPERATING COSTS - About Department of Road
NEPAL VEHICLE OPERATING COSTS - About Department of Road

Create successful ePaper yourself
Turn your PDF publications into a flip-book with our unique Google optimized e-Paper software.
Working Paper – Vehicle Operating Costs Page 4<br />
a constant factor. This will have the effect <strong>of</strong> reduce total fuel consumption for more<br />
extreme conditions.<br />
New VOC input prices and utilisation rates should be applied to the truck VOC<br />
relationships.<br />
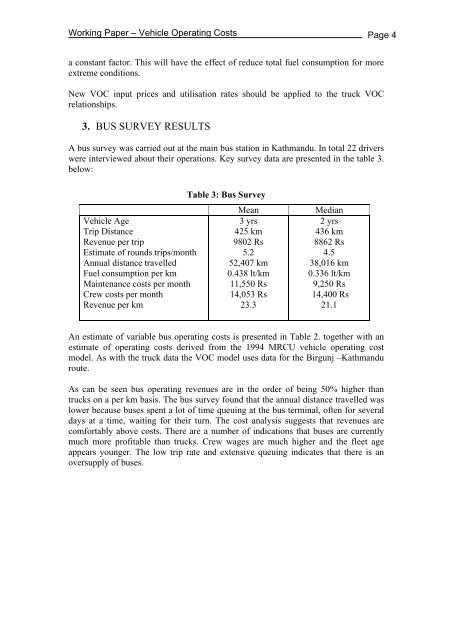
3. BUS SURVEY RESULTS<br />
A bus survey was carried out at the main bus station in Kathmandu. In total 22 drivers<br />
were interviewed about their operations. Key survey data are presented in the table 3.<br />
below:<br />
Vehicle Age<br />
Trip Distance<br />
Revenue per trip<br />
Estimate <strong>of</strong> rounds trips/month<br />
Annual distance travelled<br />
Fuel consumption per km<br />
Maintenance costs per month<br />
Crew costs per month<br />
Revenue per km<br />
Table 3: Bus Survey<br />
Mean<br />
3 yrs<br />
425 km<br />
9802 Rs<br />
5.2<br />
52,407 km<br />
0.438 lt/km<br />
11,550 Rs<br />
14,053 Rs<br />
23.3<br />
Median<br />
2 yrs<br />
436 km<br />
8862 Rs<br />
4.5<br />
38,016 km<br />
0.336 lt/km<br />
9,250 Rs<br />
14,400 Rs<br />
21.1<br />
An estimate <strong>of</strong> variable bus operating costs is presented in Table 2. together with an<br />
estimate <strong>of</strong> operating costs derived from the 1994 MRCU vehicle operating cost<br />
model. As with the truck data the VOC model uses data for the Birgunj –Kathmandu<br />
route.<br />
As can be seen bus operating revenues are in the order <strong>of</strong> being 50% higher than<br />
trucks on a per km basis. The bus survey found that the annual distance travelled was<br />
lower because buses spent a lot <strong>of</strong> time queuing at the bus terminal, <strong>of</strong>ten for several<br />
days at a time, waiting for their turn. The cost analysis suggests that revenues are<br />
comfortably above costs. There are a number <strong>of</strong> indications that buses are currently<br />
much more pr<strong>of</strong>itable than trucks. Crew wages are much higher and the fleet age<br />
appears younger. The low trip rate and extensive queuing indicates that there is an<br />
oversupply <strong>of</strong> buses.
![j:6 ]zg cfof ]hgf](https://img.yumpu.com/51286794/1/190x245/j6-zg-cfof-hgf.jpg?quality=85)
![x'nfsL /fhdfu { cfof ]hgf](https://img.yumpu.com/50581959/1/190x245/xnfsl-fhdfu-cfof-hgf.jpg?quality=85)