Origin of Adverse Drug Events in U.S. Hospitals, 2011 - HCUP
Origin of Adverse Drug Events in U.S. Hospitals, 2011 - HCUP
Origin of Adverse Drug Events in U.S. Hospitals, 2011 - HCUP

You also want an ePaper? Increase the reach of your titles
YUMPU automatically turns print PDFs into web optimized ePapers that Google loves.
HEALTHCARE COST AND<br />
UTILIZATION PROJECT<br />
STATISTICAL BRIEF #158<br />
Agency for Healthcare<br />
Research and Quality<br />
July 2013<br />
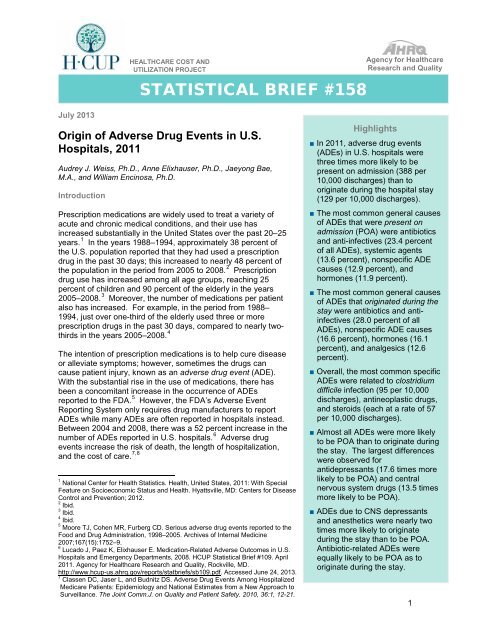
<strong>Orig<strong>in</strong></strong> <strong>of</strong> <strong>Adverse</strong> <strong>Drug</strong> <strong>Events</strong> <strong>in</strong> U.S.<br />
<strong>Hospitals</strong>, <strong>2011</strong><br />
Audrey J. Weiss, Ph.D., Anne Elixhauser, Ph.D., Jaeyong Bae,<br />
M.A., and William Enc<strong>in</strong>osa, Ph.D.<br />
Introduction<br />
Prescription medications are widely used to treat a variety <strong>of</strong><br />
acute and chronic medical conditions, and their use has<br />
<strong>in</strong>creased substantially <strong>in</strong> the United States over the past 20–25<br />
years. 1 In the years 1988–1994, approximately 38 percent <strong>of</strong><br />
the U.S. population reported that they had used a prescription<br />
drug <strong>in</strong> the past 30 days; this <strong>in</strong>creased to nearly 48 percent <strong>of</strong><br />
the population <strong>in</strong> the period from 2005 to 2008. 2 Prescription<br />
drug use has <strong>in</strong>creased among all age groups, reach<strong>in</strong>g 25<br />
percent <strong>of</strong> children and 90 percent <strong>of</strong> the elderly <strong>in</strong> the years<br />
2005–2008. 3 Moreover, the number <strong>of</strong> medications per patient<br />
also has <strong>in</strong>creased. For example, <strong>in</strong> the period from 1988–<br />
1994, just over one-third <strong>of</strong> the elderly used three or more<br />
prescription drugs <strong>in</strong> the past 30 days, compared to nearly twothirds<br />
<strong>in</strong> the years 2005–2008. 4<br />
The <strong>in</strong>tention <strong>of</strong> prescription medications is to help cure disease<br />
or alleviate symptoms; however, sometimes the drugs can<br />
cause patient <strong>in</strong>jury, known as an adverse drug event (ADE).<br />
With the substantial rise <strong>in</strong> the use <strong>of</strong> medications, there has<br />
been a concomitant <strong>in</strong>crease <strong>in</strong> the occurrence <strong>of</strong> ADEs<br />
reported to the FDA. 5 However, the FDA’s <strong>Adverse</strong> Event<br />
Report<strong>in</strong>g System only requires drug manufacturers to report<br />
ADEs while many ADEs are <strong>of</strong>ten reported <strong>in</strong> hospitals <strong>in</strong>stead.<br />
Between 2004 and 2008, there was a 52 percent <strong>in</strong>crease <strong>in</strong> the<br />
number <strong>of</strong> ADEs reported <strong>in</strong> U.S. hospitals. 6 <strong>Adverse</strong> drug<br />
events <strong>in</strong>crease the risk <strong>of</strong> death, the length <strong>of</strong> hospitalization,<br />
and the cost <strong>of</strong> care. 7,8<br />
1 National Center for Health Statistics. Health, United States, <strong>2011</strong>: With Special<br />
Feature on Socioeconomic Status and Health. Hyattsville, MD: Centers for Disease<br />
Control and Prevention; 2012.<br />
2 Ibid.<br />
3 Ibid.<br />
4 Ibid.<br />
5 Moore TJ, Cohen MR, Furberg CD. Serious adverse drug events reported to the<br />
Food and <strong>Drug</strong> Adm<strong>in</strong>istration, 1998–2005. Archives <strong>of</strong> Internal Medic<strong>in</strong>e<br />
2007;167(15):1752–9.<br />
6 Lucado J, Paez K, Elixhauser E. Medication-Related <strong>Adverse</strong> Outcomes <strong>in</strong> U.S.<br />
<strong>Hospitals</strong> and Emergency Departments, 2008. <strong>HCUP</strong> Statistical Brief #109. April<br />
<strong>2011</strong>. Agency for Healthcare Research and Quality, Rockville, MD.<br />
http://www.hcup-us.ahrq.gov/reports/statbriefs/sb109.pdf. Accessed June 24, 2013.<br />
7 Classen DC, Jaser L, and Budnitz DS. <strong>Adverse</strong> <strong>Drug</strong> <strong>Events</strong> Among Hospitalized<br />
Medicare Patients: Epidemiology and National Estimates from a New Approach to<br />
Surveillance. The Jo<strong>in</strong>t Comm.J. on Quality and Patient Safety. 2010, 36:1, 12-21.<br />
Highlights<br />
■ In <strong>2011</strong>, adverse drug events<br />
(ADEs) <strong>in</strong> U.S. hospitals were<br />
three times more likely to be<br />
present on admission (388 per<br />
10,000 discharges) than to<br />
orig<strong>in</strong>ate dur<strong>in</strong>g the hospital stay<br />
(129 per 10,000 discharges).<br />
■ The most common general causes<br />
<strong>of</strong> ADEs that were present on<br />
admission (POA) were antibiotics<br />
and anti-<strong>in</strong>fectives (23.4 percent<br />
<strong>of</strong> all ADEs), systemic agents<br />
(13.6 percent), nonspecific ADE<br />
causes (12.9 percent), and<br />
hormones (11.9 percent).<br />
■ The most common general causes<br />
<strong>of</strong> ADEs that orig<strong>in</strong>ated dur<strong>in</strong>g the<br />
stay were antibiotics and anti<strong>in</strong>fectives<br />
(28.0 percent <strong>of</strong> all<br />
ADEs), nonspecific ADE causes<br />
(16.6 percent), hormones (16.1<br />
percent), and analgesics (12.6<br />
percent).<br />
■ Overall, the most common specific<br />
ADEs were related to clostridium<br />
difficile <strong>in</strong>fection (95 per 10,000<br />
discharges), ant<strong>in</strong>eoplastic drugs,<br />
and steroids (each at a rate <strong>of</strong> 57<br />
per 10,000 discharges).<br />
■ Almost all ADEs were more likely<br />
to be POA than to orig<strong>in</strong>ate dur<strong>in</strong>g<br />
the stay. The largest differences<br />
were observed for<br />
antidepressants (17.6 times more<br />
likely to be POA) and central<br />
nervous system drugs (13.5 times<br />
more likely to be POA).<br />
■ ADEs due to CNS depressants<br />
and anesthetics were nearly two<br />
times more likely to orig<strong>in</strong>ate<br />
dur<strong>in</strong>g the stay than to be POA.<br />
Antibiotic-related ADEs were<br />
equally likely to be POA as to<br />
orig<strong>in</strong>ate dur<strong>in</strong>g the stay.<br />
1
Hospital stays <strong>in</strong>volv<strong>in</strong>g ADEs have been reported for a range <strong>of</strong> drugs, <strong>in</strong>clud<strong>in</strong>g hormones, analgesics,<br />
antibiotics, and cardiovascular drugs, among others. 9 <strong>Adverse</strong> drug events may be a reason for<br />
admission to the hospital—that is, the ADE was present on admission (POA). Alternatively, ADEs may<br />
orig<strong>in</strong>ate dur<strong>in</strong>g the hospital stay because <strong>of</strong> medications adm<strong>in</strong>istered dur<strong>in</strong>g hospitalization. <strong>Adverse</strong><br />
drug events are the most common nonsurgical adverse events <strong>in</strong> hospitals. 10 In 2008, about 14 percent<br />
<strong>of</strong> Medicare patients experienced an adverse event orig<strong>in</strong>at<strong>in</strong>g dur<strong>in</strong>g their hospital stay, cost<strong>in</strong>g an<br />
estimated $3.8 billion a year, with about a third <strong>of</strong> the events be<strong>in</strong>g ADEs. 11 This Statistical Brief presents<br />
more recent data on national ADE rates over all payers <strong>in</strong> <strong>2011</strong>.<br />
In 32 <strong>of</strong> 46 States participat<strong>in</strong>g <strong>in</strong> the Healthcare Cost and Utilization Project (<strong>HCUP</strong>), the data <strong>in</strong>dicate<br />
whether diagnoses are POA or orig<strong>in</strong>ate dur<strong>in</strong>g the hospital stay. In these States, <strong>in</strong>patient data can be<br />
used to chart the frequency <strong>of</strong> <strong>in</strong>-hospital events and to report the frequency <strong>of</strong> community-occurr<strong>in</strong>g<br />
ADEs that are serious enough to require hospitalization and be observed at admission. This Statistical<br />
Brief presents data from these 32 States. The <strong>2011</strong> rates are reported for general classes as well as the<br />
specific types <strong>of</strong> drugs that cause ADEs. 12<br />
All numbers noted <strong>in</strong> the text and <strong>in</strong>cluded <strong>in</strong> the tables are actual values, not estimates, because the<br />
data <strong>in</strong>clude a census <strong>of</strong> discharges rather than a sample <strong>of</strong> discharges. In other words, we count the<br />
actual number <strong>of</strong> hospital stays with ADEs <strong>in</strong> the 32 States. Because we analyze numbers for the actual<br />
population rather than a sample, there is no need to estimate how well the sample represents an<br />
underly<strong>in</strong>g population. As a result, there is no sampl<strong>in</strong>g error associated with the calculated values<br />
presented, and significance test<strong>in</strong>g is not necessary. 13<br />
8 Classen DC, Pestotnik SL, Evans RS, et al. <strong>Adverse</strong> drug events <strong>in</strong> hospitalized patients. Excess length <strong>of</strong> stay, extra costs, and<br />
attributable mortality. JAMA 1997 Jan 22:277(4):301–6.<br />
9 Lucado J, Paez K, Elixhauser E. Medication-Related <strong>Adverse</strong> Outcomes <strong>in</strong> U.S. <strong>Hospitals</strong> and Emergency Departments, 2008.<br />
<strong>HCUP</strong> Statistical Brief #109. April <strong>2011</strong>. Agency for Healthcare Research and Quality, Rockville, MD. http://www.hcupus.ahrq.gov/reports/statbriefs/sb109.pdf.<br />
Accessed June 24, 2013.<br />
10 de Vries EN, Ramrattan MA, Smorenburg SM, Gouma DJ, Boermeester MA. The <strong>in</strong>cidence and nature <strong>of</strong> <strong>in</strong>-hospital adverse<br />
events: a systematic review. Quality and Safety <strong>in</strong> Health Care. 2008;17;216–23.<br />
11<br />
Lev<strong>in</strong>son DR. <strong>Adverse</strong> <strong>Events</strong> <strong>in</strong> <strong>Hospitals</strong>: National Incidence Among Medicare Beneficiaries. Office <strong>of</strong> Inspector General,<br />
Department <strong>of</strong> Health and Human Services, 2010. OEI-06-09-00090.<br />
12 2010 <strong>HCUP</strong> ADE orig<strong>in</strong>ation rates were presented <strong>in</strong> Enc<strong>in</strong>osa WE and Bae J. Will Mean<strong>in</strong>gful Use Hospital EMR Prevent<br />
Hospital-Acquired <strong>Drug</strong> <strong>Events</strong>? WHITE Conference, October, 2012. http://www.rhsmith.umd.edu/chidswhite/2012/program.aspx.<br />
Accessed August 11, 2013.<br />
13 Houchens, R. Inferences with <strong>HCUP</strong> State Databases F<strong>in</strong>al Report. <strong>HCUP</strong> Methods Series Report # 2010-05. Onl<strong>in</strong>e October 12,<br />
2010. U.S. Agency for Healthcare Research and Quality. http://www.hcup-us.ahrq.gov/reports/methods/2010_05.pdf.<br />
Accessed June 24, 2013.<br />
2
F<strong>in</strong>d<strong>in</strong>gs<br />
Frequency <strong>of</strong> adverse drug events, <strong>2011</strong><br />
Across a total <strong>of</strong> 20,172,966 discharges <strong>in</strong> the 32 States <strong>in</strong>cluded <strong>in</strong> our analysis, there were 782,757<br />
ADEs that were present on admission and 259,662 ADEs that orig<strong>in</strong>ated dur<strong>in</strong>g the hospital stay. Table 1<br />
presents the rate and percentage <strong>of</strong> ADEs for a range <strong>of</strong> causes. Overall, ADEs observed dur<strong>in</strong>g<br />
hospitalization were more likely to be present on admission (388 per 10,000 discharges) than to orig<strong>in</strong>ate<br />
dur<strong>in</strong>g the hospital stay (129 per 10,000 discharges). Among ADEs present on admission, the most<br />
common general causes were antibiotics and anti-<strong>in</strong>fectives (23.4 percent <strong>of</strong> all ADEs), systemic agents<br />
(13.6 percent), nonspecific ADE causes (12.9 percent), and hormones (11.9 percent). Among ADEs that<br />
orig<strong>in</strong>ated dur<strong>in</strong>g the stay, the most prevalent general causes were antibiotics and anti-<strong>in</strong>fectives (28.0<br />
percent <strong>of</strong> all ADEs), nonspecific ADE causes (16.6 percent), hormones (16.1 percent), and analgesics<br />
(12.6 percent).<br />
Table 1. <strong>Adverse</strong> drug events (ADEs) <strong>in</strong> hospital <strong>in</strong>patient sett<strong>in</strong>gs, 32 states, <strong>2011</strong><br />
<strong>Adverse</strong> drug event cause a<br />
ADEs based on diagnoses<br />
present on admission<br />
Number <strong>of</strong><br />
ADEs<br />
per 10,000<br />
discharges<br />
Percent <strong>of</strong><br />
ADEs b<br />
ADEs based on diagnoses<br />
that orig<strong>in</strong>ated dur<strong>in</strong>g the<br />
hospital stay<br />
Number <strong>of</strong><br />
ADEs<br />
per 10,000<br />
discharges<br />
Percent <strong>of</strong><br />
ADEs b<br />
Any ADE cause 388.0 100.0 128.7 100.0<br />
Antibiotics and anti-<strong>in</strong>fectives 90.9 23.4 36.1 28.0<br />
Antibiotics 12.5 3.2 12.9 10.0<br />
Clostridium difficile <strong>in</strong>fection 14 73.1 18.8 21.9 17.1<br />
Other anti-<strong>in</strong>fectives 6.3 1.6 1.7 1.3<br />
Hormones 46.3 11.9 20.7 16.1<br />
Steroids 37.3 9.6 19.7 15.3<br />
Insul<strong>in</strong> and hypoglycemics 7.1 1.8 0.8 0.6<br />
Other hormones 3.0 0.8 0.3 0.2<br />
Systemic agents 52.8 13.6 8.5 6.6<br />
Ant<strong>in</strong>eoplastic drugs 49.2 12.7 7.8 6.0<br />
Antiallergy and antiemetic drugs 3.1 0.8 0.7 0.5<br />
Other systemic agents 0.8 0.2 0.1 0.1<br />
Agents affect<strong>in</strong>g blood constituents 43.9 11.3 8.5 6.6<br />
Anticoagulants 40.6 10.5 6.7 5.2<br />
Other agents that affect blood constituents 3.9 1.0 1.9 1.5<br />
Analgesics 45.5 11.7 16.2 12.6<br />
Opiates/Narcotics 18.8 4.9 11.2 8.7<br />
NSAIDS 28.3 7.3 5.1 4.0<br />
14 Clostridium difficile <strong>in</strong>fection (CDI) <strong>of</strong>ten occurs as a complication <strong>of</strong> antibiotic therapy; ampicill<strong>in</strong>, cl<strong>in</strong>damyc<strong>in</strong>, third-generation<br />
cephalospor<strong>in</strong>s (such as cefotaxime and ceftazidime), and fluoroqu<strong>in</strong>olones are commonly identified as high-risk drugs. From:<br />
Blondeau JM. What have we learned about antimicrobial use and the risks for Clostridium difficile-associated diarrhoea? Journal <strong>of</strong><br />
Antimicrobial Chemotherapy 2009;63(2):230–7.<br />
3
Table 1. <strong>Adverse</strong> drug events (ADEs) <strong>in</strong> hospital <strong>in</strong>patient sett<strong>in</strong>gs, 32 states, <strong>2011</strong> (cont<strong>in</strong>ued)<br />
<strong>Adverse</strong> drug event cause a<br />
ADEs based on diagnoses<br />
present on admission<br />
Number <strong>of</strong><br />
ADEs<br />
per 10,000<br />
discharges<br />
Percent <strong>of</strong><br />
ADEs b<br />
ADEs based on diagnoses<br />
that orig<strong>in</strong>ated dur<strong>in</strong>g the<br />
hospital stay<br />
Number <strong>of</strong><br />
ADEs<br />
per 10,000<br />
discharges<br />
Percent <strong>of</strong><br />
ADEs b<br />
Anticonvulsants and anti-Park<strong>in</strong>son drugs 11.0 2.8 1.5 1.2<br />
Hydanto<strong>in</strong> 3.3 0.9 0.4 0.3<br />
Other anticonvulsants 7.3 1.9 1.0 0.7<br />
Anti-Park<strong>in</strong>son drugs 0.8 0.2 0.1 0.1<br />
Sedatives or hypnotics 11.0 2.8 5.7 4.4<br />
CNS depressants and anesthetics 3.9 1.0 6.7 5.2<br />
Psychotropic agents 34.8 9.0 4.2 3.2<br />
Antidepressants 9.5 2.5 0.5 0.4<br />
Antipsychotics 7.0 1.8 0.8 0.7<br />
Benzodiazep<strong>in</strong>e 18.1 4.7 2.2 1.7<br />
Other psychotropic drugs 7.2 1.8 0.8 0.6<br />
Central nervous system drugs 4.9 1.3 0.4 0.3<br />
Autonomic nervous system drugs 2.6 0.7 0.7 0.5<br />
Cardiovascular drugs 29.4 7.6 7.5 5.8<br />
Digox<strong>in</strong> 4.8 1.2 0.6 0.5<br />
Antiadrenergics 4.2 1.1 1.1 0.9<br />
Other cardiovascular drugs 21.6 5.6 5.9 4.6<br />
GI system drugs 1.3 0.3 0.5 0.4<br />
Water, m<strong>in</strong>eral, and uric acid metabolism<br />
drugs<br />
16.9 4.4 6.1 4.8<br />
Saluretics 5.2 1.3 0.7 0.5<br />
Other diuretics 10.7 2.8 4.6 3.6<br />
Other drugs affect<strong>in</strong>g m<strong>in</strong>eral and uric acid<br />
metabolism<br />
1.6 0.4 0.9 0.7<br />
Smooth muscle and respiratory drugs 4.0 1.0 1.1 0.8<br />
Sk<strong>in</strong>, eye, mucous membrane drugs 1.0 0.3 0.3 0.3<br />
Vacc<strong>in</strong>es 0.3 0.1 0.1 0.1<br />
Other specific drugs 0.2 0.1 0.0 0.0<br />
Nonspecific ADE causes<br />
(drug type not specified)<br />
49.9 12.9 21.4 16.6<br />
Abbreviation: NSAIDS, nonsteroidal anti-<strong>in</strong>flammatory drugs<br />
a General ADEs are <strong>in</strong> bold; specific ADEs are <strong>in</strong>dented.<br />
b The sum may be greater than 100% because some hospital stays may <strong>in</strong>volve more than one ADE.<br />
Source: Agency for Healthcare Research and Quality (AHRQ), Center for Delivery, Organization, and Markets, Healthcare Cost and<br />
Utilization Project (<strong>HCUP</strong>), State Inpatient Databases (SID) for 32 States, <strong>2011</strong><br />
4
General causes <strong>of</strong> adverse drug events, <strong>2011</strong><br />
The general causes <strong>of</strong> adverse drug events that were present on hospital admission and those that<br />
orig<strong>in</strong>ated dur<strong>in</strong>g the stay are provided <strong>in</strong> Figure 1. The order <strong>of</strong> the list is from the most to least<br />
frequently occurr<strong>in</strong>g cause overall. The most frequent general causes <strong>of</strong> ADEs were antibiotics and anti<strong>in</strong>fectives<br />
(127 events per 10,000 discharges), nonspecific ADE causes (71 events), hormones (67<br />
events), and analgesics (62 events). Across all general causes, ADEs were substantially more likely to<br />
be present on admission than to orig<strong>in</strong>ate dur<strong>in</strong>g the stay.<br />
Figure 1. General causes <strong>of</strong> adverse drug events (ADEs), <strong>2011</strong><br />
Antibiotics and anti-<strong>in</strong>fectives<br />
36.1<br />
90.9<br />
Nonspecific ADE causes<br />
(drug type not specified)<br />
21.4<br />
49.9<br />
Hormones<br />
20.7<br />
46.3<br />
<strong>Adverse</strong> <strong>Drug</strong> Event Cause<br />
Analgesics<br />
Systemic agents<br />
Agents affect<strong>in</strong>g<br />
blood constituents<br />
Psychotropic agents<br />
Cardiovascular drugs<br />
8.5<br />
8.5<br />
4.2<br />
7.5<br />
16.2<br />
45.5<br />
52.8<br />
43.9<br />
34.8<br />
29.4<br />
<strong>Orig<strong>in</strong></strong>ated<br />
Dur<strong>in</strong>g the Stay<br />
Present on<br />
Admission<br />
Water, m<strong>in</strong>eral, and uric acid<br />
metabolism drugs<br />
6.1<br />
16.9<br />
Sedatives or hypnotics<br />
5.7<br />
11.0<br />
All other ADE causes<br />
11.2<br />
29.5<br />
0 20 40 60 80 100 120 140<br />
Number <strong>of</strong> ADEs per 10,000 Discharges<br />
Source: Agency for Healthcare Research and Quality (AHRQ), Center for Delivery, Organization, and Markets, Healthcare Cost and<br />
Utilization Project (<strong>HCUP</strong>), State Inpatient Databases (SID) for 32 States, <strong>2011</strong><br />
5
Most common specific causes <strong>of</strong> adverse drug events, <strong>2011</strong><br />
Figure 2 presents the 10 most common specific causes <strong>of</strong> adverse drug events. The data represent<br />
causes that occurred at a rate <strong>of</strong> more than 15 per 10,000 discharges. Clostridium difficile <strong>in</strong>fection was<br />
the most common ADE cause, occurr<strong>in</strong>g at a rate <strong>of</strong> 95 per 10,000 discharges. The next two most<br />
frequently occurr<strong>in</strong>g ADE causes—ant<strong>in</strong>eoplastic drugs and steroids—each occurred at a rate <strong>of</strong> 57 per<br />
10,000 discharges.<br />
With the exception <strong>of</strong> antibiotics, all <strong>of</strong> the most common specific causes <strong>of</strong> ADEs were more likely to be<br />
present on admission than to orig<strong>in</strong>ate dur<strong>in</strong>g the hospital stay. For antibiotics, the number <strong>of</strong> events was<br />
nearly equal across the sett<strong>in</strong>gs: 12.5 ADEs per 10,000 discharges were present on admission versus<br />
12.9 ADEs that orig<strong>in</strong>ated dur<strong>in</strong>g the stay.<br />
Figure 2. Ten most common specific causes <strong>of</strong> adverse drug events (ADEs), <strong>2011</strong><br />
Clostridium Clostrium difficile<br />
<strong>in</strong>fection<br />
21.9<br />
73.1<br />
Ant<strong>in</strong>eoplastic drugs<br />
7.8<br />
49.2<br />
<strong>Adverse</strong> <strong>Drug</strong> Event Cause<br />
Steroids<br />
Anticoagulants<br />
NSAIDS<br />
Opiates/Narcotics<br />
Other<br />
cardiovascular drugs<br />
6.7<br />
5.1<br />
11.2<br />
5.9<br />
19.7<br />
28.3<br />
21.6<br />
18.8<br />
40.6<br />
37.3<br />
<strong>Orig<strong>in</strong></strong>ated<br />
Dur<strong>in</strong>g the Stay<br />
Present on<br />
Admission<br />
Antibiotics<br />
12.9<br />
12.5<br />
Benzodiazep<strong>in</strong>e<br />
2.2<br />
18.1<br />
Other diuretics<br />
4.6<br />
10.7<br />
0 20 40 60 80 100<br />
Number <strong>of</strong> ADEs per 10,000 Discharges<br />
Abbreviation: NSAIDS, nonsteroidal anti-<strong>in</strong>flammatory drugs<br />
Source: Agency for Healthcare Research and Quality (AHRQ), Center for Delivery, Organization, and Markets, Healthcare Cost and<br />
Utilization Project (<strong>HCUP</strong>), State Inpatient Databases (SID) for 32 States, <strong>2011</strong><br />
6
Most common causes <strong>of</strong> adverse drug events that were present on admission versus orig<strong>in</strong>ated dur<strong>in</strong>g<br />
the stay, <strong>2011</strong><br />
Across all causes <strong>of</strong> adverse drug events, there were three times as many ADEs that were present on<br />
admission than orig<strong>in</strong>ated dur<strong>in</strong>g the stay. Most causes <strong>of</strong> adverse drug events were more likely to be<br />
present on admission.<br />
Figure 3 presents the ratio <strong>of</strong> ADEs per 10,000 discharges that were present on admission versus those<br />
that orig<strong>in</strong>ated dur<strong>in</strong>g the stay for ADE causes that had at least a 5-fold difference (i.e., the ratio was at<br />
least 5.0). Most <strong>of</strong> the ADE causes had a ratio between 5.0 and 10.0. Only two ADE causes exceeded a<br />
ratio <strong>of</strong> 10.0: ADEs that were due to antidepressants (17.6 times more likely to be POA) and central<br />
nervous system drugs (13.5 times more likely to be POA).<br />
Only one ADE cause—CNS depressants and anesthetics (data not shown)—was more likely to orig<strong>in</strong>ate<br />
dur<strong>in</strong>g the hospital stay (4 per 10,000 discharges were present on admission versus 7 per 10,000<br />
discharges orig<strong>in</strong>ated dur<strong>in</strong>g the stay). ADEs caused by antibiotics were about equally likely to orig<strong>in</strong>ate<br />
dur<strong>in</strong>g the stay as to be present on admission (data not shown).<br />
Figure 3. Most common causes <strong>of</strong> adverse drug events (ADEs) that were present on admission<br />
versus those that orig<strong>in</strong>ated dur<strong>in</strong>g the stay, <strong>2011</strong><br />
Antidepressants<br />
17.6<br />
Central nervous system drugs<br />
13.5<br />
Other psychotropic drugs<br />
9.5<br />
<strong>Adverse</strong> <strong>Drug</strong> Event Cause<br />
Insul<strong>in</strong> and hypoglycemics<br />
Antipsychotics<br />
Benzodiazep<strong>in</strong>e<br />
Saluretics<br />
Other anticonvulsants<br />
Anti-Park<strong>in</strong>son drugs<br />
8.6<br />
8.2<br />
8.2<br />
7.7<br />
7.6<br />
7.6<br />
Digox<strong>in</strong><br />
7.6<br />
Hydanto<strong>in</strong><br />
7.5<br />
Ant<strong>in</strong>eoplastic drugs<br />
Anticoagulants<br />
NSAIDS<br />
5.5<br />
6.3<br />
6.1<br />
0 5 10 15 20<br />
Ratio <strong>of</strong> ADEs per 10,000 Discharges<br />
Present on Admission versus <strong>Orig<strong>in</strong></strong>ated Dur<strong>in</strong>g Stay<br />
Abbreviation: NSAIDS, nonsteroidal anti-<strong>in</strong>flammatory drugs<br />
Source: Agency for Healthcare Research and Quality (AHRQ), Center for Delivery, Organization, and Markets, Healthcare Cost and<br />
Utilization Project (<strong>HCUP</strong>), State Inpatient Databases (SID) for 32 States, <strong>2011</strong><br />
7
Data Source<br />
The estimates <strong>in</strong> this Statistical Brief are based upon data from the Healthcare Cost and Utilization<br />
Project (<strong>HCUP</strong>) <strong>2011</strong> State Inpatient Databases (SID) from 32 States. These States <strong>in</strong>cluded data<br />
elements that designated whether diagnoses were present on admission or orig<strong>in</strong>ated dur<strong>in</strong>g the<br />
stay: Arkansas, Arizona, California, Colorado, Florida, Georgia, Hawaii, Iowa, Ill<strong>in</strong>ois, Indiana,<br />
Kansas, Kentucky, Massachusetts, Maryland, Michigan, M<strong>in</strong>nesota, Montana, Nebraska, New<br />
Jersey, Nevada, New York, Oklahoma, Oregon, Pennsylvania, South Carol<strong>in</strong>a, South Dakota,<br />
Tennessee, Texas, Virg<strong>in</strong>ia, Vermont, Wash<strong>in</strong>gton, and Wiscons<strong>in</strong>.<br />
Def<strong>in</strong>itions<br />
The specific causes <strong>of</strong> adverse drug events presented <strong>in</strong> this Statistical Brief were based on a review <strong>of</strong><br />
International Classification <strong>of</strong> Diseases, N<strong>in</strong>th Revision, Cl<strong>in</strong>ical Modification (ICD-9-CM) diagnosis codes<br />
and external cause <strong>of</strong> <strong>in</strong>jury codes (E codes). The specific ICD-9-CM codes used for each ADE cause is<br />
provided <strong>in</strong> the separate appendix associated with this Statistical Brief on the <strong>HCUP</strong>-US website at:<br />
http://www.hcup-us.ahrq.gov/reports/statbriefs/sb158_appendix.pdf.<br />
Present on admission was determ<strong>in</strong>ed for each discharge diagnosis based on two types <strong>of</strong> present-onadmission<br />
<strong>in</strong>dicator flags <strong>in</strong> the SID: (1) a diagnosis-specific flag that <strong>in</strong>dicates whether each diagnosis<br />
was present on admission, and (2) an E code flag that <strong>in</strong>dicates whether each external cause <strong>of</strong> <strong>in</strong>jury<br />
was present on admission.<br />
A total <strong>of</strong> 4,554 hospitals and 30,149,145 discharges were <strong>in</strong> the orig<strong>in</strong>al SID for the 32 States <strong>in</strong> this<br />
study. <strong>Hospitals</strong> and <strong>in</strong>dividual discharge records with miss<strong>in</strong>g or <strong>in</strong>complete present-on-admission<br />
<strong>in</strong>formation were excluded from the analysis, as shown <strong>in</strong> Table 2.<br />
Table 2. Exclusion criteria and the number <strong>of</strong> hospitals and discharges excluded<br />
Exclusion Criteria<br />
<strong>Hospitals</strong> Excluded a Discharges Excluded a<br />
Number Percent Number Percent<br />
<strong>Hospitals</strong> that reported all diagnoses and E codes<br />
as be<strong>in</strong>g present on admission<br />
48 1.1 47,104 0.2<br />
<strong>Hospitals</strong> with 20 percent or more discharges with<br />
a miss<strong>in</strong>g present on admission <strong>in</strong>dicator for<br />
1,768 38.8 8,619,776 28.6<br />
nonmiss<strong>in</strong>g diagnoses or E codes<br />
<strong>Hospitals</strong> that only coded present on admission for<br />
Medicare patients<br />
5 0.1 3,140 0.0<br />
Discharges with miss<strong>in</strong>g present on admission<br />
<strong>in</strong>formation for nonmiss<strong>in</strong>g diagnoses or E codes<br />
n/a n/a 1,309,298 4.3<br />
a Some excluded hospitals and discharges are counted more than once, as a function <strong>of</strong> meet<strong>in</strong>g more than one exclusion criteria.<br />
The f<strong>in</strong>al analysis file for this Statistical Brief <strong>in</strong>cluded 2,737 hospitals (60.1 percent) and 20,172,966<br />
discharges (66.9 percent) across the 32 States.<br />
Unit <strong>of</strong> analysis<br />
The unit <strong>of</strong> analysis is the hospital discharge (i.e., the hospital stay), not a person or patient. This means<br />
that a person who is admitted to the hospital multiple times <strong>in</strong> one year will be counted each time as a<br />
separate "discharge" from the hospital.<br />
8
About <strong>HCUP</strong><br />
<strong>HCUP</strong> is a family <strong>of</strong> powerful health care databases, s<strong>of</strong>tware tools, and products for advanc<strong>in</strong>g research.<br />
Sponsored by the Agency for Healthcare Research and Quality (AHRQ), <strong>HCUP</strong> <strong>in</strong>cludes the largest allpayer<br />
encounter-level collection <strong>of</strong> longitud<strong>in</strong>al health care data (<strong>in</strong>patient, ambulatory surgery, and<br />
emergency department) <strong>in</strong> the United States, beg<strong>in</strong>n<strong>in</strong>g <strong>in</strong> 1988. <strong>HCUP</strong> is a Federal-State-Industry<br />
Partnership that br<strong>in</strong>gs together the data collection efforts <strong>of</strong> many organizations—such as State data<br />
organizations, hospital associations, private data organizations, and the Federal government—to create a<br />
national <strong>in</strong>formation resource.<br />
<strong>HCUP</strong> would not be possible without the contributions <strong>of</strong> the follow<strong>in</strong>g data collection Partners from<br />
across the United States:<br />
Alaska State Hospital and Nurs<strong>in</strong>g Home Association<br />
Arizona Department <strong>of</strong> Health Services<br />
Arkansas Department <strong>of</strong> Health<br />
California Office <strong>of</strong> Statewide Health Plann<strong>in</strong>g and Development<br />
Colorado Hospital Association<br />
Connecticut Hospital Association<br />
Florida Agency for Health Care Adm<strong>in</strong>istration<br />
Georgia Hospital Association<br />
Hawaii Health Information Corporation<br />
Ill<strong>in</strong>ois Department <strong>of</strong> Public Health<br />
Indiana Hospital Association<br />
Iowa Hospital Association<br />
Kansas Hospital Association<br />
Kentucky Cab<strong>in</strong>et for Health and Family Services<br />
Louisiana Department <strong>of</strong> Health and <strong>Hospitals</strong><br />
Ma<strong>in</strong>e Health Data Organization<br />
Maryland Health Services Cost Review Commission<br />
Massachusetts Center for Health Information and Analysis<br />
Michigan Health & Hospital Association<br />
M<strong>in</strong>nesota Hospital Association<br />
Mississippi Department <strong>of</strong> Health<br />
Missouri Hospital Industry Data Institute<br />
Montana MHA - An Association <strong>of</strong> Montana Health Care Providers<br />
Nebraska Hospital Association<br />
Nevada Department <strong>of</strong> Health and Human Services<br />
New Hampshire Department <strong>of</strong> Health & Human Services<br />
New Jersey Department <strong>of</strong> Health<br />
New Mexico Department <strong>of</strong> Health<br />
New York State Department <strong>of</strong> Health<br />
North Carol<strong>in</strong>a Department <strong>of</strong> Health and Human Services<br />
North Dakota (data provided by the M<strong>in</strong>nesota Hospital Association)<br />
Ohio Hospital Association<br />
Oklahoma State Department <strong>of</strong> Health<br />
Oregon Association <strong>of</strong> <strong>Hospitals</strong> and Health Systems<br />
Oregon Health Policy and Research<br />
Pennsylvania Health Care Cost Conta<strong>in</strong>ment Council<br />
Rhode Island Department <strong>of</strong> Health<br />
South Carol<strong>in</strong>a Budget & Control Board<br />
South Dakota Association <strong>of</strong> Healthcare Organizations<br />
Tennessee Hospital Association<br />
Texas Department <strong>of</strong> State Health Services<br />
Utah Department <strong>of</strong> Health<br />
Vermont Association <strong>of</strong> <strong>Hospitals</strong> and Health Systems<br />
Virg<strong>in</strong>ia Health Information<br />
9
Wash<strong>in</strong>gton State Department <strong>of</strong> Health<br />
West Virg<strong>in</strong>ia Health Care Authority<br />
Wiscons<strong>in</strong> Department <strong>of</strong> Health Services<br />
Wyom<strong>in</strong>g Hospital Association<br />
About the SID<br />
The <strong>HCUP</strong> State Inpatient Databases (SID) are hospital <strong>in</strong>patient databases from data organizations<br />
participat<strong>in</strong>g <strong>in</strong> <strong>HCUP</strong>. The SID conta<strong>in</strong> the universe <strong>of</strong> the <strong>in</strong>patient discharge abstracts <strong>in</strong> the<br />
participat<strong>in</strong>g <strong>HCUP</strong> States, translated <strong>in</strong>to a uniform format to facilitate multistate comparisons and<br />
analyses. Together, the SID encompass more than 95 percent <strong>of</strong> all U.S. community hospital discharges<br />
<strong>in</strong> <strong>2011</strong>. The SID can be used to <strong>in</strong>vestigate questions unique to one State, to compare data from two or<br />
more States, to conduct market area variation analyses, and to identify State-specific trends <strong>in</strong> <strong>in</strong>patient<br />
care utilization, access, charges, and outcomes.<br />
For More Information<br />
For more <strong>in</strong>formation about <strong>HCUP</strong>, visit http://www.hcup-us.ahrq.gov/.<br />
For additional <strong>HCUP</strong> statistics, visit <strong>HCUP</strong>net, our <strong>in</strong>teractive query system, at<br />
http://hcupnet.ahrq.gov/.<br />
For <strong>in</strong>formation on other hospitalizations <strong>in</strong> the United States, download <strong>HCUP</strong> Facts and Figures:<br />
Statistics on Hospital-Based Care <strong>in</strong> the United States <strong>in</strong> 2009, located at http://www.hcupus.ahrq.gov/reports.jsp.<br />
For a detailed description <strong>of</strong> <strong>HCUP</strong>, more <strong>in</strong>formation on the design <strong>of</strong> the State Inpatient Databases<br />
(SID), please refer to the follow<strong>in</strong>g publications:<br />
Introduction to the <strong>HCUP</strong> State Inpatient Databases. Onl<strong>in</strong>e. December 2012. U.S. Agency for Healthcare<br />
Research and Quality. http://hcup-us.ahrq.gov/db/state/siddist/Introduction_to_SID.pdf. Accessed June<br />
24, 2013.<br />
Suggested Citation<br />
Weiss AJ (Truven Health Analytics), Elixhauser A (AHRQ), Bae J (Emory University), Enc<strong>in</strong>osa W<br />
(AHRQ). <strong>Orig<strong>in</strong></strong> <strong>of</strong> <strong>Adverse</strong> <strong>Drug</strong> <strong>Events</strong> <strong>in</strong> U.S. <strong>Hospitals</strong>, <strong>2011</strong>. <strong>HCUP</strong> Statistical Brief #158. July 2013.<br />
Agency for Healthcare Research and Quality, Rockville, MD. http://www.hcupus.ahrq.gov/reports/statbriefs/sb158.pdf.<br />
Acknowledgments<br />
The authors would like to acknowledge the contributions <strong>of</strong> Devi Katik<strong>in</strong>eni and Valeriy Bakaush<strong>in</strong> <strong>of</strong><br />
Social & Scientific Systems, Inc.<br />
∗ ∗ ∗<br />
10
AHRQ welcomes questions and comments from readers <strong>of</strong> this publication who are <strong>in</strong>terested <strong>in</strong><br />
obta<strong>in</strong><strong>in</strong>g more <strong>in</strong>formation about access, cost, use, f<strong>in</strong>anc<strong>in</strong>g, and quality <strong>of</strong> health care <strong>in</strong> the United<br />
States. We also <strong>in</strong>vite you to tell us how you are us<strong>in</strong>g this Statistical Brief and other <strong>HCUP</strong> data and<br />
tools, and to share suggestions on how <strong>HCUP</strong> products might be enhanced to further meet your needs.<br />
Please e-mail us at hcup@ahrq.gov or send a letter to the address below:<br />
Irene Fraser, Ph.D., Director<br />
Center for Delivery, Organization, and Markets<br />
Agency for Healthcare Research and Quality<br />
540 Gaither Road<br />
Rockville, MD 20850<br />
11