PDF File - HCUP
PDF File - HCUP
PDF File - HCUP

Create successful ePaper yourself
Turn your PDF publications into a flip-book with our unique Google optimized e-Paper software.
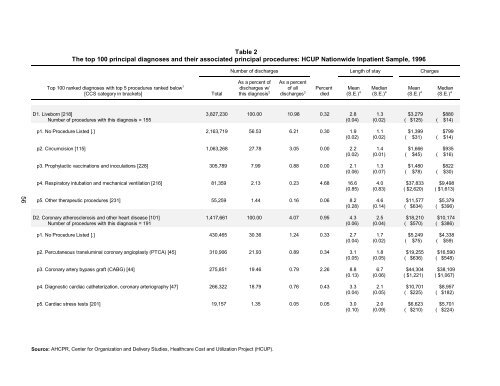
Table 2The top 100 principal diagnoses and their associated principal procedures: <strong>HCUP</strong> Nationwide Inpatient Sample, 1996Number of discharges Length of stay ChargesTop 100 ranked diagnoses with top 5 procedures ranked below[CCS category in brackets]1As a percent of As a percentdischarges w/ of all Percent Mean Median Mean MedianTotal2this diagnosis3discharges died4(S.E.)4(S.E.)4(S.E.)4(S.E.)D1. Liveborn [218] 3,827,230 100.00 10.98 0.32 2.8 1.3 $3,279 $880Number of procedures with this diagnosis = 155 (0.04) (0.02) ( $125) ( $14)p1. No Procedure Listed [.] 2,163,719 56.53 6.21 0.30 1.9 1.1 $1,399 $799(0.02) (0.02) ( $31) ( $14)p2. Circumcision [115] 1,063,268 27.78 3.05 0.00 2.2 1.4 $1,666 $935(0.02) (0.01) ( $45) ( $16)p3. Prophylactic vaccinations and inoculations [228] 305,789 7.99 0.88 0.00 2.1 1.3 $1,480 $822(0.06) (0.07) ( $78) ( $30)p4. Respiratory intubation and mechanical ventilation [216] 81,359 2.13 0.23 4.68 16.6 4.0 $37,833 $9,498(0.85) (0.83) ( $2,620) ( $1,613)56p5. Other therapeutic procedures [231] 55,259 1.44 0.16 0.06 8.2 4.6 $11,577 $5,379(0.28) (0.14) ( $634) ( $396)D2. Coronary atherosclerosis and other heart disease [101] 1,417,661 100.00 4.07 0.95 4.3 2.5 $18,210 $10,174Number of procedures with this diagnosis = 191 (0.06) (0.04) ( $570) ( $386)p1. No Procedure Listed [.] 430,465 30.36 1.24 0.33 2.7 1.7 $5,249 $4,338(0.04) (0.02) ( $75) ( $59)p2. Percutaneous transluminal coronary angioplasty (PTCA) [45] 310,906 21.93 0.89 0.34 3.1 1.8 $19,255 $16,590(0.05) (0.05) ( $636) ( $548)p3. Coronary artery bypass graft (CABG) [44] 275,851 19.46 0.79 2.26 8.8 6.7 $44,304 $38,109(0.13) (0.06) ( $1,221) ( $1,067)p4. Diagnostic cardiac catheterization, coronary arteriography [47] 266,322 18.79 0.76 0.43 3.3 2.1 $10,701 $8,957(0.04) (0.05) ( $225) ( $182)p5. Cardiac stress tests [201] 19,157 1.35 0.05 0.05 3.0 2.0 $6,623 $5,701(0.10) (0.09) ( $210) ( $224)Source: AHCPR, Center for Organization and Delivery Studies, Healthcare Cost and Utilization Project (<strong>HCUP</strong>).
Table 2The top 100 principal diagnoses and their associated principal procedures: <strong>HCUP</strong> Nationwide Inpatient Sample, 1996Number of discharges Length of stay ChargesTop 100 ranked diagnoses with top 5 procedures ranked below[CCS category in brackets]1As a percent of As a percentdischarges w/ of all Percent Mean Median Mean MedianTotal2this diagnosis3discharges died4(S.E.)4(S.E.)4(S.E.)4(S.E.)D3. Pneumonia (except that caused by tuberculosis or sexually 1,234,565 100.00 3.54 6.35 6.5 4.4 $12,175 $7,344transmitted disease) [122]Number of procedures with this diagnosis = 209 (0.05) (0.03) ( $175) ( $85)p1. No Procedure Listed [.] 861,232 69.76 2.47 4.12 5.2 3.8 $7,918 $6,115(0.03) (0.02) ( $90) ( $67)p2. Diagnostic bronchoscopy and biopsy of bronchus [37] 43,983 3.56 0.13 5.35 10.5 8.3 $22,423 $16,778(0.10) (0.08) ( $447) ( $263)p3. Respiratory intubation and mechanical ventilation [216] 43,925 3.56 0.13 40.43 12.7 9.9 $43,639 $32,237(0.19) (0.12) ( $846) ( $674)57p4. Other therapeutic procedures [231] 29,218 2.37 0.08 4.21 6.2 4.4 $9,188 $6,643(0.18) (0.16) ( $547) ( $465)p5. Other respiratory therapy [217] 28,152 2.28 0.08 4.08 5.3 3.8 $8,534 $6,418(0.16) (0.12) ( $353) ( $285)D4. Congestive heart failure, nonhypertensive [108] 990,085 100.00 2.84 5.16 6.0 4.0 $11,247 $7,353Number of procedures with this diagnosis = 205 (0.05) (0.03) ( $155) ( $84)p1. No Procedure Listed [.] 644,789 65.12 1.85 3.82 4.9 3.5 $7,669 $6,151(0.03) (0.02) ( $95) ( $73)p2. Diagnostic cardiac catheterization, coronary arteriography [47] 43,234 4.37 0.12 2.24 6.7 5.0 $17,393 $14,242(0.10) (0.06) ( $351) ( $272)p3. Diagnostic ultrasound of heart (echocardiogram) [193] 41,782 4.22 0.12 2.11 5.6 3.9 $10,064 $7,831(0.14) (0.11) ( $292) ( $241)p4. Respiratory intubation and mechanical ventilation [216] 27,240 2.75 0.08 24.33 8.4 5.9 $23,400 $16,188(0.16) (0.10) ( $529) ( $318)p5. Incision of pleura, thoracentesis, chest drainage [39] 16,502 1.67 0.05 8.03 8.9 6.6 $15,135 $11,568(0.17) (0.12) ( $320) ( $232)Source: AHCPR, Center for Organization and Delivery Studies, Healthcare Cost and Utilization Project (<strong>HCUP</strong>).
Table 2The top 100 principal diagnoses and their associated principal procedures: <strong>HCUP</strong> Nationwide Inpatient Sample, 1996Number of discharges Length of stay ChargesTop 100 ranked diagnoses with top 5 procedures ranked below[CCS category in brackets]1As a percent of As a percentdischarges w/ of all Percent Mean Median Mean MedianTotal2this diagnosis3discharges died4(S.E.)4(S.E.)4(S.E.)4(S.E.)D5. Acute myocardial infarction [100] 743,677 100.00 2.13 8.95 6.0 4.3 $21,367 $13,986Number of procedures with this diagnosis = 183 (0.07) (0.04) ( $466) ( $278)p1. No Procedure Listed [.] 220,323 29.63 0.63 8.68 4.6 3.5 $9,288 $7,719(0.04) (0.04) ( $123) ( $106)p2. Percutaneous transluminal coronary angioplasty (PTCA) [45] 137,326 18.47 0.39 2.29 5.1 3.9 $25,642 $22,540(0.06) (0.06) ( $610) ( $589)p3. Diagnostic cardiac catheterization, coronary arteriography [47] 132,030 17.75 0.38 2.70 5.4 4.2 $16,174 $13,256(0.06) (0.05) ( $289) ( $235)p4. Coronary artery bypass graft (CABG) [44] 73,157 9.84 0.21 4.76 11.3 8.8 $53,907 $45,180(0.20) (0.13) ( $1,328) ( $1,244)58p5. Other therapeutic procedures [231] 41,509 5.58 0.12 4.88 3.8 2.7 $13,176 $11,569(0.07) (0.08) ( $243) ( $230)D6. Trauma to perineum and vulva [193] 693,164 100.00 1.99 0.00 1.7 1.1 $3,414 $3,106Number of procedures with this diagnosis = 52 (0.01) (0.02) ( $54) ( $54)p1. Repair of current obstetric laceration [140] 380,007 54.82 1.09 0.00 1.6 1.1 $3,267 $3,021(0.02) (0.02) ( $49) ( $52)p2. Other procedures to assist delivery [137] 196,172 28.30 0.56 0.00 1.7 1.1 $3,415 $3,101(0.02) (0.03) ( $100) ( $103)p3. Episiotomy [133] 47,551 6.86 0.14 0.00 1.7 1.2 $3,599 $3,231(0.03) (0.03) ( $113) ( $107)p4. Forceps, vacuum, and breech delivery [135] 32,927 4.75 0.09 0.00 1.9 1.4 $3,890 $3,589(0.02) (0.02) ( $77) ( $85)p5. Ligation of fallopian tubes [121] 13,397 1.93 0.04 0.00 1.8 1.3 $5,800 $5,527(0.03) (0.03) ( $131) ( $176)Source: AHCPR, Center for Organization and Delivery Studies, Healthcare Cost and Utilization Project (<strong>HCUP</strong>).
Table 2The top 100 principal diagnoses and their associated principal procedures: <strong>HCUP</strong> Nationwide Inpatient Sample, 1996Number of discharges Length of stay ChargesTop 100 ranked diagnoses with top 5 procedures ranked below[CCS category in brackets]1As a percent of As a percentdischarges w/ of all Percent Mean Median Mean MedianTotal2this diagnosis3discharges died4(S.E.)4(S.E.)4(S.E.)4(S.E.)D7. Acute cerebrovascular disease [109] 654,600 100.00 1.88 10.57 7.6 4.7 $14,775 $8,739Number of procedures with this diagnosis = 194 (0.12) (0.04) ( $291) ( $106)p1. No Procedure Listed [.] 356,846 54.51 1.02 7.44 6.0 4.1 $9,226 $7,220(0.17) (0.04) ( $213) ( $91)p2. Computerized axial tomography (CT) scan head [177] 75,614 11.55 0.22 8.95 6.5 4.3 $9,780 $7,108(0.19) (0.12) ( $309) ( $208)p3. Respiratory intubation and mechanical ventilation [216] 22,868 3.49 0.07 71.60 6.9 3.0 $22,250 $13,802(0.22) (0.10) ( $550) ( $383)p4. Gastrostomy, temporary and permanent [71] 20,448 3.12 0.06 8.92 15.5 11.8 $25,757 $20,047(0.32) (0.22) ( $543) ( $339)59p5. Magnetic resonance imaging [198] 17,209 2.63 0.05 1.92 6.5 4.6 $11,396 $8,938(0.21) (0.12) ( $389) ( $290)D8. Normal pregnancy and/or delivery [196] 578,841 100.00 1.66 0.00 1.6 1.0 $3,355 $3,007Number of procedures with this diagnosis = 41 (0.01) (0.02) ( $48) ( $45)p1. Other procedures to assist delivery [137] 236,767 40.90 0.68 0.00 1.5 0.9 $3,162 $2,925(0.01) (0.02) ( $45) ( $45)p2. Episiotomy [133] 235,895 40.75 0.68 0.00 1.6 1.1 $3,305 $3,057(0.02) (0.03) ( $61) ( $57)p3. No Procedure Listed [.] 40,410 6.98 0.12 0.00 1.5 0.9 $2,522 $2,283(0.06) (0.08) ( $137) ( $197)p4. Artificial rupture of membranes to assist delivery [136] 19,753 3.41 0.06 0.00 1.4 0.9 $3,055 $2,858(0.03) (0.04) ( $82) ( $97)p5. Ligation of fallopian tubes [121] 16,667 2.88 0.05 0.00 1.7 1.3 $5,436 $5,224(0.03) (0.03) ( $132) ( $154)Source: AHCPR, Center for Organization and Delivery Studies, Healthcare Cost and Utilization Project (<strong>HCUP</strong>).
Table 2The top 100 principal diagnoses and their associated principal procedures: <strong>HCUP</strong> Nationwide Inpatient Sample, 1996Number of discharges Length of stay ChargesTop 100 ranked diagnoses with top 5 procedures ranked below[CCS category in brackets]1As a percent of As a percentdischarges w/ of all Percent Mean Median Mean MedianTotal2this diagnosis3discharges died4(S.E.)4(S.E.)4(S.E.)4(S.E.)D9. Affective disorders [69] 574,120 100.00 1.65 0.10 9.3 6.2 $8,435 $5,693Number of procedures with this diagnosis = 181 (0.24) (0.12) ( $302) ( $139)p1. No Procedure Listed [.] 443,242 77.20 1.27 0.04 8.2 5.6 $7,240 $5,136(0.22) (0.10) ( $270) ( $123)p2. Psychological and psychiatric evaluation and therapy [218] 71,162 12.40 0.20 0.23 14.3 10.2 $13,129 $9,269(0.50) (0.58) ( $651) ( $582)p3. Alcohol and drug rehabilitation/detoxification [219] 16,600 2.89 0.05 0.00 7.4 5.5 $7,113 $5,534(0.33) (0.41) ( $597) ( $477)p4. Other physical therapy and rehabilitation [215] 9,113 1.59 0.03 0.00 13.1 9.6 $10,149 $7,508(0.70) (0.55) ( $590) ( $390)60p5. Computerized axial tomography (CT) scan head [177] 3,921 0.68 0.01 0.26 13.4 9.4 $12,811 $8,834(0.71) (0.65) ( $909) ( $573)D10. Cardiac dysrhythmias [106] 574,046 100.00 1.65 1.21 3.9 2.3 $9,941 $5,806Number of procedures with this diagnosis = 206 (0.04) (0.03) ( $174) ( $81)p1. No Procedure Listed [.] 316,754 55.18 0.91 0.67 3.0 1.9 $5,426 $4,408(0.02) (0.02) ( $65) ( $51)p2. Insertion, revision, replacement, removal of cardiac pacemaker or 81,634 14.22 0.23 0.84 5.6 3.9 $26,934 $21,070cardioverter/defibrillator [48](0.12) (0.11) ( $533) ( $381)p3. Conversion of cardiac rhythm [225] 41,562 7.24 0.12 1.60 3.4 2.1 $6,266 $4,417(0.07) (0.05) ( $150) ( $100)p4. Diagnostic ultrasound of heart (echocardiogram) [193] 21,742 3.79 0.06 0.46 3.8 2.5 $7,278 $5,581(0.11) (0.08) ( $224) ( $155)p5. Other diagnostic cardiovascular procedures [62] 17,979 3.13 0.05 0.47 4.1 2.6 $13,762 $11,061(0.15) (0.18) ( $464) ( $408)Source: AHCPR, Center for Organization and Delivery Studies, Healthcare Cost and Utilization Project (<strong>HCUP</strong>).
Table 2The top 100 principal diagnoses and their associated principal procedures: <strong>HCUP</strong> Nationwide Inpatient Sample, 1996Number of discharges Length of stay ChargesTop 100 ranked diagnoses with top 5 procedures ranked below[CCS category in brackets]1As a percent of As a percentdischarges w/ of all Percent Mean Median Mean MedianTotal2this diagnosis3discharges died4(S.E.)4(S.E.)4(S.E.)4(S.E.)D11. Chronic obstructive pulmonary disease and bronchiectasis [127] 547,480 100.00 1.57 2.90 5.9 4.0 $10,552 $6,868Number of procedures with this diagnosis = 196 (0.05) (0.03) ( $184) ( $74)p1. No Procedure Listed [.] 414,828 75.77 1.19 1.67 5.1 3.7 $7,783 $6,180(0.04) (0.02) ( $100) ( $67)p2. Other respiratory therapy [217] 17,049 3.11 0.05 1.61 5.7 3.8 $8,465 $6,340(0.22) (0.15) ( $390) ( $263)p3. Respiratory intubation and mechanical ventilation [216] 16,238 2.97 0.05 25.57 11.8 8.9 $33,765 $24,813(0.26) (0.25) ( $854) ( $681)p4. Diagnostic bronchoscopy and biopsy of bronchus [37] 10,502 1.92 0.03 3.41 8.3 6.4 $17,085 $12,195(0.18) (0.13) ( $676) ( $334)61p5. Arterial blood gases [205] 7,664 1.40 0.02 2.26 5.1 3.6 $8,832 $6,709(0.23) (0.18) ( $574) ( $584)D12. Spondylosis, intervertebral disc disorders, other back problems [205] 519,130 100.00 1.49 0.16 3.4 1.9 $10,576 $7,966Number of procedures with this diagnosis = 180 (0.05) (0.03) ( $213) ( $177)p1. Laminectomy, excision intervertebral disc [3] 317,924 61.24 0.91 0.10 2.9 1.6 $10,483 $8,408(0.05) (0.04) ( $238) ( $209)p2. No Procedure Listed [.] 71,600 13.79 0.21 0.20 4.2 2.6 $5,566 $4,013(0.15) (0.05) ( $241) ( $83)p3. Spinal fusion [158] 64,973 12.52 0.19 0.16 3.7 2.4 $18,433 $14,170(0.08) (0.10) ( $545) ( $384)p4. Insertion of catheter or spinal stimulator and injection into spinal 22,476 4.33 0.06 0.17 4.7 3.2 $7,347 $5,655canal [5](0.21) (0.16) ( $300) ( $263)p5. Myelogram [181] 7,770 1.50 0.02 0.07 3.3 1.7 $5,746 $4,168(0.37) (0.46) ( $708) ( $837)Source: AHCPR, Center for Organization and Delivery Studies, Healthcare Cost and Utilization Project (<strong>HCUP</strong>).
Table 2The top 100 principal diagnoses and their associated principal procedures: <strong>HCUP</strong> Nationwide Inpatient Sample, 1996Number of discharges Length of stay ChargesTop 100 ranked diagnoses with top 5 procedures ranked below[CCS category in brackets]1As a percent of As a percentdischarges w/ of all Percent Mean Median Mean MedianTotal2this diagnosis3discharges died4(S.E.)4(S.E.)4(S.E.)4(S.E.)D13. Nonspecific chest pain [102] 514,895 100.00 1.48 0.07 2.0 1.1 $5,239 $4,292Number of procedures with this diagnosis = 179 (0.02) (0.02) ( $77) ( $71)p1. No Procedure Listed [.] 337,078 65.47 0.97 0.04 1.8 1.0 $4,278 $3,702(0.02) (0.01) ( $61) ( $60)p2. Diagnostic cardiac catheterization, coronary arteriography [47] 85,330 16.57 0.24 0.01 2.4 1.5 $8,583 $7,812(0.03) (0.03) ( $192) ( $175)p3. Cardiac stress tests [201] 29,975 5.82 0.09 0.00 1.8 1.0 $4,910 $4,257(0.06) (0.04) ( $186) ( $209)p4. Diagnostic ultrasound of heart (echocardiogram) [193] 14,392 2.80 0.04 0.05 2.4 1.5 $5,599 $4,851(0.16) (0.11) ( $232) ( $224)62p5. Electrographic cardiac monitoring [203] 11,724 2.28 0.03 0.04 1.6 0.8 $3,445 $2,942(0.07) (0.06) ( $187) ( $225)D14. Fluid and electrolyte disorders [55] 492,750 100.00 1.41 3.00 4.5 2.6 $6,596 $4,228Number of procedures with this diagnosis = 208 (0.05) (0.03) ( $94) ( $52)p1. No Procedure Listed [.] 363,640 73.80 1.04 2.15 3.5 2.2 $4,755 $3,548(0.03) (0.02) ( $56) ( $46)p2. Upper gastrointestinal endoscopy, biopsy [70] 15,802 3.21 0.05 2.55 6.8 4.9 $10,902 $8,321(0.11) (0.09) ( $220) ( $177)p3. Gastrostomy, temporary and permanent [71] 8,316 1.69 0.02 6.75 10.5 7.7 $14,500 $10,655(0.30) (0.18) ( $460) ( $301)p4. Other therapeutic procedures [231] 8,020 1.63 0.02 3.95 4.4 2.5 $6,087 $3,616(0.40) (0.13) ( $732) ( $405)p5. Computerized axial tomography (CT) scan head [177] 7,358 1.49 0.02 2.99 6.0 3.8 $8,069 $6,004(0.25) (0.14) ( $338) ( $253)Source: AHCPR, Center for Organization and Delivery Studies, Healthcare Cost and Utilization Project (<strong>HCUP</strong>).
Table 2The top 100 principal diagnoses and their associated principal procedures: <strong>HCUP</strong> Nationwide Inpatient Sample, 1996Number of discharges Length of stay ChargesTop 100 ranked diagnoses with top 5 procedures ranked below[CCS category in brackets]1As a percent of As a percentdischarges w/ of all Percent Mean Median Mean MedianTotal2this diagnosis3discharges died4(S.E.)4(S.E.)4(S.E.)4(S.E.)D15. Biliary tract disease [149] 477,660 100.00 1.37 0.74 4.3 2.5 $12,358 $9,425Number of procedures with this diagnosis = 158 (0.04) (0.04) ( $168) ( $129)p1. Cholecystectomy and common duct exploration [84] 363,040 76.00 1.04 0.54 4.2 2.5 $13,054 $10,265(0.04) (0.05) ( $185) ( $152)p2. No Procedure Listed [.] 48,206 10.09 0.14 0.75 3.1 1.9 $5,386 $4,141(0.09) (0.03) ( $96) ( $66)p3. Other non-OR gastrointestinal therapeutic procedures [98] 21,292 4.46 0.06 0.77 4.6 3.0 $11,080 $8,450(0.10) (0.11) ( $376) ( $255)p4. Endoscopic retrograde cannulation of pancreas (ERCP) [82] 11,407 2.39 0.03 1.12 5.0 3.5 $10,942 $8,842(0.11) (0.10) ( $265) ( $229)63p5. Other OR gastrointestinal therapeutic procedures [99] 6,529 1.37 0.02 3.30 10.2 7.8 $26,714 $20,343(0.26) (0.24) ( $815) ( $666)D16. Complication of device, implant or graft [237] 469,556 100.00 1.35 1.86 6.0 3.6 $19,460 $12,534Number of procedures with this diagnosis = 215 (0.05) (0.03) ( $421) ( $218)p1. Other OR procedures on vessels other than head and neck [61] 50,098 10.67 0.14 1.73 5.3 3.1 $19,322 $13,765(0.11) (0.08) ( $552) ( $456)p2. No Procedure Listed [.] 49,174 10.47 0.14 1.30 4.6 2.9 $7,459 $5,054(0.12) (0.05) ( $265) ( $109)p3. Hip replacement, total and partial [153] 30,428 6.48 0.09 0.81 6.2 4.6 $25,278 $21,846(0.09) (0.07) ( $557) ( $414)p4. Creation, revision and removal of arteriovenous fistula or vessel-to- 24,857 5.29 0.07 1.55 4.8 2.2 $15,110 $11,344vessel cannula for dialysis [57](0.17) (0.14) ( $405) ( $275)p5. Percutaneous transluminal coronary angioplasty (PTCA) [45] 23,185 4.94 0.07 0.72 4.0 2.5 $23,775 $19,868(0.10) (0.08) ( $815) ( $697)Source: AHCPR, Center for Organization and Delivery Studies, Healthcare Cost and Utilization Project (<strong>HCUP</strong>).
Table 2The top 100 principal diagnoses and their associated principal procedures: <strong>HCUP</strong> Nationwide Inpatient Sample, 1996Number of discharges Length of stay ChargesTop 100 ranked diagnoses with top 5 procedures ranked below[CCS category in brackets]1As a percent of As a percentdischarges w/ of all Percent Mean Median Mean MedianTotal2this diagnosis3discharges died4(S.E.)4(S.E.)4(S.E.)4(S.E.)D17. Fetal distress and abnormal forces of labor [190] 428,124 100.00 1.23 0.01 2.4 1.7 $5,169 $4,300Number of procedures with this diagnosis = 46 (0.04) (0.04) ( $87) ( $102)p1. Cesarean section [134] 160,121 37.40 0.46 0.01 3.6 2.8 $7,688 $7,064(0.03) (0.02) ( $117) ( $126)p2. Other procedures to assist delivery [137] 86,643 20.24 0.25 0.00 1.6 1.0 $3,372 $3,025(0.03) (0.04) ( $105) ( $121)p3. Forceps, vacuum, and breech delivery [135] 78,801 18.41 0.23 0.01 1.9 1.3 $3,955 $3,557(0.02) (0.02) ( $96) ( $108)p4. Episiotomy [133] 52,529 12.27 0.15 0.00 1.8 1.2 $3,650 $3,278(0.03) (0.03) ( $126) ( $129)64p5. Repair of current obstetric laceration [140] 25,694 6.00 0.07 0.00 1.7 1.1 $3,336 $2,968(0.03) (0.04) ( $80) ( $69)D18. Septicemia (except in labor) [2] 419,158 100.00 1.20 13.74 8.2 5.6 $17,022 $10,156Number of procedures with this diagnosis = 211 (0.07) (0.04) ( $264) ( $138)p1. No Procedure Listed [.] 219,239 52.30 0.63 11.83 5.8 4.5 $9,580 $7,392(0.04) (0.03) ( $127) ( $97)p2. Other vascular catheterization, not heart [54] 15,505 3.70 0.04 23.75 10.5 8.0 $23,259 $17,024(0.20) (0.20) ( $560) ( $414)p3. Diagnostic spinal tap [4] 13,569 3.24 0.04 5.90 5.9 3.7 $10,771 $6,782(0.14) (0.10) ( $369) ( $269)p4. Blood transfusion [222] 10,390 2.48 0.03 15.51 8.6 6.6 $16,621 $12,838(0.19) (0.15) ( $610) ( $427)p5. Debridement of wound, infection or burn [169] 10,338 2.47 0.03 15.30 16.7 11.6 $33,358 $21,968(0.54) (0.35) ( $1,105) ( $774)Source: AHCPR, Center for Organization and Delivery Studies, Healthcare Cost and Utilization Project (<strong>HCUP</strong>).
Table 2The top 100 principal diagnoses and their associated principal procedures: <strong>HCUP</strong> Nationwide Inpatient Sample, 1996Number of discharges Length of stay ChargesTop 100 ranked diagnoses with top 5 procedures ranked below[CCS category in brackets]1As a percent of As a percentdischarges w/ of all Percent Mean Median Mean MedianTotal2this diagnosis3discharges died4(S.E.)4(S.E.)4(S.E.)4(S.E.)D19. Asthma [128] 418,227 100.00 1.20 0.42 3.6 2.3 $6,366 $4,350Number of procedures with this diagnosis = 180 (0.03) (0.03) ( $108) ( $74)p1. No Procedure Listed [.] 333,222 79.67 0.96 0.11 3.2 2.1 $5,389 $4,141(0.03) (0.03) ( $92) ( $73)p2. Other respiratory therapy [217] 33,794 8.08 0.10 0.07 3.2 2.1 $4,972 $3,760(0.08) (0.07) ( $221) ( $171)p3. Respiratory intubation and mechanical ventilation [216] 9,001 2.15 0.03 8.97 7.7 5.1 $25,213 $16,467(0.21) (0.14) ( $1,071) ( $602)p4. Other therapeutic procedures [231] 8,609 2.06 0.02 0.33 3.6 2.5 $5,380 $3,953(0.16) (0.14) ( $359) ( $261)65p5. Arterial blood gases [205] 6,518 1.56 0.02 0.22 3.8 2.5 $6,040 $4,381(0.19) (0.17) ( $433) ( $593)D20. Osteoarthritis [203] 415,264 100.00 1.19 0.17 5.2 3.9 $19,423 $18,208Number of procedures with this diagnosis = 115 (0.09) (0.04) ( $235) ( $246)p1. Arthroplasty knee [152] 244,646 58.91 0.70 0.17 5.0 4.0 $20,650 $18,968(0.04) (0.04) ( $238) ( $262)p2. Hip replacement, total and partial [153] 116,889 28.15 0.34 0.15 5.0 4.0 $20,834 $19,354(0.05) (0.05) ( $278) ( $291)p3. No Procedure Listed [.] 26,040 6.27 0.07 0.13 9.3 7.4 $10,370 $7,642(0.66) (1.00) ( $1,183) ( $1,009)p4. Arthroplasty other than hip or knee [154] 9,529 2.29 0.03 0.11 2.8 2.1 $13,624 $13,048(0.06) (0.06) ( $307) ( $223)p5. Other OR therapeutic procedures on joints [162] 5,168 1.24 0.01 0.00 2.6 1.7 $9,534 $8,063(0.07) (0.06) ( $275) ( $270)Source: AHCPR, Center for Organization and Delivery Studies, Healthcare Cost and Utilization Project (<strong>HCUP</strong>).
Table 2The top 100 principal diagnoses and their associated principal procedures: <strong>HCUP</strong> Nationwide Inpatient Sample, 1996Number of discharges Length of stay ChargesTop 100 ranked diagnoses with top 5 procedures ranked below[CCS category in brackets]1As a percent of As a percentdischarges w/ of all Percent Mean Median Mean MedianTotal2this diagnosis3discharges died4(S.E.)4(S.E.)4(S.E.)4(S.E.)D21. Urinary tract infections [159] 404,458 100.00 1.16 1.66 5.0 3.4 $7,531 $5,345Number of procedures with this diagnosis = 202 (0.05) (0.03) ( $102) ( $62)p1. No Procedure Listed [.] 277,725 68.67 0.80 1.30 4.2 3.0 $5,747 $4,621(0.04) (0.02) ( $69) ( $55)p2. Other therapeutic procedures [231] 9,986 2.47 0.03 1.11 5.3 3.7 $6,838 $5,161(0.24) (0.19) ( $539) ( $351)p3. Endoscopy and endoscopic biopsy of the urinary tract [100] 9,380 2.32 0.03 0.48 6.0 4.5 $10,157 $8,113(0.13) (0.11) ( $334) ( $222)p4. Diagnostic ultrasound of urinary tract [195] 8,750 2.16 0.03 0.11 4.4 3.2 $6,693 $5,118(0.14) (0.11) ( $337) ( $196)66p5. Diagnostic spinal tap [4] 7,812 1.93 0.02 0.36 4.7 3.4 $7,470 $6,005(0.09) (0.10) ( $222) ( $226)D22. Diabetes mellitus with complications [50] 403,460 100.00 1.16 1.59 6.2 3.6 $11,030 $6,095Number of procedures with this diagnosis = 205 (0.07) (0.03) ( $197) ( $76)p1. No Procedure Listed [.] 226,233 56.07 0.65 0.73 4.0 2.7 $5,563 $4,239(0.06) (0.02) ( $79) ( $51)p2. Amputation of lower extremity [157] 38,736 9.60 0.11 2.45 11.4 7.9 $21,265 $14,441(0.22) (0.17) ( $458) ( $302)p3. Debridement of wound, infection or burn [169] 20,508 5.08 0.06 1.11 10.3 6.9 $16,790 $11,046(0.25) (0.14) ( $505) ( $279)p4. Other therapeutic procedures [231] 9,091 2.25 0.03 0.98 5.0 3.2 $7,556 $5,346(0.27) (0.21) ( $463) ( $341)p5. Peripheral vascular bypass [55] 8,762 2.17 0.03 3.15 12.8 8.8 $31,157 $23,545(0.42) (0.39) ( $1,073) ( $954)Source: AHCPR, Center for Organization and Delivery Studies, Healthcare Cost and Utilization Project (<strong>HCUP</strong>).
Table 2The top 100 principal diagnoses and their associated principal procedures: <strong>HCUP</strong> Nationwide Inpatient Sample, 1996Number of discharges Length of stay ChargesTop 100 ranked diagnoses with top 5 procedures ranked below[CCS category in brackets]1As a percent of As a percentdischarges w/ of all Percent Mean Median Mean MedianTotal2this diagnosis3discharges died4(S.E.)4(S.E.)4(S.E.)4(S.E.)D23. Other complications of birth, puerperium affecting management of 379,223 100.00 1.09 0.03 2.1 1.3 $4,518 $3,597mother [195]Number of procedures with this diagnosis = 131 (0.02) (0.02) ( $87) ( $72)p1. Other procedures to assist delivery [137] 114,857 30.29 0.33 0.00 1.7 1.1 $3,725 $3,259(0.02) (0.03) ( $81) ( $82)p2. Episiotomy [133] 59,548 15.70 0.17 0.00 1.8 1.3 $3,744 $3,362(0.02) (0.02) ( $84) ( $89)p3. Repair of current obstetric laceration [140] 50,321 13.27 0.14 0.01 1.7 1.1 $3,656 $3,231(0.02) (0.03) ( $73) ( $60)67p4. Forceps, vacuum, and breech delivery [135] 42,105 11.10 0.12 0.00 1.9 1.3 $4,070 $3,687(0.02) (0.02) ( $109) ( $110)p5. Cesarean section [134] 38,966 10.28 0.11 0.07 3.7 2.7 $7,729 $6,702(0.05) (0.02) ( $154) ( $134)D24. Fracture of neck of femur (hip) [226] 351,033 100.00 1.01 3.00 7.5 5.4 $16,747 $13,867Number of procedures with this diagnosis = 137 (0.10) (0.05) ( $198) ( $153)p1. Treatment, fracture or dislocation of hip and femur [146] 199,175 56.74 0.57 2.32 6.8 5.1 $15,796 $13,099(0.07) (0.05) ( $210) ( $150)p2. Hip replacement, total and partial [153] 109,271 31.13 0.31 2.95 7.3 5.6 $19,833 $17,019(0.07) (0.04) ( $227) ( $213)p3. No Procedure Listed [.] 29,416 8.38 0.08 4.04 10.1 6.4 $9,630 $6,496(0.62) (0.54) ( $605) ( $475)p4. Physical therapy exercises, manipulation, and other procedures 2,124 0.61 0.01 1.95 14.8 9.7 $12,882 $8,783[213](3.35) (1.38) ( $2,450) ( $1,501)p5. Traction, splints, and other wound care [214] 1,329 0.38 0.00 7.72 7.6 3.2 $10,533 $5,371(0.90) (0.29) ( $1,121) ( $376)Source: AHCPR, Center for Organization and Delivery Studies, Healthcare Cost and Utilization Project (<strong>HCUP</strong>).
Table 2The top 100 principal diagnoses and their associated principal procedures: <strong>HCUP</strong> Nationwide Inpatient Sample, 1996Number of discharges Length of stay ChargesTop 100 ranked diagnoses with top 5 procedures ranked below[CCS category in brackets]1As a percent of As a percentdischarges w/ of all Percent Mean Median Mean MedianTotal2this diagnosis3discharges died4(S.E.)4(S.E.)4(S.E.)4(S.E.)D25. Other complications of pregnancy [181] 341,656 100.00 0.98 0.04 2.3 1.4 $4,221 $3,208Number of procedures with this diagnosis = 166 (0.04) (0.02) ( $83) ( $57)p1. No Procedure Listed [.] 118,450 34.67 0.34 0.00 2.3 1.5 $3,238 $2,532(0.05) (0.04) ( $76) ( $64)p2. Other procedures to assist delivery [137] 73,717 21.58 0.21 0.01 1.8 1.1 $3,747 $3,180(0.03) (0.03) ( $83) ( $67)p3. Episiotomy [133] 47,671 13.95 0.14 0.00 1.8 1.3 $3,624 $3,228(0.03) (0.03) ( $71) ( $83)p4. Cesarean section [134] 17,146 5.02 0.05 0.46 3.6 2.5 $8,654 $6,356(0.07) (0.03) ( $427) ( $137)68p5. Repair of current obstetric laceration [140] 10,475 3.07 0.03 0.00 2.0 1.3 $3,986 $3,291(0.05) (0.04) ( $160) ( $123)D26. Rehabilitation care, fitting of prostheses, and adjustment of devices 335,978 100.00 0.96 0.97 15.0 11.9 $17,289 $12,626[254]Number of procedures with this diagnosis = 177 (0.30) (0.38) ( $589) ( $472)p1. No Procedure Listed [.] 178,191 53.04 0.51 0.86 13.4 10.6 $14,329 $11,017(0.31) (0.43) ( $518) ( $444)p2. Physical therapy exercises, manipulation, and other procedures 88,297 26.28 0.25 1.05 15.0 12.1 $18,146 $13,037[213](0.66) (0.66) ( $1,354) ( $1,448)p3. Other physical therapy and rehabilitation [215] 19,554 5.82 0.06 0.81 15.6 12.8 $18,176 $14,100(0.86) (0.81) ( $1,296) ( $1,225)p4. Diagnostic physical therapy [212] 3,743 1.11 0.01 1.26 18.8 14.7 $20,859 $16,392(1.24) (1.10) ( $1,407) ( $1,473)p5. Other non-OR therapeutic procedures on skin and breast [174] 3,672 1.09 0.01 1.13 19.7 15.8 $21,628 $17,029(0.69) (0.86) ( $1,131) ( $840)Source: AHCPR, Center for Organization and Delivery Studies, Healthcare Cost and Utilization Project (<strong>HCUP</strong>).
Table 2The top 100 principal diagnoses and their associated principal procedures: <strong>HCUP</strong> Nationwide Inpatient Sample, 1996Number of discharges Length of stay ChargesTop 100 ranked diagnoses with top 5 procedures ranked below[CCS category in brackets]1As a percent of As a percentdischarges w/ of all Percent Mean Median Mean MedianTotal2this diagnosis3discharges died4(S.E.)4(S.E.)4(S.E.)4(S.E.)D27. Complications of surgical procedures or medical care [238] 335,365 100.00 0.96 1.63 6.2 3.6 $13,266 $7,122Number of procedures with this diagnosis = 220 (0.05) (0.03) ( $299) ( $118)p1. No Procedure Listed [.] 100,369 29.93 0.29 0.63 4.1 2.8 $5,709 $4,221(0.04) (0.03) ( $94) ( $69)p2. Debridement of wound, infection or burn [169] 26,524 7.91 0.08 1.51 10.2 6.8 $20,499 $12,597(0.18) (0.12) ( $561) ( $290)p3. Other OR gastrointestinal therapeutic procedures [99] 11,910 3.55 0.03 1.86 8.3 5.2 $21,670 $11,094(0.22) (0.13) ( $1,975) ( $294)p4. Incision and drainage, skin and subcutaneous tissue [168] 9,828 2.93 0.03 0.48 5.6 3.8 $9,557 $6,964(0.12) (0.10) ( $267) ( $214)69p5. Incision of pleura, thoracentesis, chest drainage [39] 7,958 2.37 0.02 1.34 6.0 3.8 $10,674 $6,836(0.18) (0.10) ( $418) ( $209)D28. Skin and subcutaneous tissue infections [197] 325,223 100.00 0.93 0.58 5.4 3.6 $7,912 $5,261Number of procedures with this diagnosis = 194 (0.04) (0.03) ( $136) ( $69)p1. No Procedure Listed [.] 181,323 55.75 0.52 0.26 4.4 3.1 $5,475 $4,240(0.04) (0.03) ( $78) ( $54)p2. Incision and drainage, skin and subcutaneous tissue [168] 33,236 10.22 0.10 0.22 5.0 3.4 $8,241 $5,916(0.07) (0.05) ( $323) ( $149)p3. Debridement of wound, infection or burn [169] 26,604 8.18 0.08 0.92 8.5 5.9 $14,383 $9,654(0.14) (0.11) ( $343) ( $193)p4. Other therapeutic procedures [231] 11,856 3.65 0.03 0.24 5.1 3.4 $6,267 $4,602(0.18) (0.11) ( $370) ( $255)p5. Other non-OR therapeutic procedures on skin and breast [174] 9,724 2.99 0.03 0.51 5.7 3.8 $9,160 $6,275(0.15) (0.10) ( $266) ( $162)Source: AHCPR, Center for Organization and Delivery Studies, Healthcare Cost and Utilization Project (<strong>HCUP</strong>).
Table 2The top 100 principal diagnoses and their associated principal procedures: <strong>HCUP</strong> Nationwide Inpatient Sample, 1996Number of discharges Length of stay ChargesTop 100 ranked diagnoses with top 5 procedures ranked below[CCS category in brackets]1As a percent of As a percentdischarges w/ of all Percent Mean Median Mean MedianTotal2this diagnosis3discharges died4(S.E.)4(S.E.)4(S.E.)4(S.E.)D29. Gastrointestinal hemorrhage [153] 318,104 100.00 0.91 4.40 5.1 3.2 $10,956 $6,771Number of procedures with this diagnosis = 176 (0.04) (0.02) ( $154) ( $72)p1. Upper gastrointestinal endoscopy, biopsy [70] 152,464 47.93 0.44 1.85 4.5 3.1 $9,015 $6,893(0.04) (0.03) ( $124) ( $80)p2. No Procedure Listed [.] 51,525 16.20 0.15 6.91 3.5 2.2 $5,219 $3,909(0.06) (0.04) ( $84) ( $61)p3. Other non-OR upper GI therapeutic procedures [93] 31,557 9.92 0.09 3.30 4.8 3.3 $11,186 $8,423(0.07) (0.05) ( $224) ( $151)p4. Colonoscopy and biopsy [76] 20,330 6.39 0.06 1.19 4.9 3.4 $8,794 $6,702(0.08) (0.06) ( $166) ( $127)70p5. Blood transfusion [222] 19,295 6.07 0.06 5.75 4.4 3.0 $7,198 $5,500(0.09) (0.07) ( $169) ( $121)D30. Alcohol-related mental disorders [66] 277,610 100.00 0.80 0.09 6.0 3.2 $5,048 $3,427Number of procedures with this diagnosis = 134 (0.33) (0.11) ( $197) ( $106)p1. Alcohol and drug rehabilitation/detoxification [219] 195,485 70.42 0.56 0.02 6.3 3.6 $4,524 $3,301(0.35) (0.13) ( $202) ( $125)p2. No Procedure Listed [.] 64,642 23.29 0.19 0.09 4.9 2.0 $5,131 $3,381(0.97) (0.15) ( $477) ( $186)p3. Psychological and psychiatric evaluation and therapy [218] 3,055 1.10 0.01 0.16 6.2 3.9 $7,721 $5,897(0.44) (0.33) ( $523) ( $586)p4. Computerized axial tomography (CT) scan head [177] 3,006 1.08 0.01 0.00 4.3 2.6 $7,256 $5,174(0.21) (0.15) ( $456) ( $271)p5. Respiratory intubation and mechanical ventilation [216] 1,252 0.45 0.00 5.48 5.3 1.9 $17,428 $10,174(0.47) (0.27) ( $1,581) ( $878)Source: AHCPR, Center for Organization and Delivery Studies, Healthcare Cost and Utilization Project (<strong>HCUP</strong>).
Table 2The top 100 principal diagnoses and their associated principal procedures: <strong>HCUP</strong> Nationwide Inpatient Sample, 1996Number of discharges Length of stay ChargesTop 100 ranked diagnoses with top 5 procedures ranked below[CCS category in brackets]1As a percent of As a percentdischarges w/ of all Percent Mean Median Mean MedianTotal2this diagnosis3discharges died4(S.E.)4(S.E.)4(S.E.)4(S.E.)D31. Intestinal obstruction without hernia [145] 271,324 100.00 0.78 3.57 6.7 4.3 $13,296 $6,989Number of procedures with this diagnosis = 178 (0.04) (0.03) ( $184) ( $84)p1. No Procedure Listed [.] 132,670 48.90 0.38 2.14 3.9 2.8 $5,619 $4,349(0.03) (0.02) ( $68) ( $50)p2. Excision, lysis peritoneal adhesions [90] 33,587 12.38 0.10 3.50 11.1 8.8 $24,969 $18,024(0.10) (0.08) ( $496) ( $320)p3. Small bowel resection [75] 12,376 4.56 0.04 7.02 14.0 10.6 $37,105 $26,726(0.25) (0.16) ( $906) ( $583)p4. Colonoscopy and biopsy [76] 12,237 4.51 0.04 2.38 6.8 5.0 $10,860 $8,201(0.12) (0.09) ( $273) ( $179)71p5. Nasogastric tube [221] 11,662 4.30 0.03 2.13 4.6 3.2 $6,509 $4,860(0.13) (0.08) ( $193) ( $150)D32. Fracture of lower limb [230] 270,698 100.00 0.78 0.50 5.0 2.8 $13,362 $8,758Number of procedures with this diagnosis = 133 (0.08) (0.03) ( $376) ( $132)p1. Treatment, fracture or dislocation of lower extremity (other than hip 163,960 60.57 0.47 0.14 3.8 2.4 $11,265 $8,334or femur) [147](0.06) (0.03) ( $302) ( $125)p2. Treatment, fracture or dislocation of hip and femur [146] 40,388 14.92 0.12 1.10 7.6 5.3 $22,226 $16,166(0.12) (0.07) ( $705) ( $263)p3. No Procedure Listed [.] 25,347 9.36 0.07 0.98 5.6 2.6 $7,307 $3,895(0.44) (0.10) ( $1,064) ( $148)p4. Traction, splints, and other wound care [214] 11,862 4.38 0.03 0.42 6.1 2.6 $7,049 $4,154(0.23) (0.08) ( $287) ( $129)p5. Debridement of wound, infection or burn [169] 5,769 2.13 0.02 0.25 8.6 5.1 $27,649 $17,854(0.34) (0.20) ( $1,153) ( $1,081)Source: AHCPR, Center for Organization and Delivery Studies, Healthcare Cost and Utilization Project (<strong>HCUP</strong>).
Table 2The top 100 principal diagnoses and their associated principal procedures: <strong>HCUP</strong> Nationwide Inpatient Sample, 1996Number of discharges Length of stay ChargesTop 100 ranked diagnoses with top 5 procedures ranked below[CCS category in brackets]1As a percent of As a percentdischarges w/ of all Percent Mean Median Mean MedianTotal2this diagnosis3discharges died4(S.E.)4(S.E.)4(S.E.)4(S.E.)D33. Early or threatened labor [184] 269,756 100.00 0.77 0.01 3.0 1.4 $5,156 $3,442Number of procedures with this diagnosis = 80 (0.08) (0.03) ( $170) ( $83)p1. No Procedure Listed [.] 96,146 35.64 0.28 0.00 2.1 0.9 $3,323 $2,209(0.08) (0.05) ( $112) ( $87)p2. Other procedures to assist delivery [137] 56,675 21.01 0.16 0.00 2.7 1.4 $5,114 $3,720(0.05) (0.02) ( $139) ( $75)p3. Cesarean section [134] 26,163 9.70 0.08 0.03 6.4 3.4 $11,634 $8,173(0.21) (0.05) ( $443) ( $195)p4. Episiotomy [133] 23,689 8.78 0.07 0.00 2.8 1.5 $4,927 $3,681(0.09) (0.02) ( $140) ( $78)72p5. Fetal monitoring [139] 17,244 6.39 0.05 0.00 2.7 1.2 $3,635 $2,487(0.23) (0.13) ( $202) ( $142)D34. Previous C-section [189] 268,295 100.00 0.77 0.00 2.5 2.0 $5,519 $5,122Number of procedures with this diagnosis = 37 (0.02) (0.02) ( $78) ( $86)p1. Cesarean section [134] 186,965 69.69 0.54 0.00 2.9 2.3 $6,219 $5,828(0.02) (0.02) ( $89) ( $104)p2. Other procedures to assist delivery [137] 25,902 9.65 0.07 0.00 1.6 1.1 $3,730 $3,392(0.02) (0.03) ( $67) ( $64)p3. Episiotomy [133] 24,538 9.15 0.07 0.00 1.7 1.2 $3,713 $3,432(0.02) (0.03) ( $73) ( $85)p4. Forceps, vacuum, and breech delivery [135] 10,634 3.96 0.03 0.00 1.8 1.3 $4,141 $3,831(0.02) (0.03) ( $106) ( $117)p5. Repair of current obstetric laceration [140] 10,341 3.85 0.03 0.00 1.7 1.1 $3,780 $3,439(0.02) (0.04) ( $83) ( $72)Source: AHCPR, Center for Organization and Delivery Studies, Healthcare Cost and Utilization Project (<strong>HCUP</strong>).
Table 2The top 100 principal diagnoses and their associated principal procedures: <strong>HCUP</strong> Nationwide Inpatient Sample, 1996Number of discharges Length of stay ChargesTop 100 ranked diagnoses with top 5 procedures ranked below[CCS category in brackets]1As a percent of As a percentdischarges w/ of all Percent Mean Median Mean MedianTotal2this diagnosis3discharges died4(S.E.)4(S.E.)4(S.E.)4(S.E.)D35. Umbilical cord complication [192] 267,188 100.00 0.77 0.00 1.7 1.1 $3,570 $3,205Number of procedures with this diagnosis = 33 (0.01) (0.02) ( $54) ( $51)p1. Other procedures to assist delivery [137] 105,228 39.38 0.30 0.00 1.6 1.0 $3,303 $3,042(0.01) (0.02) ( $57) ( $59)p2. Episiotomy [133] 90,913 34.03 0.26 0.00 1.7 1.1 $3,485 $3,195(0.02) (0.03) ( $72) ( $70)p3. Repair of current obstetric laceration [140] 18,356 6.87 0.05 0.00 1.6 1.0 $3,384 $3,119(0.02) (0.03) ( $69) ( $79)p4. Forceps, vacuum, and breech delivery [135] 17,346 6.49 0.05 0.00 1.7 1.2 $3,776 $3,473(0.02) (0.03) ( $72) ( $70)73p5. Artificial rupture of membranes to assist delivery [136] 8,968 3.36 0.03 0.00 1.5 0.9 $3,242 $2,947(0.03) (0.05) ( $111) ( $141)D36. Secondary malignancies [42] 264,022 100.00 0.76 13.77 7.9 5.3 $16,790 $10,809Number of procedures with this diagnosis = 190 (0.08) (0.05) ( $344) ( $180)p1. No Procedure Listed [.] 64,577 24.46 0.19 23.74 5.3 3.5 $7,524 $5,555(0.08) (0.05) ( $136) ( $91)p2. Incision of pleura, thoracentesis, chest drainage [39] 20,731 7.85 0.06 13.85 7.7 5.6 $13,358 $9,513(0.12) (0.11) ( $305) ( $226)p3. Therapeutic radiology [211] 18,812 7.13 0.05 7.70 8.9 6.2 $13,696 $10,236(0.21) (0.14) ( $387) ( $244)p4. Other therapeutic procedures, hemic and lymphatic system [67] 10,713 4.06 0.03 1.99 5.0 3.1 $14,769 $11,063(0.12) (0.10) ( $616) ( $301)p5. Cancer chemotherapy [224] 7,756 2.94 0.02 7.12 7.5 4.8 $17,230 $11,574(0.33) (0.41) ( $1,066) ( $1,075)Source: AHCPR, Center for Organization and Delivery Studies, Healthcare Cost and Utilization Project (<strong>HCUP</strong>).
Table 2The top 100 principal diagnoses and their associated principal procedures: <strong>HCUP</strong> Nationwide Inpatient Sample, 1996Number of discharges Length of stay ChargesTop 100 ranked diagnoses with top 5 procedures ranked below[CCS category in brackets]1As a percent of As a percentdischarges w/ of all Percent Mean Median Mean MedianTotal2this diagnosis3discharges died4(S.E.)4(S.E.)4(S.E.)4(S.E.)D37. Maintenance chemotherapy, radiotherapy [45] 258,600 100.00 0.74 0.76 3.8 2.4 $10,460 $6,724Number of procedures with this diagnosis = 139 (0.10) (0.09) ( $587) ( $215)p1. Cancer chemotherapy [224] 214,781 83.06 0.62 0.46 3.5 2.2 $9,595 $6,484(0.11) (0.09) ( $660) ( $221)p2. Therapeutic radiology [211] 13,775 5.33 0.04 2.08 4.3 2.6 $8,490 $5,989(0.17) (0.22) ( $405) ( $284)p3. No Procedure Listed [.] 8,680 3.36 0.02 0.71 3.6 2.3 $7,894 $6,254(0.15) (0.19) ( $347) ( $327)p4. Other non-OR therapeutic procedures on skin and breast [174] 7,983 3.09 0.02 1.57 5.6 3.5 $17,161 $11,997(0.23) (0.11) ( $755) ( $439)74p5. Other vascular catheterization, not heart [54] 4,233 1.64 0.01 2.93 7.1 3.9 $21,407 $13,362(0.43) (0.15) ( $1,141) ( $806)D38. Schizophrenia and related disorders [70] 248,833 100.00 0.71 0.05 13.0 8.6 $11,048 $7,528Number of procedures with this diagnosis = 149 (0.48) (0.26) ( $520) ( $229)p1. No Procedure Listed [.] 197,844 79.51 0.57 0.03 12.0 7.9 $10,185 $7,064(0.47) (0.30) ( $517) ( $252)p2. Psychological and psychiatric evaluation and therapy [218] 29,354 11.80 0.08 0.12 16.9 12.5 $14,177 $9,989(0.85) (0.79) ( $980) ( $644)p3. Other physical therapy and rehabilitation [215] 6,044 2.43 0.02 0.00 17.1 12.7 $11,411 $8,266(0.82) (0.53) ( $1,098) ( $955)p4. Alcohol and drug rehabilitation/detoxification [219] 2,907 1.17 0.01 0.00 9.0 7.3 $8,482 $6,788(0.53) (0.58) ( $887) ( $802)p5. Computerized axial tomography (CT) scan head [177] 2,053 0.83 0.01 0.00 18.7 12.9 $16,616 $11,010(1.68) (0.91) ( $1,578) ( $645)Source: AHCPR, Center for Organization and Delivery Studies, Healthcare Cost and Utilization Project (<strong>HCUP</strong>).
Table 2The top 100 principal diagnoses and their associated principal procedures: <strong>HCUP</strong> Nationwide Inpatient Sample, 1996Number of discharges Length of stay ChargesTop 100 ranked diagnoses with top 5 procedures ranked below[CCS category in brackets]1As a percent of As a percentdischarges w/ of all Percent Mean Median Mean MedianTotal2this diagnosis3discharges died4(S.E.)4(S.E.)4(S.E.)4(S.E.)D39. Hypertension with complications and secondary hypertension [99] 241,745 100.00 0.69 3.46 5.9 3.8 $13,064 $7,838Number of procedures with this diagnosis = 197 (0.07) (0.04) ( $320) ( $110)p1. No Procedure Listed [.] 116,841 48.33 0.34 2.50 4.6 3.2 $7,478 $5,948(0.06) (0.04) ( $125) ( $88)p2. Hemodialysis [58] 22,200 9.18 0.06 2.91 4.5 2.6 $9,570 $6,908(0.12) (0.08) ( $256) ( $201)p3. Creation, revision and removal of arteriovenous fistula or vessel-to- 13,058 5.40 0.04 1.53 7.9 5.4 $20,413 $15,557vessel cannula for dialysis [57](0.26) (0.22) ( $544) ( $426)75p4. Diagnostic cardiac catheterization, coronary arteriography [47] 10,592 4.38 0.03 0.38 5.4 3.9 $14,540 $12,155(0.15) (0.11) ( $366) ( $306)p5. Diagnostic ultrasound of heart (echocardiogram) [193] 7,719 3.19 0.02 1.32 5.3 3.6 $10,219 $8,051(0.23) (0.13) ( $439) ( $294)D40. Substance-related mental disorders [67] 235,490 100.00 0.68 0.05 5.1 3.0 $4,142 $3,011Number of procedures with this diagnosis = 138 (0.36) (0.26) ( $222) ( $127)p1. Alcohol and drug rehabilitation/detoxification [219] 152,356 64.70 0.44 0.01 5.4 3.6 $3,779 $2,968(0.25) (0.20) ( $194) ( $169)p2. No Procedure Listed [.] 69,709 29.60 0.20 0.06 4.0 2.1 $3,971 $2,943(0.70) (0.18) ( $453) ( $179)p3. Psychological and psychiatric evaluation and therapy [218] 5,366 2.28 0.02 0.00 9.4 5.5 $8,936 $5,959(1.45) (1.01) ( $1,320) ( $1,098)p4. Computerized axial tomography (CT) scan head [177] 1,306 0.55 0.00 0.38 5.6 3.3 $7,692 $6,320(0.43) (0.26) ( $487) ( $466)p5. Diagnostic spinal tap [4] 790 0.34 0.00 1.92 6.4 3.6 $12,815 $9,155(0.60) (0.47) ( $1,270) ( $890)Source: AHCPR, Center for Organization and Delivery Studies, Healthcare Cost and Utilization Project (<strong>HCUP</strong>).
Table 2The top 100 principal diagnoses and their associated principal procedures: <strong>HCUP</strong> Nationwide Inpatient Sample, 1996Number of discharges Length of stay ChargesTop 100 ranked diagnoses with top 5 procedures ranked below[CCS category in brackets]1As a percent of As a percentdischarges w/ of all Percent Mean Median Mean MedianTotal2this diagnosis3discharges died4(S.E.)4(S.E.)4(S.E.)4(S.E.)D41. Diverticulosis and diverticulitis [146] 227,673 100.00 0.65 1.40 6.1 4.1 $12,860 $7,656Number of procedures with this diagnosis = 156 (0.04) (0.03) ( $168) ( $87)p1. No Procedure Listed [.] 80,330 35.28 0.23 0.53 4.1 3.1 $6,335 $5,373(0.03) (0.03) ( $81) ( $70)p2. Colorectal resection [78] 48,789 21.43 0.14 3.22 10.7 8.0 $27,687 $20,025(0.10) (0.06) ( $434) ( $300)p3. Colonoscopy and biopsy [76] 42,649 18.73 0.12 0.38 4.6 3.3 $8,175 $6,421(0.05) (0.04) ( $121) ( $96)p4. Upper gastrointestinal endoscopy, biopsy [70] 14,376 6.31 0.04 0.86 5.0 3.7 $9,380 $7,730(0.07) (0.06) ( $153) ( $140)76p5. CT scan abdomen [179] 8,648 3.80 0.02 0.67 4.8 3.7 $7,426 $6,103(0.08) (0.07) ( $242) ( $221)D42. Benign neoplasm of uterus [46] 222,123 100.00 0.64 0.02 3.0 2.4 $8,550 $7,743Number of procedures with this diagnosis = 65 (0.02) (0.02) ( $120) ( $127)p1. Hysterectomy, abdominal and vaginal [124] 190,237 85.64 0.55 0.02 3.0 2.4 $8,649 $7,798(0.02) (0.02) ( $121) ( $126)p2. Other excision of cervix and uterus [125] 24,631 11.09 0.07 0.02 2.9 2.3 $8,322 $7,736(0.04) (0.04) ( $165) ( $192)p3. No Procedure Listed [.] 2,291 1.03 0.01 0.00 2.0 1.3 $4,896 $3,585(0.09) (0.12) ( $599) ( $440)p4. Diagnostic dilatation and curettage (D&C) [128] 1,354 0.61 0.00 0.00 2.5 1.5 $6,524 $5,785(0.18) (0.15) ( $330) ( $337)p5. Oophorectomy, unilateral and bilateral [119] 722 0.33 0.00 0.00 3.4 2.6 $10,039 $9,428(0.17) (0.18) ( $421) ( $587)Source: AHCPR, Center for Organization and Delivery Studies, Healthcare Cost and Utilization Project (<strong>HCUP</strong>).
Table 2The top 100 principal diagnoses and their associated principal procedures: <strong>HCUP</strong> Nationwide Inpatient Sample, 1996Number of discharges Length of stay ChargesTop 100 ranked diagnoses with top 5 procedures ranked below[CCS category in brackets]1As a percent of As a percentdischarges w/ of all Percent Mean Median Mean MedianTotal2this diagnosis3discharges died4(S.E.)4(S.E.)4(S.E.)4(S.E.)D43. Appendicitis and other appendiceal conditions [142] 218,668 100.00 0.63 0.21 3.7 2.1 $9,995 $7,516Number of procedures with this diagnosis = 62 (0.03) (0.03) ( $143) ( $104)p1. Appendectomy [80] 206,465 94.42 0.59 0.13 3.5 2.0 $9,506 $7,405(0.03) (0.03) ( $136) ( $105)p2. No Procedure Listed [.] 3,302 1.51 0.01 0.29 2.7 1.2 $5,389 $3,674(0.15) (0.15) ( $351) ( $352)p3. Colorectal resection [78] 2,839 1.30 0.01 3.58 10.1 7.4 $26,658 $18,731(0.35) (0.24) ( $1,256) ( $869)p4. Excision, lysis peritoneal adhesions [90] 1,623 0.74 0.00 0.30 7.9 4.6 $24,060 $14,973(0.51) (0.57) ( $1,976) ( $793)77p5. Other OR lower GI therapeutic procedures [96] 1,231 0.56 0.00 1.82 8.7 6.8 $20,581 $13,520(0.39) (0.34) ( $1,539) ( $836)D44. Epilepsy, convulsions [83] 217,431 100.00 0.62 1.13 4.0 2.2 $7,709 $4,932Number of procedures with this diagnosis = 183 (0.05) (0.03) ( $134) ( $69)p1. No Procedure Listed [.] 136,147 62.62 0.39 0.64 3.2 1.9 $5,486 $4,269(0.04) (0.02) ( $81) ( $64)p2. Computerized axial tomography (CT) scan head [177] 17,715 8.15 0.05 0.72 4.0 2.3 $6,494 $4,702(0.13) (0.08) ( $237) ( $171)p3. Diagnostic spinal tap [4] 14,249 6.55 0.04 0.89 3.8 2.1 $8,501 $5,624(0.10) (0.06) ( $294) ( $149)p4. Respiratory intubation and mechanical ventilation [216] 7,723 3.55 0.02 7.17 6.5 3.9 $19,213 $13,232(0.21) (0.15) ( $632) ( $458)p5. Electroencephalogram (EEG) [199] 6,168 2.84 0.02 0.27 3.8 2.2 $7,050 $4,924(0.12) (0.10) ( $438) ( $262)Source: AHCPR, Center for Organization and Delivery Studies, Healthcare Cost and Utilization Project (<strong>HCUP</strong>).
Table 2The top 100 principal diagnoses and their associated principal procedures: <strong>HCUP</strong> Nationwide Inpatient Sample, 1996Number of discharges Length of stay ChargesTop 100 ranked diagnoses with top 5 procedures ranked below[CCS category in brackets]1As a percent of As a percentdischarges w/ of all Percent Mean Median Mean MedianTotal2this diagnosis3discharges died4(S.E.)4(S.E.)4(S.E.)4(S.E.)D45. Polyhydramnios and other problems of amniotic cavity [191] 206,989 100.00 0.59 0.00 2.8 1.7 $5,365 $4,169Number of procedures with this diagnosis = 52 (0.03) (0.02) ( $124) ( $105)p1. Other procedures to assist delivery [137] 70,224 33.93 0.20 0.00 2.5 1.5 $4,809 $3,906(0.04) (0.02) ( $125) ( $126)p2. Episiotomy [133] 42,850 20.70 0.12 0.00 2.3 1.5 $4,324 $3,717(0.04) (0.02) ( $105) ( $97)p3. Cesarean section [134] 30,589 14.78 0.09 0.01 4.8 3.1 $9,314 $7,526(0.11) (0.04) ( $260) ( $164)p4. Repair of current obstetric laceration [140] 20,253 9.78 0.06 0.00 2.4 1.5 $4,342 $3,655(0.06) (0.02) ( $121) ( $111)78p5. Forceps, vacuum, and breech delivery [135] 18,842 9.10 0.05 0.00 2.4 1.6 $4,940 $4,317(0.04) (0.02) ( $159) ( $179)D46. Acute bronchitis [125] 203,700 100.00 0.58 0.20 3.6 2.4 $5,781 $4,129Number of procedures with this diagnosis = 143 (0.03) (0.03) ( $112) ( $117)p1. No Procedure Listed [.] 172,644 84.75 0.50 0.12 3.3 2.3 $5,007 $3,923(0.03) (0.03) ( $119) ( $123)p2. Other respiratory therapy [217] 9,089 4.46 0.03 0.16 3.4 2.5 $5,225 $4,066(0.09) (0.10) ( $280) ( $285)p3. Diagnostic spinal tap [4] 3,503 1.72 0.01 0.00 3.8 2.7 $7,709 $5,770(0.12) (0.06) ( $350) ( $262)p4. Other therapeutic procedures [231] 2,550 1.25 0.01 0.00 4.4 3.0 $6,325 $4,230(0.19) (0.13) ( $652) ( $466)p5. Diagnostic bronchoscopy and biopsy of bronchus [37] 1,751 0.86 0.01 1.45 5.9 4.6 $12,089 $9,636(0.23) (0.21) ( $607) ( $517)Source: AHCPR, Center for Organization and Delivery Studies, Healthcare Cost and Utilization Project (<strong>HCUP</strong>).
Table 2The top 100 principal diagnoses and their associated principal procedures: <strong>HCUP</strong> Nationwide Inpatient Sample, 1996Number of discharges Length of stay ChargesTop 100 ranked diagnoses with top 5 procedures ranked below[CCS category in brackets]1As a percent of As a percentdischarges w/ of all Percent Mean Median Mean MedianTotal2this diagnosis3discharges died4(S.E.)4(S.E.)4(S.E.)4(S.E.)D47. Respiratory failure, insufficiency, arrest (adult) [131] 202,314 100.00 0.58 23.30 10.3 6.1 $29,780 $14,905Number of procedures with this diagnosis = 182 (0.55) (0.08) ( $1,538) ( $318)p1. Respiratory intubation and mechanical ventilation [216] 87,134 43.07 0.25 27.94 10.6 7.2 $34,607 $22,909(0.43) (0.09) ( $1,196) ( $377)p2. No Procedure Listed [.] 74,194 36.67 0.21 18.01 6.2 4.4 $11,756 $8,281(0.32) (0.06) ( $867) ( $173)p3. Tracheostomy, temporary and permanent [34] 8,017 3.96 0.02 26.95 35.7 27.0 $126,705 $99,903(1.01) (0.84) ( $3,671) ( $3,194)p4. Diagnostic bronchoscopy and biopsy of bronchus [37] 3,932 1.94 0.01 20.48 13.0 8.9 $35,334 $23,100(0.84) (0.45) ( $2,252) ( $1,116)79p5. Other vascular catheterization, not heart [54] 2,803 1.39 0.01 35.27 16.5 9.0 $45,867 $22,901(3.66) (1.21) ($10,074) ( $3,923)D48. Pancreatic disorders (not diabetes) [152] 198,187 100.00 0.57 1.79 6.7 4.1 $14,779 $7,809Number of procedures with this diagnosis = 168 (0.07) (0.03) ( $362) ( $107)p1. No Procedure Listed [.] 94,434 47.65 0.27 0.74 4.3 3.1 $6,882 $5,327(0.03) (0.03) ( $97) ( $72)p2. Cholecystectomy and common duct exploration [84] 18,687 9.43 0.05 0.94 8.3 5.8 $22,620 $16,665(0.16) (0.09) ( $541) ( $328)p3. Upper gastrointestinal endoscopy, biopsy [70] 12,992 6.56 0.04 0.87 6.8 4.9 $13,213 $9,583(0.12) (0.08) ( $339) ( $204)p4. Endoscopic retrograde cannulation of pancreas (ERCP) [82] 10,788 5.44 0.03 0.80 7.3 5.2 $14,983 $10,789(0.16) (0.10) ( $449) ( $273)p5. Other non-OR gastrointestinal therapeutic procedures [98] 7,804 3.94 0.02 0.81 7.0 4.7 $15,495 $11,086(0.20) (0.14) ( $693) ( $404)Source: AHCPR, Center for Organization and Delivery Studies, Healthcare Cost and Utilization Project (<strong>HCUP</strong>).
Table 2The top 100 principal diagnoses and their associated principal procedures: <strong>HCUP</strong> Nationwide Inpatient Sample, 1996Number of discharges Length of stay ChargesTop 100 ranked diagnoses with top 5 procedures ranked below[CCS category in brackets]1As a percent of As a percentdischarges w/ of all Percent Mean Median Mean MedianTotal2this diagnosis3discharges died4(S.E.)4(S.E.)4(S.E.)4(S.E.)D49. Transient cerebral ischemia [112] 195,864 100.00 0.56 0.22 3.8 2.5 $6,657 $5,359Number of procedures with this diagnosis = 170 (0.04) (0.03) ( $81) ( $67)p1. No Procedure Listed [.] 133,174 67.99 0.38 0.14 3.4 2.3 $5,806 $5,032(0.04) (0.03) ( $76) ( $66)p2. Computerized axial tomography (CT) scan head [177] 23,724 12.11 0.07 0.13 3.8 2.5 $5,579 $4,610(0.12) (0.09) ( $150) ( $153)p3. Diagnostic ultrasound of heart (echocardiogram) [193] 5,872 3.00 0.02 0.00 4.1 3.0 $7,852 $7,006(0.10) (0.10) ( $201) ( $235)p4. Diagnostic ultrasound of head and neck [192] 4,408 2.25 0.01 0.00 3.4 2.3 $6,280 $5,335(0.13) (0.13) ( $359) ( $299)80p5. Magnetic resonance imaging [198] 4,274 2.18 0.01 0.12 4.1 2.9 $7,926 $7,118(0.14) (0.14) ( $251) ( $242)D50. Syncope [245] 189,193 100.00 0.54 0.27 3.2 1.9 $6,244 $4,841Number of procedures with this diagnosis = 174 (0.05) (0.02) ( $101) ( $76)p1. No Procedure Listed [.] 127,769 67.53 0.37 0.14 2.7 1.7 $5,174 $4,347(0.03) (0.02) ( $89) ( $79)p2. Computerized axial tomography (CT) scan head [177] 11,184 5.91 0.03 0.16 3.8 2.4 $5,962 $4,869(0.18) (0.13) ( $252) ( $232)p3. Diagnostic ultrasound of heart (echocardiogram) [193] 5,652 2.99 0.02 0.11 3.6 2.2 $6,549 $5,329(0.19) (0.13) ( $286) ( $221)p4. Other diagnostic cardiovascular procedures [62] 4,907 2.59 0.01 0.25 3.8 2.7 $10,952 $9,670(0.15) (0.16) ( $491) ( $553)p5. Other diagnostic procedures (interview, evaluation, consultation) 3,902 2.06 0.01 0.13 3.4 2.3 $6,673 $5,856[227](0.10) (0.10) ( $202) ( $190)Source: AHCPR, Center for Organization and Delivery Studies, Healthcare Cost and Utilization Project (<strong>HCUP</strong>).
Table 2The top 100 principal diagnoses and their associated principal procedures: <strong>HCUP</strong> Nationwide Inpatient Sample, 1996Number of discharges Length of stay ChargesTop 100 ranked diagnoses with top 5 procedures ranked below[CCS category in brackets]1As a percent of As a percentdischarges w/ of all Percent Mean Median Mean MedianTotal2this diagnosis3discharges died4(S.E.)4(S.E.)4(S.E.)4(S.E.)D51. Phlebitis, thrombophlebitis and thromboembolism [118] 188,566 100.00 0.54 1.15 6.2 4.9 $8,533 $5,815Number of procedures with this diagnosis = 182 (0.04) (0.02) ( $126) ( $71)p1. No Procedure Listed [.] 127,008 67.35 0.36 0.57 5.6 4.7 $6,175 $5,097(0.03) (0.02) ( $77) ( $63)p2. Other diagnostic ultrasound [197] 12,444 6.60 0.04 0.57 6.0 4.8 $7,795 $5,818(0.13) (0.08) ( $389) ( $241)p3. Other OR procedures on vessels other than head and neck [61] 12,134 6.44 0.03 2.91 8.1 6.1 $19,540 $14,108(0.16) (0.12) ( $479) ( $323)p4. Other therapeutic procedures [231] 7,698 4.08 0.02 0.69 6.5 5.1 $9,465 $6,418(0.19) (0.13) ( $388) ( $277)81p5. Arterio- or venogram (not heart and head) [191] 5,166 2.74 0.01 0.49 6.0 4.9 $10,062 $5,928(0.13) (0.12) ( $610) ( $312)D52. Calculus of urinary tract [160] 187,441 100.00 0.54 0.09 2.4 1.3 $6,155 $4,409Number of procedures with this diagnosis = 122 (0.02) (0.02) ( $114) ( $83)p1. No Procedure Listed [.] 64,548 34.44 0.19 0.05 1.6 0.8 $2,687 $2,195(0.02) (0.01) ( $37) ( $31)p2. Transurethral excision, drainage, or removal urinary obstruction 40,267 21.48 0.12 0.07 2.5 1.5 $7,813 $6,646[101](0.04) (0.02) ( $139) ( $112)p3. Ureteral catheterization [102] 17,301 9.23 0.05 0.10 2.5 1.5 $7,396 $6,326(0.04) (0.03) ( $145) ( $116)p4. Intravenous pyelogram [187] 15,144 8.08 0.04 0.04 1.6 0.8 $2,867 $2,324(0.04) (0.02) ( $73) ( $66)p5. Endoscopy and endoscopic biopsy of the urinary tract [100] 12,968 6.92 0.04 0.00 2.8 1.7 $7,027 $5,871(0.05) (0.05) ( $167) ( $175)Source: AHCPR, Center for Organization and Delivery Studies, Healthcare Cost and Utilization Project (<strong>HCUP</strong>).
Table 2The top 100 principal diagnoses and their associated principal procedures: <strong>HCUP</strong> Nationwide Inpatient Sample, 1996Number of discharges Length of stay ChargesTop 100 ranked diagnoses with top 5 procedures ranked below[CCS category in brackets]1As a percent of As a percentdischarges w/ of all Percent Mean Median Mean MedianTotal2this diagnosis3discharges died4(S.E.)4(S.E.)4(S.E.)4(S.E.)D53. Hypertension complicating pregnancy, childbirth and the puerperium 174,242 100.00 0.50 0.05 3.2 2.0 $6,272 $4,836[183]Number of procedures with this diagnosis = 72 (0.03) (0.02) ( $124) ( $94)p1. Other procedures to assist delivery [137] 44,582 25.59 0.13 0.04 2.6 1.7 $5,234 $4,361(0.03) (0.02) ( $125) ( $103)p2. Cesarean section [134] 38,929 22.34 0.11 0.10 5.2 3.7 $10,896 $8,911(0.08) (0.03) ( $240) ( $167)p3. Episiotomy [133] 26,707 15.33 0.08 0.02 2.6 1.8 $5,066 $4,338(0.04) (0.03) ( $112) ( $105)82p4. No Procedure Listed [.] 23,046 13.23 0.07 0.02 2.2 1.3 $2,986 $2,239(0.04) (0.03) ( $66) ( $54)p5. Forceps, vacuum, and breech delivery [135] 15,469 8.88 0.04 0.04 2.8 1.9 $5,895 $4,903(0.04) (0.04) ( $191) ( $148)D54. Aspiration pneumonitis, food/vomitus [129] 173,114 100.00 0.50 19.64 9.4 6.6 $19,155 $11,909Number of procedures with this diagnosis = 168 (0.11) (0.06) ( $363) ( $194)p1. No Procedure Listed [.] 89,352 51.61 0.26 18.50 6.7 5.1 $11,045 $8,657(0.07) (0.05) ( $189) ( $139)p2. Respiratory intubation and mechanical ventilation [216] 14,835 8.57 0.04 43.37 11.8 8.4 $38,542 $27,762(0.32) (0.23) ( $1,034) ( $812)p3. Gastrostomy, temporary and permanent [71] 13,320 7.69 0.04 10.05 13.0 10.2 $22,725 $17,989(0.28) (0.14) ( $483) ( $369)p4. Upper gastrointestinal endoscopy, biopsy [70] 6,488 3.75 0.02 11.36 11.7 8.8 $22,518 $16,693(0.39) (0.28) ( $1,063) ( $564)p5. Diagnostic bronchoscopy and biopsy of bronchus [37] 5,360 3.10 0.02 15.15 12.3 9.8 $27,320 $21,345(0.31) (0.33) ( $935) ( $820)Source: AHCPR, Center for Organization and Delivery Studies, Healthcare Cost and Utilization Project (<strong>HCUP</strong>).
Table 2The top 100 principal diagnoses and their associated principal procedures: <strong>HCUP</strong> Nationwide Inpatient Sample, 1996Number of discharges Length of stay ChargesTop 100 ranked diagnoses with top 5 procedures ranked below[CCS category in brackets]1As a percent of As a percentdischarges w/ of all Percent Mean Median Mean MedianTotal2this diagnosis3discharges died4(S.E.)4(S.E.)4(S.E.)4(S.E.)D55. Occlusion or stenosis of precerebral arteries [110] 167,750 100.00 0.48 0.52 3.4 1.9 $12,291 $10,139Number of procedures with this diagnosis = 118 (0.04) (0.02) ( $223) ( $183)p1. Endarterectomy, vessel of head and neck [51] 137,048 81.70 0.39 0.43 3.2 1.8 $12,594 $10,639(0.05) (0.03) ( $220) ( $192)p2. No Procedure Listed [.] 12,204 7.28 0.04 0.39 3.9 2.6 $7,229 $6,007(0.13) (0.07) ( $278) ( $125)p3. Cerebral arteriogram [188] 6,238 3.72 0.02 0.23 3.7 2.2 $9,531 $8,034(0.14) (0.18) ( $249) ( $239)p4. Other OR procedures on vessels other than head and neck [61] 2,630 1.57 0.01 1.28 3.4 1.8 $16,750 $12,886(0.22) (0.13) ( $944) ( $1,122)83p5. Computerized axial tomography (CT) scan head [177] 1,580 0.94 0.00 0.70 4.5 3.2 $7,098 $5,710(0.24) (0.23) ( $433) ( $390)D56. Intracranial injury [233] 167,331 100.00 0.48 7.43 6.9 2.3 $22,787 $8,257Number of procedures with this diagnosis = 171 (0.30) (0.08) ( $1,250) ( $294)p1. No Procedure Listed [.] 64,021 38.26 0.18 2.53 4.8 1.5 $10,437 $5,046(0.70) (0.07) ( $1,937) ( $222)p2. Computerized axial tomography (CT) scan head [177] 20,138 12.03 0.06 2.42 3.1 1.2 $8,694 $4,966(0.17) (0.15) ( $1,048) ( $583)p3. Suture of skin and subcutaneous tissue [171] 16,499 9.86 0.05 1.63 3.1 1.5 $8,595 $5,960(0.10) (0.07) ( $343) ( $271)p4. Incision and excision of CNS [1] 15,450 9.23 0.04 15.68 11.3 7.2 $42,084 $26,971(0.29) (0.18) ( $2,079) ( $1,013)p5. Respiratory intubation and mechanical ventilation [216] 9,264 5.54 0.03 36.21 6.1 2.4 $23,669 $14,751(0.31) (0.18) ( $1,157) ( $759)Source: AHCPR, Center for Organization and Delivery Studies, Healthcare Cost and Utilization Project (<strong>HCUP</strong>).
Table 2The top 100 principal diagnoses and their associated principal procedures: <strong>HCUP</strong> Nationwide Inpatient Sample, 1996Number of discharges Length of stay ChargesTop 100 ranked diagnoses with top 5 procedures ranked below[CCS category in brackets]1As a percent of As a percentdischarges w/ of all Percent Mean Median Mean MedianTotal2this diagnosis3discharges died4(S.E.)4(S.E.)4(S.E.)4(S.E.)D57. Other fractures [231] 166,785 100.00 0.48 1.33 6.0 3.6 $12,367 $5,984Number of procedures with this diagnosis = 177 (0.08) (0.04) ( $521) ( $118)p1. No Procedure Listed [.] 96,383 57.79 0.28 0.57 4.7 3.1 $6,261 $4,561(0.09) (0.04) ( $137) ( $65)p2. Other fracture and dislocation procedure [148] 6,275 3.76 0.02 0.87 9.0 6.7 $30,286 $19,995(0.31) (0.28) ( $2,576) ( $1,062)p3. Suture of skin and subcutaneous tissue [171] 4,751 2.85 0.01 0.81 3.9 2.5 $9,081 $6,352(0.12) (0.09) ( $483) ( $295)p4. Other OR therapeutic nervous system procedures [9] 4,336 2.60 0.01 2.78 7.6 4.9 $28,465 $16,475(0.32) (0.19) ( $2,386) ( $828)84p5. Physical therapy exercises, manipulation, and other procedures 3,969 2.38 0.01 0.70 7.0 4.4 $7,184 $5,027[213](0.48) (0.51) ( $485) ( $301)D58. Other lower respiratory disease [133] 161,760 100.00 0.46 3.08 4.0 1.9 $9,407 $5,288Number of procedures with this diagnosis = 175 (0.05) (0.02) ( $203) ( $80)p1. No Procedure Listed [.] 97,304 60.15 0.28 1.79 2.8 1.5 $5,208 $4,076(0.03) (0.02) ( $76) ( $66)p2. Diagnostic bronchoscopy and biopsy of bronchus [37] 10,505 6.49 0.03 3.97 7.1 4.8 $16,237 $11,163(0.24) (0.15) ( $673) ( $286)p3. Diagnostic cardiac catheterization, coronary arteriography [47] 5,652 3.49 0.02 0.55 3.2 2.0 $10,126 $8,458(0.10) (0.08) ( $326) ( $251)p4. Other diagnostic procedures on lung and bronchus [38] 4,489 2.77 0.01 7.11 8.4 4.2 $27,755 $16,465(0.33) (0.24) ( $1,461) ( $560)p5. Lobectomy or pneumonectomy [36] 4,320 2.67 0.01 1.80 6.4 4.2 $20,118 $15,129(0.22) (0.14) ( $742) ( $399)Source: AHCPR, Center for Organization and Delivery Studies, Healthcare Cost and Utilization Project (<strong>HCUP</strong>).
Table 2The top 100 principal diagnoses and their associated principal procedures: <strong>HCUP</strong> Nationwide Inpatient Sample, 1996Number of discharges Length of stay ChargesTop 100 ranked diagnoses with top 5 procedures ranked below[CCS category in brackets]1As a percent of As a percentdischarges w/ of all Percent Mean Median Mean MedianTotal2this diagnosis3discharges died4(S.E.)4(S.E.)4(S.E.)4(S.E.)D59. Abdominal hernia [143] 161,289 100.00 0.46 1.23 4.4 2.4 $11,262 $7,442Number of procedures with this diagnosis = 131 (0.05) (0.03) ( $168) ( $105)p1. Other hernia repair [86]78,498 48.67 0.23 0.78 4.3 2.6 $11,009 $7,904(0.05) (0.03) ( $193) ( $121)p2. Inguinal and femoral hernia repair [85] 43,549 27.00 0.12 0.71 3.2 1.4 $8,413 $6,080(0.06) (0.04) ( $158) ( $115)p3. No Procedure Listed [.] 11,615 7.20 0.03 1.30 3.5 1.8 $5,071 $3,919(0.35) (0.05) ( $134) ( $92)85p4. Excision, lysis peritoneal adhesions [90] 6,084 3.77 0.02 1.78 6.8 4.9 $17,743 $12,803(0.17) (0.18) ( $566) ( $308)p5. Other OR upper GI therapeutic procedures [94] 5,010 3.11 0.01 0.96 5.6 3.2 $18,158 $12,721(0.26) (0.19) ( $987) ( $383)D60. Cancer of bronchus, lung [19] 158,150 100.00 0.45 15.76 8.1 5.8 $19,392 $14,011Number of procedures with this diagnosis = 163 (0.08) (0.05) ( $333) ( $249)p1. Lobectomy or pneumonectomy [36] 39,736 25.13 0.11 3.26 9.1 6.7 $29,174 $22,924(0.11) (0.06) ( $615) ( $503)p2. Diagnostic bronchoscopy and biopsy of bronchus [37] 36,846 23.30 0.11 6.86 8.5 6.6 $17,385 $13,817(0.11) (0.08) ( $269) ( $234)p3. No Procedure Listed [.] 33,297 21.05 0.10 35.97 5.0 3.1 $7,076 $5,116(0.10) (0.06) ( $135) ( $100)p4. Incision of pleura, thoracentesis, chest drainage [39] 5,890 3.72 0.02 20.35 8.4 6.4 $15,787 $11,921(0.23) (0.21) ( $495) ( $441)p5. Therapeutic radiology [211] 4,338 2.74 0.01 13.83 9.8 6.7 $16,587 $12,296(0.43) (0.31) ( $655) ( $460)Source: AHCPR, Center for Organization and Delivery Studies, Healthcare Cost and Utilization Project (<strong>HCUP</strong>).
Table 2The top 100 principal diagnoses and their associated principal procedures: <strong>HCUP</strong> Nationwide Inpatient Sample, 1996Number of discharges Length of stay ChargesTop 100 ranked diagnoses with top 5 procedures ranked below[CCS category in brackets]1As a percent of As a percentdischarges w/ of all Percent Mean Median Mean MedianTotal2this diagnosis3discharges died4(S.E.)4(S.E.)4(S.E.)4(S.E.)D61. Esophageal disorders [138] 158,065 100.00 0.45 0.64 3.8 2.0 $8,596 $5,620Number of procedures with this diagnosis = 160 (0.05) (0.02) ( $163) ( $76)p1. No Procedure Listed [.] 55,971 35.41 0.16 0.16 2.3 1.3 $4,361 $3,643(0.03) (0.02) ( $64) ( $61)p2. Upper gastrointestinal endoscopy, biopsy [70] 45,865 29.02 0.13 0.76 4.3 2.8 $8,015 $6,225(0.05) (0.03) ( $123) ( $86)p3. Other OR upper GI therapeutic procedures [94] 20,772 13.14 0.06 0.57 5.3 2.5 $17,389 $10,977(0.18) (0.09) ( $658) ( $295)p4. Diagnostic cardiac catheterization, coronary arteriography [47] 6,951 4.40 0.02 0.00 2.7 1.8 $9,118 $8,272(0.05) (0.05) ( $186) ( $167)86p5. Esophageal dilatation [69] 4,435 2.81 0.01 0.33 4.5 2.9 $8,025 $5,694(0.17) (0.12) ( $344) ( $195)D62. Prolapse of female genital organs [170] 157,673 100.00 0.45 0.04 2.8 2.1 $7,949 $7,108Number of procedures with this diagnosis = 58 (0.02) (0.02) ( $101) ( $102)p1. Hysterectomy, abdominal and vaginal [124] 83,001 52.64 0.24 0.03 2.9 2.2 $8,411 $7,599(0.02) (0.02) ( $112) ( $111)p2. Repair of cystocele and rectocele, obliteration of vaginal vault [129] 42,410 26.90 0.12 0.04 2.5 1.8 $6,607 $5,897(0.02) (0.02) ( $92) ( $92)p3. Other OR therapeutic procedures, female organs [132] 17,795 11.29 0.05 0.09 2.8 2.0 $8,346 $7,420(0.04) (0.04) ( $165) ( $142)p4. Genitourinary incontinence procedures [106] 8,301 5.26 0.02 0.06 2.8 2.0 $8,313 $7,470(0.06) (0.05) ( $179) ( $189)p5. Oophorectomy, unilateral and bilateral [119] 2,068 1.31 0.01 0.00 3.3 2.6 $11,257 $10,230(0.10) (0.08) ( $368) ( $311)Source: AHCPR, Center for Organization and Delivery Studies, Healthcare Cost and Utilization Project (<strong>HCUP</strong>).
Table 2The top 100 principal diagnoses and their associated principal procedures: <strong>HCUP</strong> Nationwide Inpatient Sample, 1996Number of discharges Length of stay ChargesTop 100 ranked diagnoses with top 5 procedures ranked below[CCS category in brackets]1As a percent of As a percentdischarges w/ of all Percent Mean Median Mean MedianTotal2this diagnosis3discharges died4(S.E.)4(S.E.)4(S.E.)4(S.E.)D63. Malposition, malpresentation [187] 156,507 100.00 0.45 0.01 3.0 2.3 $6,151 $5,617Number of procedures with this diagnosis = 28 (0.03) (0.02) ( $122) ( $115)p1. Cesarean section [134] 126,358 80.74 0.36 0.01 3.2 2.5 $6,702 $6,096(0.03) (0.02) ( $134) ( $136)p2. Forceps, vacuum, and breech delivery [135] 9,685 6.19 0.03 0.00 1.9 1.4 $4,066 $3,657(0.04) (0.03) ( $119) ( $122)p3. Other procedures to assist delivery [137] 8,706 5.56 0.02 0.00 1.7 1.2 $3,610 $3,149(0.04) (0.04) ( $102) ( $98)p4. Episiotomy [133] 5,952 3.80 0.02 0.00 1.7 1.2 $3,651 $3,247(0.03) (0.03) ( $111) ( $109)87p5. Repair of current obstetric laceration [140] 2,662 1.70 0.01 0.00 1.8 1.2 $3,716 $3,436(0.05) (0.05) ( $106) ( $114)D64. Other gastrointestinal disorders [155] 155,470 100.00 0.45 2.45 6.0 3.8 $13,084 $7,570Number of procedures with this diagnosis = 182 (0.06) (0.04) ( $228) ( $115)p1. No Procedure Listed [.] 46,886 30.16 0.13 1.95 3.2 1.9 $4,536 $3,299(0.05) (0.03) ( $88) ( $55)p2. Other OR lower GI therapeutic procedures [96] 27,232 17.52 0.08 1.20 7.8 6.1 $18,304 $13,126(0.11) (0.06) ( $490) ( $218)p3. Colonoscopy and biopsy [76] 14,122 9.08 0.04 0.84 5.2 3.6 $8,649 $6,534(0.10) (0.07) ( $219) ( $142)p4. Colorectal resection [78] 12,106 7.79 0.03 8.09 11.1 7.9 $31,054 $21,554(0.24) (0.13) ( $808) ( $451)p5. Upper gastrointestinal endoscopy, biopsy [70] 9,577 6.16 0.03 0.56 5.5 3.8 $9,796 $7,396(0.14) (0.08) ( $268) ( $169)Source: AHCPR, Center for Organization and Delivery Studies, Healthcare Cost and Utilization Project (<strong>HCUP</strong>).
Table 2The top 100 principal diagnoses and their associated principal procedures: <strong>HCUP</strong> Nationwide Inpatient Sample, 1996Number of discharges Length of stay ChargesTop 100 ranked diagnoses with top 5 procedures ranked below[CCS category in brackets]1As a percent of As a percentdischarges w/ of all Percent Mean Median Mean MedianTotal2this diagnosis3discharges died4(S.E.)4(S.E.)4(S.E.)4(S.E.)D65. Abdominal pain [251] 152,026 100.00 0.44 0.42 2.7 1.5 $5,154 $3,853Number of procedures with this diagnosis = 158 (0.02) (0.02) ( $74) ( $53)p1. No Procedure Listed [.] 94,691 62.29 0.27 0.35 2.2 1.2 $3,865 $3,070(0.02) (0.02) ( $56) ( $46)p2. Upper gastrointestinal endoscopy, biopsy [70] 9,039 5.95 0.03 0.14 4.2 2.9 $7,860 $6,444(0.08) (0.07) ( $200) ( $137)p3. Appendectomy [80] 8,109 5.33 0.02 0.00 2.6 1.7 $7,542 $6,303(0.06) (0.04) ( $205) ( $189)p4. CT scan abdomen [179] 5,741 3.78 0.02 0.68 2.8 1.8 $5,260 $4,378(0.08) (0.08) ( $201) ( $154)88p5. Colonoscopy and biopsy [76] 5,272 3.47 0.02 0.31 4.5 3.2 $7,979 $6,667(0.12) (0.10) ( $251) ( $158)D66. Other and unspecified benign neoplasm [47] 151,628 100.00 0.44 0.59 4.6 2.7 $13,852 $9,019Number of procedures with this diagnosis = 190 (0.05) (0.03) ( $354) ( $168)p1. Oophorectomy, unilateral and bilateral [119] 17,603 11.61 0.05 0.03 3.3 2.4 $9,065 $7,588(0.05) (0.03) ( $189) ( $140)p2. Other therapeutic endocrine procedures [12] 14,539 9.59 0.04 0.33 4.0 2.3 $14,272 $10,139(0.10) (0.09) ( $568) ( $366)p3. Hysterectomy, abdominal and vaginal [124] 13,366 8.81 0.04 0.15 4.0 2.8 $10,917 $9,128(0.08) (0.03) ( $348) ( $181)p4. Thyroidectomy, partial or complete [10] 11,443 7.55 0.03 0.05 1.6 0.8 $6,751 $5,889(0.04) (0.02) ( $159) ( $152)p5. Colorectal resection [78] 10,879 7.17 0.03 0.92 7.9 6.3 $18,695 $14,623(0.14) (0.07) ( $553) ( $306)Source: AHCPR, Center for Organization and Delivery Studies, Healthcare Cost and Utilization Project (<strong>HCUP</strong>).
Table 2The top 100 principal diagnoses and their associated principal procedures: <strong>HCUP</strong> Nationwide Inpatient Sample, 1996Number of discharges Length of stay ChargesTop 100 ranked diagnoses with top 5 procedures ranked below[CCS category in brackets]1As a percent of As a percentdischarges w/ of all Percent Mean Median Mean MedianTotal2this diagnosis3discharges died4(S.E.)4(S.E.)4(S.E.)4(S.E.)D67. Fetopelvic disproportion, obstruction [188] 149,209 100.00 0.43 0.01 2.9 2.3 $6,074 $5,594Number of procedures with this diagnosis = 24 (0.02) (0.02) ( $115) ( $123)p1. Cesarean section [134] 100,708 67.49 0.29 0.02 3.4 2.7 $7,196 $6,727(0.03) (0.03) ( $126) ( $147)p2. Forceps, vacuum, and breech delivery [135] 15,412 10.33 0.04 0.00 1.9 1.4 $3,935 $3,561(0.03) (0.03) ( $108) ( $113)p3. Other procedures to assist delivery [137] 12,838 8.60 0.04 0.00 1.7 1.2 $3,479 $3,146(0.03) (0.03) ( $74) ( $86)p4. Episiotomy [133] 11,839 7.93 0.03 0.00 1.7 1.2 $3,512 $3,236(0.02) (0.03) ( $68) ( $79)89p5. Repair of current obstetric laceration [140] 4,460 2.99 0.01 0.00 1.8 1.2 $3,619 $3,286(0.03) (0.04) ( $93) ( $91)D68. Other mental conditions [74] 144,557 100.00 0.41 0.07 5.8 3.1 $5,427 $3,362Number of procedures with this diagnosis = 135 (0.32) (0.09) ( $370) ( $111)p1. No Procedure Listed [.] 118,414 81.92 0.34 0.03 5.3 2.9 $5,015 $3,188(0.38) (0.12) ( $438) ( $110)p2. Psychological and psychiatric evaluation and therapy [218] 10,850 7.51 0.03 0.00 7.3 4.1 $5,903 $3,800(0.55) (0.42) ( $489) ( $365)p3. Alcohol and drug rehabilitation/detoxification [219] 4,629 3.20 0.01 0.00 5.1 3.3 $4,940 $3,604(0.41) (0.45) ( $665) ( $522)p4. Other physical therapy and rehabilitation [215] 1,785 1.23 0.01 0.00 15.2 7.1 $10,885 $5,893(2.11) (1.37) ( $1,363) ( $937)p5. Suture of skin and subcutaneous tissue [171] 929 0.64 0.00 0.00 3.7 2.0 $3,713 $2,660(0.42) (0.22) ( $354) ( $180)Source: AHCPR, Center for Organization and Delivery Studies, Healthcare Cost and Utilization Project (<strong>HCUP</strong>).
Table 2The top 100 principal diagnoses and their associated principal procedures: <strong>HCUP</strong> Nationwide Inpatient Sample, 1996Number of discharges Length of stay ChargesTop 100 ranked diagnoses with top 5 procedures ranked below[CCS category in brackets]1As a percent of As a percentdischarges w/ of all Percent Mean Median Mean MedianTotal2this diagnosis3discharges died4(S.E.)4(S.E.)4(S.E.)4(S.E.)D69. Gastritis and duodenitis [140] 144,505 100.00 0.41 0.92 4.0 2.6 $7,494 $5,506Number of procedures with this diagnosis = 160 (0.04) (0.02) ( $96) ( $64)p1. Upper gastrointestinal endoscopy, biopsy [70] 79,409 54.95 0.23 0.76 4.2 2.9 $8,053 $6,450(0.04) (0.03) ( $104) ( $85)p2. No Procedure Listed [.] 41,861 28.97 0.12 0.41 2.8 1.7 $4,288 $3,476(0.04) (0.02) ( $58) ( $51)p3. Colonoscopy and biopsy [76] 2,958 2.05 0.01 0.56 5.6 3.9 $9,960 $8,226(0.19) (0.15) ( $340) ( $219)p4. Blood transfusion [222] 2,180 1.51 0.01 3.40 5.2 3.5 $8,471 $6,359(0.32) (0.15) ( $502) ( $295)90p5. Other non-OR upper GI therapeutic procedures [93] 1,532 1.06 0.00 3.25 5.2 3.5 $11,744 $8,221(0.30) (0.24) ( $771) ( $426)D70. Fracture of upper limb [229] 142,830 100.00 0.41 0.43 3.4 1.7 $9,668 $6,769Number of procedures with this diagnosis = 135 (0.05) (0.03) ( $209) ( $109)p1. Other fracture and dislocation procedure [148] 47,051 32.94 0.14 0.28 3.0 1.5 $9,608 $7,030(0.06) (0.04) ( $290) ( $176)p2. Treatment, fracture or dislocation of radius and ulna [145] 46,780 32.75 0.13 0.08 2.6 1.4 $8,854 $6,757(0.05) (0.03) ( $213) ( $112)p3. No Procedure Listed [.] 18,152 12.71 0.05 0.74 4.2 2.3 $5,528 $3,810(0.16) (0.05) ( $176) ( $85)p4. Arthroplasty other than hip or knee [154] 5,983 4.19 0.02 0.52 4.7 3.2 $16,787 $14,905(0.12) (0.10) ( $396) ( $321)p5. Traction, splints, and other wound care [214] 4,705 3.29 0.01 0.89 3.6 2.1 $5,507 $3,668(0.20) (0.09) ( $283) ( $140)Source: AHCPR, Center for Organization and Delivery Studies, Healthcare Cost and Utilization Project (<strong>HCUP</strong>).
Table 2The top 100 principal diagnoses and their associated principal procedures: <strong>HCUP</strong> Nationwide Inpatient Sample, 1996Number of discharges Length of stay ChargesTop 100 ranked diagnoses with top 5 procedures ranked below[CCS category in brackets]1As a percent of As a percentdischarges w/ of all Percent Mean Median Mean MedianTotal2this diagnosis3discharges died4(S.E.)4(S.E.)4(S.E.)4(S.E.)D71. Peripheral and visceral atherosclerosis [114] 140,667 100.00 0.40 6.48 6.9 4.4 $20,493 $13,518Number of procedures with this diagnosis = 153 (0.11) (0.10) ( $348) ( $247)p1. Peripheral vascular bypass [55] 47,708 33.92 0.14 1.72 6.9 4.9 $22,380 $17,546(0.12) (0.09) ( $447) ( $293)p2. Other OR procedures on vessels other than head and neck [61] 21,206 15.08 0.06 1.70 3.8 1.7 $17,312 $13,091(0.14) (0.10) ( $612) ( $666)p3. No Procedure Listed [.] 13,657 9.71 0.04 11.16 5.7 3.4 $7,795 $5,341(0.36) (0.14) ( $367) ( $192)p4. Colonoscopy and biopsy [76] 12,519 8.90 0.04 2.23 5.5 3.8 $10,149 $7,327(0.10) (0.07) ( $290) ( $167)91p5. Colorectal resection [78] 5,198 3.70 0.01 26.25 15.2 10.5 $53,051 $34,694(0.53) (0.28) ( $1,956) ( $1,261)D72. Senility and organic mental disorders [68] 134,427 100.00 0.39 1.19 9.9 6.0 $9,733 $6,859Number of procedures with this diagnosis = 160 (0.24) (0.13) ( $224) ( $134)p1. No Procedure Listed [.] 100,642 74.87 0.29 0.94 9.1 5.7 $8,499 $6,302(0.27) (0.18) ( $230) ( $149)p2. Computerized axial tomography (CT) scan head [177] 7,858 5.85 0.02 1.24 9.1 4.9 $9,619 $6,483(0.57) (0.33) ( $515) ( $259)p3. Psychological and psychiatric evaluation and therapy [218] 3,748 2.79 0.01 0.69 16.9 12.7 $15,417 $11,722(1.32) (0.99) ( $1,259) ( $994)p4. Diagnostic spinal tap [4] 3,468 2.58 0.01 1.25 8.4 5.7 $11,325 $8,863(0.43) (0.30) ( $445) ( $286)p5. Magnetic resonance imaging [198] 1,464 1.09 0.00 0.40 10.7 6.7 $11,497 $8,260(0.96) (0.66) ( $754) ( $528)Source: AHCPR, Center for Organization and Delivery Studies, Healthcare Cost and Utilization Project (<strong>HCUP</strong>).
Table 2The top 100 principal diagnoses and their associated principal procedures: <strong>HCUP</strong> Nationwide Inpatient Sample, 1996Number of discharges Length of stay ChargesTop 100 ranked diagnoses with top 5 procedures ranked below[CCS category in brackets]1As a percent of As a percentdischarges w/ of all Percent Mean Median Mean MedianTotal2this diagnosis3discharges died4(S.E.)4(S.E.)4(S.E.)4(S.E.)D73. Noninfectious gastroenteritis [154] 130,516 100.00 0.37 0.16 2.9 1.7 $4,306 $3,004Number of procedures with this diagnosis = 149 (0.03) (0.02) ( $71) ( $45)p1. No Procedure Listed [.] 98,449 75.43 0.28 0.05 2.4 1.5 $3,279 $2,575(0.02) (0.02) ( $47) ( $38)p2. Colonoscopy and biopsy [76] 9,997 7.66 0.03 0.21 4.7 3.3 $7,701 $6,121(0.11) (0.08) ( $202) ( $126)p3. Upper gastrointestinal endoscopy, biopsy [70] 3,949 3.03 0.01 0.12 4.5 3.2 $8,701 $6,523(0.14) (0.11) ( $345) ( $276)p4. Other therapeutic procedures [231] 2,239 1.72 0.01 0.00 2.9 1.9 $3,756 $3,063(0.11) (0.10) ( $305) ( $172)92p5. CT scan abdomen [179] 1,620 1.24 0.00 0.00 3.4 2.0 $5,686 $4,414(0.17) (0.15) ( $299) ( $239)D74. HIV infection [5] 128,760 100.00 0.37 10.95 9.3 5.8 $18,875 $11,105Number of procedures with this diagnosis = 170 (0.20) (0.13) ( $546) ( $346)p1. No Procedure Listed [.] 45,743 35.53 0.13 8.87 6.0 3.9 $10,331 $7,342(0.15) (0.10) ( $286) ( $207)p2. Diagnostic bronchoscopy and biopsy of bronchus [37] 10,514 8.17 0.03 9.05 12.4 9.1 $29,503 $20,547(0.35) (0.27) ( $1,219) ( $972)p3. Diagnostic spinal tap [4] 8,745 6.79 0.03 10.52 10.0 6.7 $18,386 $12,492(0.36) (0.27) ( $766) ( $454)p4. Other therapeutic procedures [231] 7,365 5.72 0.02 6.24 8.2 5.6 $13,680 $9,433(0.45) (0.22) ( $1,254) ( $1,047)p5. Blood transfusion [222] 5,812 4.51 0.02 12.17 7.6 4.8 $14,487 $9,122(0.39) (0.31) ( $784) ( $525)Source: AHCPR, Center for Organization and Delivery Studies, Healthcare Cost and Utilization Project (<strong>HCUP</strong>).
Table 2The top 100 principal diagnoses and their associated principal procedures: <strong>HCUP</strong> Nationwide Inpatient Sample, 1996Number of discharges Length of stay ChargesTop 100 ranked diagnoses with top 5 procedures ranked below[CCS category in brackets]1As a percent of As a percentdischarges w/ of all Percent Mean Median Mean MedianTotal2this diagnosis3discharges died4(S.E.)4(S.E.)4(S.E.)4(S.E.)D75. Cancer of breast [24] 125,663 100.00 0.36 1.50 2.9 1.5 $9,229 $6,854Number of procedures with this diagnosis = 91 (0.06) (0.03) ( $228) ( $113)p1. Mastectomy [167] 86,429 68.78 0.25 0.13 2.6 1.6 $8,394 $7,035(0.04) (0.02) ( $141) ( $108)p2. Lumpectomy, quadrantectomy of breast [166] 23,539 18.73 0.07 0.14 1.7 0.8 $6,781 $5,939(0.04) (0.02) ( $168) ( $171)p3. Other therapeutic procedures, hemic and lymphatic system [67] 3,713 2.95 0.01 0.13 1.5 0.7 $5,859 $5,372(0.08) (0.03) ( $192) ( $226)p4. No Procedure Listed [.] 3,385 2.69 0.01 31.34 5.2 2.8 $6,650 $4,183(0.39) (0.17) ( $381) ( $227)93p5. Breast biopsy and other diagnostic procedures on breast [165] 1,815 1.44 0.01 4.43 5.3 3.2 $11,674 $8,580(0.30) (0.32) ( $574) ( $405)D76. Poisoning by other medications and drugs [242] 125,152 100.00 0.36 1.11 2.6 1.2 $6,115 $3,848Number of procedures with this diagnosis = 153 (0.03) (0.03) ( $139) ( $50)p1. No Procedure Listed [.] 91,341 72.98 0.26 0.23 2.1 1.0 $4,479 $3,487(0.03) (0.02) ( $64) ( $46)p2. Other non-OR upper GI therapeutic procedures [93] 7,223 5.77 0.02 0.13 1.8 0.8 $4,782 $3,555(0.07) (0.03) ( $202) ( $123)p3. Respiratory intubation and mechanical ventilation [216] 6,909 5.52 0.02 9.47 4.1 2.2 $15,413 $10,176(0.14) (0.09) ( $547) ( $309)p4. Electrographic cardiac monitoring [203] 2,117 1.69 0.01 0.42 2.1 1.0 $4,491 $3,526(0.18) (0.16) ( $257) ( $287)p5. Computerized axial tomography (CT) scan head [177] 1,985 1.59 0.01 1.59 4.1 2.4 $8,098 $5,586(0.30) (0.22) ( $601) ( $445)Source: AHCPR, Center for Organization and Delivery Studies, Healthcare Cost and Utilization Project (<strong>HCUP</strong>).
Table 2The top 100 principal diagnoses and their associated principal procedures: <strong>HCUP</strong> Nationwide Inpatient Sample, 1996Number of discharges Length of stay ChargesTop 100 ranked diagnoses with top 5 procedures ranked below[CCS category in brackets]1As a percent of As a percentdischarges w/ of all Percent Mean Median Mean MedianTotal2this diagnosis3discharges died4(S.E.)4(S.E.)4(S.E.)4(S.E.)D77. Intestinal infection [135] 120,768 100.00 0.35 0.75 3.8 2.2 $6,013 $3,496Number of procedures with this diagnosis = 149 (0.04) (0.02) ( $145) ( $56)p1. No Procedure Listed [.] 87,579 72.52 0.25 0.22 2.8 1.8 $3,799 $2,854(0.02) (0.02) ( $59) ( $43)p2. Colonoscopy and biopsy [76] 12,028 9.96 0.03 0.94 5.8 3.9 $9,801 $6,866(0.13) (0.08) ( $271) ( $123)p3. Upper gastrointestinal endoscopy, biopsy [70] 3,398 2.81 0.01 1.34 5.8 3.7 $10,389 $7,058(0.23) (0.13) ( $545) ( $214)p4. Diagnostic spinal tap [4] 2,505 2.07 0.01 0.18 3.3 2.4 $5,593 $4,212(0.11) (0.06) ( $265) ( $178)94p5. Other therapeutic procedures [231] 2,037 1.69 0.01 0.26 4.1 2.6 $5,796 $3,936(0.20) (0.17) ( $476) ( $413)D78. Hyperplasia of prostate [164] 120,399 100.00 0.35 0.26 3.1 1.9 $7,174 $5,899Number of procedures with this diagnosis = 81 (0.04) (0.02) ( $112) ( $97)p1. Transurethral resection of prostate (TURP) [113] 105,514 87.64 0.30 0.17 2.8 1.8 $6,830 $5,811(0.03) (0.02) ( $102) ( $97)p2. Open prostatectomy [114] 5,080 4.22 0.01 0.88 6.2 4.9 $14,343 $11,973(0.15) (0.12) ( $417) ( $308)p3. No Procedure Listed [.] 3,216 2.67 0.01 0.46 3.2 1.9 $4,968 $3,934(0.16) (0.13) ( $245) ( $238)p4. Endoscopy and endoscopic biopsy of the urinary tract [100] 1,946 1.62 0.01 0.00 3.9 2.4 $7,001 $5,597(0.21) (0.17) ( $364) ( $255)p5. Procedures on the urethra [109] 975 0.81 0.00 0.48 3.1 1.8 $8,000 $6,566(0.21) (0.12) ( $622) ( $516)Source: AHCPR, Center for Organization and Delivery Studies, Healthcare Cost and Utilization Project (<strong>HCUP</strong>).
Table 2The top 100 principal diagnoses and their associated principal procedures: <strong>HCUP</strong> Nationwide Inpatient Sample, 1996Number of discharges Length of stay ChargesTop 100 ranked diagnoses with top 5 procedures ranked below[CCS category in brackets]1As a percent of As a percentdischarges w/ of all Percent Mean Median Mean MedianTotal2this diagnosis3discharges died4(S.E.)4(S.E.)4(S.E.)4(S.E.)D79. Cancer of colon [14] 118,489 100.00 0.34 5.48 9.8 7.5 $22,753 $17,100Number of procedures with this diagnosis = 112 (0.07) (0.05) ( $296) ( $225)p1. Colorectal resection [78] 93,978 79.31 0.27 2.96 10.0 7.7 $23,859 $18,411(0.07) (0.05) ( $307) ( $256)p2. No Procedure Listed [.] 6,451 5.44 0.02 28.58 6.1 3.6 $7,271 $4,456(0.28) (0.17) ( $368) ( $182)p3. Colonoscopy and biopsy [76] 4,402 3.72 0.01 3.90 6.7 4.6 $12,792 $8,767(0.23) (0.20) ( $612) ( $356)p4. Other OR lower GI therapeutic procedures [96] 2,172 1.83 0.01 8.95 12.4 9.7 $29,233 $22,635(0.45) (0.62) ( $1,354) ( $946)95p5. Upper gastrointestinal endoscopy, biopsy [70] 1,306 1.10 0.00 9.14 7.4 5.5 $15,235 $10,891(0.41) (0.44) ( $1,270) ( $788)D80. Other female genital disorders [175] 110,649 100.00 0.32 0.12 2.9 2.0 $8,149 $6,900Number of procedures with this diagnosis = 107 (0.03) (0.02) ( $122) ( $100)p1. Hysterectomy, abdominal and vaginal [124]38,692 34.97 0.11 0.06 2.9 2.2 $8,517 $7,681(0.02) (0.02) ( $118) ( $111)p2. Genitourinary incontinence procedures [106] 35,823 32.38 0.10 0.03 2.5 1.7 $6,962 $6,303(0.03) (0.03) ( $120) ( $118)p3. Oophorectomy, unilateral and bilateral [119] 5,830 5.27 0.02 0.00 3.2 2.3 $8,893 $7,846(0.07) (0.05) ( $218) ( $180)p4. No Procedure Listed [.] 4,865 4.40 0.01 0.45 2.1 1.1 $3,736 $2,689(0.08) (0.06) ( $161) ( $104)p5. Other OR therapeutic procedures, female organs [132] 4,744 4.29 0.01 0.00 3.9 2.0 $10,998 $7,176(0.24) (0.09) ( $667) ( $218)Source: AHCPR, Center for Organization and Delivery Studies, Healthcare Cost and Utilization Project (<strong>HCUP</strong>).
Table 2The top 100 principal diagnoses and their associated principal procedures: <strong>HCUP</strong> Nationwide Inpatient Sample, 1996Number of discharges Length of stay ChargesTop 100 ranked diagnoses with top 5 procedures ranked below[CCS category in brackets]1As a percent of As a percentdischarges w/ of all Percent Mean Median Mean MedianTotal2this diagnosis3discharges died4(S.E.)4(S.E.)4(S.E.)4(S.E.)D81. Cancer of prostate [29] 107,054 100.00 0.31 1.61 4.3 3.1 $11,649 $9,935Number of procedures with this diagnosis = 93 (0.06) (0.05) ( $206) ( $314)p1. Open prostatectomy [114] 65,323 61.02 0.19 0.16 4.3 3.4 $13,374 $11,984(0.07) (0.06) ( $325) ( $346)p2. Transurethral resection of prostate (TURP) [113] 22,572 21.09 0.06 0.24 3.6 2.1 $7,894 $6,297(0.08) (0.05) ( $157) ( $120)p3. No Procedure Listed [.] 4,680 4.37 0.01 23.36 5.9 3.2 $6,359 $4,174(0.62) (0.14) ( $292) ( $223)p4. Other therapeutic procedures, hemic and lymphatic system [67] 3,255 3.04 0.01 0.14 2.9 2.0 $9,427 $8,338(0.13) (0.20) ( $389) ( $433)96p5. Other OR therapeutic procedures, male genital [118] 3,122 2.92 0.01 0.93 4.8 2.2 $11,309 $8,018(0.31) (0.22) ( $677) ( $432)D82. Other nervous system disorders [95] 106,730 100.00 0.31 1.31 5.9 3.1 $12,427 $7,021Number of procedures with this diagnosis = 178 (0.17) (0.08) ( $314) ( $139)p1. No Procedure Listed [.] 46,956 44.00 0.13 0.86 5.1 2.8 $7,825 $5,238(0.31) (0.10) ( $390) ( $147)p2. Diagnostic spinal tap [4] 7,998 7.49 0.02 1.40 6.3 4.2 $13,920 $8,540(0.18) (0.12) ( $541) ( $301)p3. Other OR therapeutic nervous system procedures [9] 7,937 7.44 0.02 0.38 3.8 2.1 $12,953 $9,397(0.15) (0.13) ( $769) ( $670)p4. Computerized axial tomography (CT) scan head [177] 4,503 4.22 0.01 0.45 4.7 2.8 $7,393 $5,161(0.19) (0.12) ( $352) ( $285)p5. Magnetic resonance imaging [198] 3,011 2.82 0.01 0.33 4.9 2.9 $8,838 $6,505(0.24) (0.18) ( $433) ( $316)Source: AHCPR, Center for Organization and Delivery Studies, Healthcare Cost and Utilization Project (<strong>HCUP</strong>).
Table 2The top 100 principal diagnoses and their associated principal procedures: <strong>HCUP</strong> Nationwide Inpatient Sample, 1996Number of discharges Length of stay ChargesTop 100 ranked diagnoses with top 5 procedures ranked below[CCS category in brackets]1As a percent of As a percentdischarges w/ of all Percent Mean Median Mean MedianTotal2this diagnosis3discharges died4(S.E.)4(S.E.)4(S.E.)4(S.E.)D83. Forceps delivery [194] 106,084 100.00 0.30 0.00 1.8 1.3 $3,784 $3,488Number of procedures with this diagnosis = 25 (0.02) (0.02) ( $74) ( $65)p1. Forceps, vacuum, and breech delivery [135] 93,493 88.13 0.27 0.00 1.8 1.3 $3,752 $3,468(0.02) (0.02) ( $79) ( $68)p2. Repair of current obstetric laceration [140] 3,470 3.27 0.01 0.00 1.9 1.3 $3,757 $3,562(0.05) (0.04) ( $72) ( $107)p3. Other procedures to assist delivery [137] 2,626 2.48 0.01 0.00 1.7 1.2 $3,709 $3,412(0.04) (0.07) ( $156) ( $137)p4. Episiotomy [133] 2,252 2.12 0.01 0.00 1.9 1.4 $3,800 $3,575(0.04) (0.05) ( $121) ( $136)97p5. No Procedure Listed [.] 1,623 1.53 0.00 0.00 1.6 1.0 $3,544 $3,385(0.05) (0.07) ( $89) ( $96)D84. Other connective tissue disease [211] 104,078 100.00 0.30 0.63 4.1 1.7 $9,663 $5,687Number of procedures with this diagnosis = 169 (0.16) (0.04) ( $484) ( $127)p1. No Procedure Listed [.] 30,444 29.25 0.09 0.28 4.4 2.1 $6,682 $3,892(0.40) (0.11) ( $1,085) ( $145)p2. Other therapeutic procedures on muscles and tendons [160] 21,494 20.65 0.06 0.31 2.9 1.4 $8,868 $6,432(0.08) (0.05) ( $468) ( $189)p3. Arthroplasty other than hip or knee [154] 16,612 15.96 0.05 0.00 1.6 0.8 $6,468 $5,737(0.03) (0.03) ( $180) ( $191)p4. Other OR therapeutic procedures on joints [162] 4,933 4.74 0.01 0.09 2.8 1.4 $8,526 $6,879(0.15) (0.10) ( $371) ( $311)p5. Debridement of wound, infection or burn [169] 3,954 3.80 0.01 6.37 13.8 8.7 $39,593 $19,327(0.58) (0.44) ( $3,607) ( $1,007)Source: AHCPR, Center for Organization and Delivery Studies, Healthcare Cost and Utilization Project (<strong>HCUP</strong>).
Table 2The top 100 principal diagnoses and their associated principal procedures: <strong>HCUP</strong> Nationwide Inpatient Sample, 1996Number of discharges Length of stay ChargesTop 100 ranked diagnoses with top 5 procedures ranked below[CCS category in brackets]1As a percent of As a percentdischarges w/ of all Percent Mean Median Mean MedianTotal2this diagnosis3discharges died4(S.E.)4(S.E.)4(S.E.)4(S.E.)D85. Pleurisy, pneumothorax, pulmonary collapse [130] 101,960 100.00 0.29 4.37 7.2 4.5 $14,465 $8,270Number of procedures with this diagnosis = 153 (0.07) (0.05) ( $267) ( $119)p1. Incision of pleura, thoracentesis, chest drainage [39] 48,205 47.28 0.14 3.52 6.8 4.7 $11,345 $7,724(0.07) (0.06) ( $190) ( $119)p2. No Procedure Listed [.] 21,703 21.29 0.06 3.73 3.8 2.3 $6,381 $4,822(0.08) (0.06) ( $133) ( $89)p3. Other OR therapeutic procedures on respiratory system [42] 7,079 6.94 0.02 3.00 12.6 9.7 $33,226 $23,427(0.32) (0.34) ( $1,303) ( $888)p4. Lobectomy or pneumonectomy [36] 4,113 4.03 0.01 1.86 10.8 8.1 $26,769 $19,469(0.32) (0.21) ( $1,116) ( $667)98p5. Diagnostic bronchoscopy and biopsy of bronchus [37] 3,327 3.26 0.01 3.94 9.3 6.9 $18,767 $14,164(0.31) (0.32) ( $756) ( $661)D86. Viral infection [7] 101,147 100.00 0.29 0.34 3.4 2.1 $5,756 $3,668Number of procedures with this diagnosis = 162 (0.04) (0.03) ( $136) ( $56)p1. No Procedure Listed [.] 67,749 66.98 0.19 0.15 2.9 1.9 $4,381 $3,267(0.03) (0.02) ( $72) ( $51)p2. Diagnostic spinal tap [4] 16,806 16.62 0.05 0.03 3.0 2.2 $4,951 $3,886(0.04) (0.04) ( $127) ( $113)p3. Other therapeutic procedures [231] 2,474 2.45 0.01 0.49 4.2 2.7 $6,828 $3,991(0.24) (0.11) ( $683) ( $333)p4. Upper gastrointestinal endoscopy, biopsy [70] 976 0.96 0.00 1.56 7.0 5.0 $13,166 $8,462(0.49) (0.33) ( $1,511) ( $604)p5. Computerized axial tomography (CT) scan head [177] 967 0.96 0.00 0.00 4.1 2.8 $6,334 $4,850(0.28) (0.24) ( $418) ( $354)Source: AHCPR, Center for Organization and Delivery Studies, Healthcare Cost and Utilization Project (<strong>HCUP</strong>).
Table 2The top 100 principal diagnoses and their associated principal procedures: <strong>HCUP</strong> Nationwide Inpatient Sample, 1996Number of discharges Length of stay ChargesTop 100 ranked diagnoses with top 5 procedures ranked below[CCS category in brackets]1As a percent of As a percentdischarges w/ of all Percent Mean Median Mean MedianTotal2this diagnosis3discharges died4(S.E.)4(S.E.)4(S.E.)4(S.E.)D87. Prolonged pregnancy [185] 101,001 100.00 0.29 0.01 2.1 1.4 $4,457 $3,884Number of procedures with this diagnosis = 25 (0.02) (0.02) ( $92) ( $106)p1. Other procedures to assist delivery [137] 36,938 36.57 0.11 0.00 1.8 1.2 $3,742 $3,410(0.02) (0.03) ( $89) ( $99)p2. Episiotomy [133] 21,226 21.02 0.06 0.02 1.9 1.3 $3,932 $3,651(0.03) (0.03) ( $87) ( $100)p3. Cesarean section [134] 14,274 14.13 0.04 0.00 3.6 2.9 $7,652 $7,068(0.04) (0.04) ( $150) ( $161)p4. Forceps, vacuum, and breech delivery [135] 11,060 10.95 0.03 0.00 2.0 1.5 $4,515 $4,238(0.03) (0.03) ( $159) ( $218)99p5. Repair of current obstetric laceration [140] 10,555 10.45 0.03 0.00 1.8 1.3 $3,809 $3,442(0.03) (0.03) ( $95) ( $81)D88. Deficiency and other anemia [59] 100,040 100.00 0.29 1.97 4.7 2.7 $9,312 $5,468Number of procedures with this diagnosis = 178 (0.07) (0.04) ( $246) ( $83)p1. No Procedure Listed [.] 33,197 33.18 0.10 1.53 3.7 2.2 $6,495 $4,446(0.10) (0.06) ( $167) ( $92)p2. Blood transfusion [222] 30,157 30.14 0.09 1.48 3.4 1.8 $6,118 $3,932(0.09) (0.06) ( $191) ( $93)p3. Upper gastrointestinal endoscopy, biopsy [70] 10,223 10.22 0.03 0.80 5.0 3.6 $9,235 $7,664(0.10) (0.10) ( $188) ( $194)p4. Bone marrow biopsy [65] 7,076 7.07 0.02 1.60 6.3 4.3 $12,494 $8,102(0.16) (0.12) ( $479) ( $250)p5. Colonoscopy and biopsy [76] 3,424 3.42 0.01 0.57 5.2 4.0 $8,623 $7,396(0.15) (0.14) ( $246) ( $222)Source: AHCPR, Center for Organization and Delivery Studies, Healthcare Cost and Utilization Project (<strong>HCUP</strong>).
Table 2The top 100 principal diagnoses and their associated principal procedures: <strong>HCUP</strong> Nationwide Inpatient Sample, 1996Number of discharges Length of stay ChargesTop 100 ranked diagnoses with top 5 procedures ranked below[CCS category in brackets]1As a percent of As a percentdischarges w/ of all Percent Mean Median Mean MedianTotal2this diagnosis3discharges died4(S.E.)4(S.E.)4(S.E.)4(S.E.)D89. Crushing injury or internal injury [234] 97,672 100.00 0.28 4.54 6.9 4.2 $24,833 $11,656Number of procedures with this diagnosis = 181 (0.14) (0.05) ( $1,460) ( $350)p1. No Procedure Listed [.] 21,138 21.64 0.06 0.50 3.7 2.4 $7,883 $5,725(0.08) (0.05) ( $389) ( $143)p2. Incision of pleura, thoracentesis, chest drainage [39] 16,867 17.27 0.05 1.81 5.5 3.9 $12,775 $8,467(0.09) (0.08) ( $579) ( $250)p3. Procedures on spleen [66] 7,683 7.87 0.02 6.59 8.9 5.8 $37,639 $22,051(0.28) (0.09) ( $2,862) ( $694)p4. Other OR procedures on vessels other than head and neck [61] 5,045 5.16 0.01 8.53 6.8 3.5 $33,406 $16,568(0.39) (0.20) ( $4,235) ( $1,045)100p5. Other OR gastrointestinal therapeutic procedures [99] 4,786 4.90 0.01 10.85 9.4 5.8 $43,197 $24,074(0.33) (0.28) ( $2,957) ( $1,373)D90. Heart valve disorders [96] 88,783 100.00 0.25 4.64 9.2 6.5 $45,305 $37,923Number of procedures with this diagnosis = 121 (0.31) (0.14) ( $1,375) ( $1,366)p1. Heart valve procedures [43] 55,270 62.25 0.16 5.41 11.3 8.1 $60,768 $50,970(0.39) (0.16) ( $1,547) ( $1,342)p2. Diagnostic cardiac catheterization, coronary arteriography [47] 12,001 13.52 0.03 1.73 3.9 2.0 $12,282 $9,278(0.21) (0.20) ( $515) ( $346)p3. No Procedure Listed [.] 11,706 13.18 0.03 1.24 4.0 2.2 $6,776 $5,053(0.25) (0.08) ( $287) ( $121)p4. Other OR heart procedures [49] 2,096 2.36 0.01 7.50 9.7 7.0 $54,123 $43,790(0.43) (0.35) ( $2,742) ( $2,191)p5. Diagnostic ultrasound of heart (echocardiogram) [193] 2,031 2.29 0.01 0.64 3.9 2.6 $8,099 $6,215(0.17) (0.15) ( $454) ( $258)Source: AHCPR, Center for Organization and Delivery Studies, Healthcare Cost and Utilization Project (<strong>HCUP</strong>).
Table 2The top 100 principal diagnoses and their associated principal procedures: <strong>HCUP</strong> Nationwide Inpatient Sample, 1996Number of discharges Length of stay ChargesTop 100 ranked diagnoses with top 5 procedures ranked below[CCS category in brackets]1As a percent of As a percentdischarges w/ of all Percent Mean Median Mean MedianTotal2this diagnosis3discharges died4(S.E.)4(S.E.)4(S.E.)4(S.E.)D91. Other circulatory disease [117] 88,673 100.00 0.25 2.82 4.7 2.6 $10,681 $6,168Number of procedures with this diagnosis = 185 (0.06) (0.04) ( $230) ( $101)p1. No Procedure Listed [.] 45,132 50.90 0.13 1.95 3.4 2.1 $5,682 $4,473(0.05) (0.04) ( $87) ( $70)p2. Other OR procedures on vessels other than head and neck [61] 6,690 7.54 0.02 1.83 3.8 1.3 $15,574 $10,401(0.19) (0.15) ( $698) ( $464)p3. Peripheral vascular bypass [55] 3,049 3.44 0.01 1.08 7.1 5.2 $21,503 $17,173(0.31) (0.22) ( $1,035) ( $536)p4. Other diagnostic cardiovascular procedures [62] 2,143 2.42 0.01 0.47 6.4 4.3 $11,237 $8,575(0.28) (0.26) ( $540) ( $328)101p5. Diagnostic cardiac catheterization, coronary arteriography [47] 2,026 2.29 0.01 0.89 2.6 0.9 $9,085 $6,632(0.27) (0.18) ( $998) ( $743)D92. Acute and unspecified renal failure [157] 88,120 100.00 0.25 13.13 8.3 5.8 $17,029 $10,675Number of procedures with this diagnosis = 172 (0.09) (0.05) ( $350) ( $166)p1. No Procedure Listed [.] 38,103 43.24 0.11 13.31 5.6 4.1 $8,553 $6,679(0.07) (0.06) ( $136) ( $107)p2. Other non-OR therapeutic cardiovascular procedures [63] 5,092 5.78 0.01 15.45 10.4 8.0 $25,888 $18,938(0.27) (0.33) ( $935) ( $702)p3. Hemodialysis [58] 3,919 4.45 0.01 12.37 9.4 6.8 $22,013 $14,892(0.32) (0.39) ( $935) ( $729)p4. Creation, revision and removal of arteriovenous fistula or vessel-to- 3,605 4.09 0.01 3.83 13.5 10.0 $32,746 $25,293vessel cannula for dialysis [57](0.45) (0.68) ( $1,268) ( $1,040)p5. Upper gastrointestinal endoscopy, biopsy [70] 2,854 3.24 0.01 5.83 10.2 7.8 $19,364 $14,976(0.31) (0.23) ( $788) ( $608)Source: AHCPR, Center for Organization and Delivery Studies, Healthcare Cost and Utilization Project (<strong>HCUP</strong>).
Table 2The top 100 principal diagnoses and their associated principal procedures: <strong>HCUP</strong> Nationwide Inpatient Sample, 1996Number of discharges Length of stay ChargesTop 100 ranked diagnoses with top 5 procedures ranked below[CCS category in brackets]1As a percent of As a percentdischarges w/ of all Percent Mean Median Mean MedianTotal2this diagnosis3discharges died4(S.E.)4(S.E.)4(S.E.)4(S.E.)D93. Endometriosis [169] 87,128 100.00 0.25 0.02 2.8 2.2 $8,423 $7,540Number of procedures with this diagnosis = 58 (0.02) (0.02) ( $124) ( $124)p1. Hysterectomy, abdominal and vaginal [124] 69,815 80.13 0.20 0.01 2.8 2.2 $8,350 $7,503(0.02) (0.02) ( $128) ( $131)p2. Oophorectomy, unilateral and bilateral [119] 5,918 6.79 0.02 0.00 3.0 2.2 $8,563 $7,649(0.05) (0.04) ( $187) ( $162)p3. Other operations on ovary [120] 3,857 4.43 0.01 0.00 2.7 2.1 $8,807 $8,108(0.07) (0.06) ( $229) ( $219)p4. Other excision of cervix and uterus [125] 1,420 1.63 0.00 0.00 2.5 1.9 $8,325 $7,584(0.09) (0.13) ( $334) ( $345)102p5. No Procedure Listed [.] 963 1.11 0.00 0.59 2.6 1.4 $4,366 $3,304(0.52) (0.14) ( $481) ( $290)D94. Other bone disease and musculoskeletal deformities [212] 86,274 100.00 0.25 0.27 4.0 2.6 $14,218 $10,093Number of procedures with this diagnosis = 127 (0.05) (0.04) ( $326) ( $192)p1. No Procedure Listed [.] 18,447 21.38 0.05 0.15 2.9 1.4 $5,266 $4,054(0.12) (0.04) ( $203) ( $76)p2. Hip replacement, total and partial [153] 18,053 20.93 0.05 0.59 5.5 4.2 $22,473 $20,480(0.08) (0.07) ( $361) ( $292)p3. Other OR therapeutic procedures on bone [161] 7,778 9.02 0.02 0.15 2.9 1.8 $11,733 $9,149(0.08) (0.05) ( $472) ( $279)p4. Spinal fusion [158] 5,874 6.81 0.02 0.14 6.6 5.3 $35,233 $28,903(0.18) (0.12) ( $1,919) ( $1,233)p5. Partial excision bone [142] 5,116 5.93 0.01 0.11 2.7 1.3 $10,010 $7,580(0.15) (0.06) ( $394) ( $325)Source: AHCPR, Center for Organization and Delivery Studies, Healthcare Cost and Utilization Project (<strong>HCUP</strong>).
Table 2The top 100 principal diagnoses and their associated principal procedures: <strong>HCUP</strong> Nationwide Inpatient Sample, 1996Number of discharges Length of stay ChargesTop 100 ranked diagnoses with top 5 procedures ranked below[CCS category in brackets]1As a percent of As a percentdischarges w/ of all Percent Mean Median Mean MedianTotal2this diagnosis3discharges died4(S.E.)4(S.E.)4(S.E.)4(S.E.)D95. Sprains and strains [232] 86,184 100.00 0.25 0.09 2.3 1.2 $6,368 $5,435Number of procedures with this diagnosis = 126 (0.04) (0.03) ( $102) ( $101)p1. Other therapeutic procedures on muscles and tendons [160] 26,963 31.29 0.08 0.06 2.0 1.1 $6,399 $5,642(0.03) (0.04) ( $128) ( $122)p2. No Procedure Listed [.] 22,857 26.52 0.07 0.08 3.0 1.8 $4,471 $3,419(0.08) (0.08) ( $207) ( $115)p3. Arthroplasty knee [152] 12,613 14.63 0.04 0.04 1.6 0.8 $8,873 $8,029(0.04) (0.03) ( $233) ( $274)p4. Arthroplasty other than hip or knee [154] 10,954 12.71 0.03 0.05 1.7 0.9 $6,530 $5,809(0.03) (0.03) ( $150) ( $161)103p5. Other OR therapeutic procedures on joints [162] 1,775 2.06 0.01 0.00 1.9 0.9 $8,124 $7,365(0.09) (0.06) ( $308) ( $301)D96. Other upper respiratory infections [126] 85,288 100.00 0.24 0.11 2.7 1.7 $4,804 $3,254Number of procedures with this diagnosis = 125 (0.03) (0.03) ( $106) ( $58)p1. No Procedure Listed [.] 60,688 71.16 0.17 0.10 2.4 1.5 $3,647 $2,783(0.03) (0.03) ( $72) ( $50)p2. Other OR therapeutic procedures on nose, mouth and pharynx [33] 5,250 6.16 0.02 0.13 3.1 1.1 $9,567 $6,524(0.20) (0.14) ( $514) ( $356)p3. Diagnostic spinal tap [4] 5,106 5.99 0.01 0.00 2.8 2.0 $4,811 $4,064(0.06) (0.07) ( $141) ( $164)p4. Other respiratory therapy [217] 2,093 2.45 0.01 0.00 2.4 1.5 $3,995 $3,116(0.17) (0.19) ( $290) ( $330)p5. Other therapeutic procedures [231] 1,919 2.25 0.01 0.00 3.3 2.0 $5,033 $3,377(0.19) (0.11) ( $363) ( $195)Source: AHCPR, Center for Organization and Delivery Studies, Healthcare Cost and Utilization Project (<strong>HCUP</strong>).
Table 2The top 100 principal diagnoses and their associated principal procedures: <strong>HCUP</strong> Nationwide Inpatient Sample, 1996Number of discharges Length of stay ChargesTop 100 ranked diagnoses with top 5 procedures ranked below[CCS category in brackets]1As a percent of As a percentdischarges w/ of all Percent Mean Median Mean MedianTotal2this diagnosis3discharges died4(S.E.)4(S.E.)4(S.E.)4(S.E.)D97. Pulmonary heart disease [103] 83,931 100.00 0.24 6.77 7.5 6.0 $15,683 $10,779Number of procedures with this diagnosis = 152 (0.07) (0.04) ( $587) ( $170)p1. No Procedure Listed [.] 43,259 51.54 0.12 3.95 6.5 5.5 $10,359 $8,758(0.06) (0.04) ( $147) ( $145)p2. Other OR procedures on vessels other than head and neck [61] 8,647 10.30 0.02 8.35 9.8 7.7 $26,730 $19,647(0.21) (0.17) ( $816) ( $522)p3. Radioisotope pulmonary scan [208] 5,971 7.11 0.02 2.32 6.8 5.8 $12,047 $9,879(0.12) (0.11) ( $477) ( $401)p4. Arterio- or venogram (not heart and head) [191] 3,384 4.03 0.01 2.27 7.2 6.2 $15,695 $12,698(0.18) (0.16) ( $600) ( $484)104p5. Diagnostic cardiac catheterization, coronary arteriography [47] 2,879 3.43 0.01 2.08 6.0 4.4 $16,164 $14,279(0.36) (0.44) ( $643) ( $580)D98. Peri-, endo-, and myocarditis, cardiomyopathy (except that caused 83,548 100.00 0.24 5.81 7.4 3.9 $19,302 $9,409by tuberculosis or sexually transmitted disease) [97]Number of procedures with this diagnosis = 155 (0.16) (0.07) ( $748) ( $162)p1. No Procedure Listed [.] 33,903 40.58 0.10 3.85 4.4 2.7 $7,803 $5,866(0.08) (0.05) ( $153) ( $106)p2. Diagnostic cardiac catheterization, coronary arteriography [47] 10,319 12.35 0.03 1.32 4.4 2.9 $13,109 $10,440(0.14) (0.12) ( $463) ( $288)p3. Diagnostic ultrasound of heart (echocardiogram) [193] 6,387 7.64 0.02 2.60 7.5 4.4 $15,672 $9,909(0.29) (0.29) ( $657) ( $469)p4. Other OR heart procedures [49] 6,018 7.20 0.02 8.75 10.5 7.1 $33,378 $21,569(0.56) (0.17) ( $2,473) ( $693)p5. Other vascular catheterization, not heart [54] 2,660 3.18 0.01 8.13 12.8 9.4 $25,370 $16,706(0.58) (0.61) ( $1,581) ( $803)Source: AHCPR, Center for Organization and Delivery Studies, Healthcare Cost and Utilization Project (<strong>HCUP</strong>).
Table 2The top 100 principal diagnoses and their associated principal procedures: <strong>HCUP</strong> Nationwide Inpatient Sample, 1996Number of discharges Length of stay ChargesTop 100 ranked diagnoses with top 5 procedures ranked below[CCS category in brackets]1As a percent of As a percentdischarges w/ of all Percent Mean Median Mean MedianTotal2this diagnosis3discharges died4(S.E.)4(S.E.)4(S.E.)4(S.E.)D99. Aortic, peripheral, and visceral artery aneurysms [115] 83,317 100.00 0.24 13.15 9.0 6.4 $36,454 $24,735Number of procedures with this diagnosis = 130 (0.12) (0.06) ( $797) ( $463)p1. Aortic resection, replacement or anastomosis [52] 41,888 50.28 0.12 10.81 9.8 7.2 $39,702 $28,846(0.13) (0.08) ( $872) ( $526)p2. Other OR procedures on vessels other than head and neck [61] 15,219 18.27 0.04 10.87 8.4 5.8 $37,460 $25,481(0.25) (0.19) ( $1,183) ( $675)p3. No Procedure Listed [.] 7,290 8.75 0.02 19.41 4.1 1.9 $8,012 $5,196(0.25) (0.12) ( $340) ( $183)p4. Peripheral vascular bypass [55] 5,428 6.52 0.02 5.27 9.5 6.8 $37,006 $27,643(0.35) (0.14) ( $2,010) ( $1,055)105p5. Contrast aortogram [189] 1,304 1.57 0.00 3.48 3.7 1.8 $11,808 $8,299(0.26) (0.23) ( $786) ( $618)D100. Other injuries and conditions due to external causes [244] 81,793 100.00 0.23 2.08 3.2 1.2 $8,208 $4,414Number of procedures with this diagnosis = 181 (0.12) (0.10) ( $317) ( $197)p1. No Procedure Listed [.] 39,923 48.81 0.11 0.65 2.4 1.0 $4,541 $3,225(0.09) (0.05) ( $166) ( $109)p2. Upper gastrointestinal endoscopy, biopsy [70] 5,658 6.92 0.02 0.35 2.4 1.0 $5,825 $4,213(0.08) (0.06) ( $204) ( $143)p3. Computerized axial tomography (CT) scan head [177] 2,743 3.35 0.01 0.49 1.8 0.5 $7,457 $4,588(0.33) (0.19) ( $1,442) ( $2,208)p4. Nonoperative removal of foreign body [229] 2,698 3.30 0.01 0.55 1.8 0.7 $5,425 $4,016(0.09) (0.04) ( $331) ( $207)p5. Respiratory intubation and mechanical ventilation [216] 2,583 3.16 0.01 33.27 5.4 2.8 $21,583 $13,934(0.32) (0.20) ( $1,448) ( $846)Source: AHCPR, Center for Organization and Delivery Studies, Healthcare Cost and Utilization Project (<strong>HCUP</strong>).
1Principal diagnoses and procedures are categorized using Clinical Classification Software (CCS).2Percent of discharges with the principal diagnosis that have this principal procedure. (Denominator is discharges with this diagnosis.)3Percent of all discharges that have this principal procedure-principal diagnosis combination. (Denominator is all discharges.)4S.E. is standard error.106Source: AHCPR, Center for Organization and Delivery Studies, Healthcare Cost and Utilization Project (<strong>HCUP</strong>).