Design Recommendation for Stone Column Reinforced Soft Clay ...
Design Recommendation for Stone Column Reinforced Soft Clay ...
Design Recommendation for Stone Column Reinforced Soft Clay ...

Create successful ePaper yourself
Turn your PDF publications into a flip-book with our unique Google optimized e-Paper software.
Improvement factor, β<br />
(ii) The height of embankment above the virgin ground<br />
level should be 4.3 m.<br />
(iii) The desired improvement factor should not be below<br />
2.75.<br />
(iv) From the serviceability criteria, the average<br />
settlement should not exceed 500 mm at 90%<br />
consolidation.<br />
Although the value of n s actually depends upon the<br />
relative stiffness of the column and the soil which should<br />
be estimated reasonably from the laboratory tests and the<br />
method of installation, it is hereby assumed as 6 (<strong>for</strong><br />
illustration).<br />
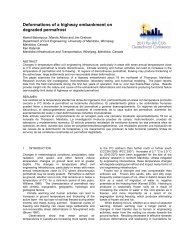
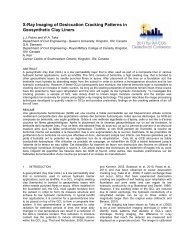
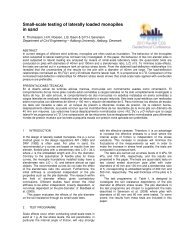
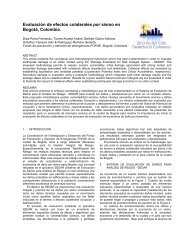
From the given data, T’ 90 = 0.00263. Using Fig.6, the<br />
value of N and H/r c can be estimated as 4 and 40<br />
respectively, from which the column parameters may be<br />
chosen as: r c = 0.5 m and r e = 2 m, although the column<br />
radius might be chosen depending upon the installation<br />
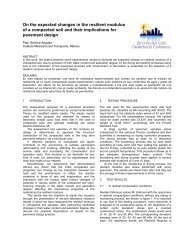
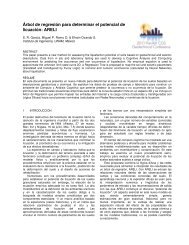
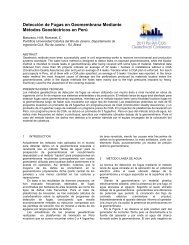
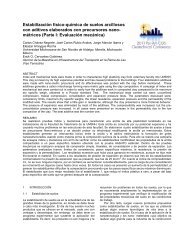
technique. The improvement factor obtained from the<br />
Fig.8 <strong>for</strong> t = 1 year is 2.926 which is well above the<br />
allowable limiting value of 2.75. Using Terzaghi‟s one<br />
dimensional consolidation theory, assuming the vertical<br />
permeability to be same as the horizontal permeability,<br />
the average surface settlement of the untreated soft<br />
ground at the end of 90% consolidation at the design<br />
embankment loading has been estimated as 4320 mm.<br />
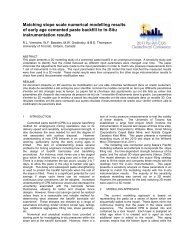
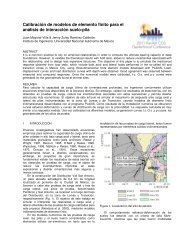
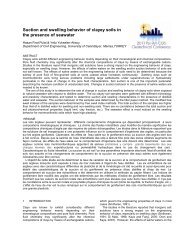
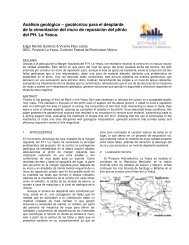
The allowable settlement factor is there<strong>for</strong>e calculated as<br />
500/4320 = 0.116, as against the actual value of 0.11<br />
estimated from the Fig.7.<br />
T’90 (10 -<br />
1 )<br />
k s/k h =0.1; r s/r c = 1.15;<br />
α = 0.5; α k = 1;<br />
N = r e/r c<br />
Figure 6. Variation of T’ 90 with N.<br />
k s/k h = 0.1; r s/r c =<br />
1.15; α =<br />
0.5; α k = 1;<br />
n s:<br />
2<br />
6<br />
10<br />
Table 1: Input parameters <strong>for</strong> field study.<br />
Material Parameter Values<br />
Redana<br />
(1999)<br />
Indraratna<br />
(2009)<br />
k h 2 x 10 -10 1 x 10 -9 m/s<br />
m/s<br />
m v 6.13 x 10 -7 3 x 10 -6<br />
Soil<br />
m 2 /N m 2 /N<br />
k s / k h 0.1* 0.333 $<br />
r s / r c 1.15* 2.5 $<br />
H 17 m 20 m<br />
H e As reported 4.3 m<br />
γ e by Redana 20 kN/m 3<br />
Embankment Q (1999)<br />
[Given in<br />
0<br />
Fig.5(b)]<br />
K p 3 * 3 *<br />
r c 0.025m<br />
<strong>Stone</strong> column<br />
/Vertical drain<br />
r e 0.8475m<br />
(T1);<br />
1.413m<br />
(T2)<br />
To be<br />
designed<br />
n s 4.72 As given in<br />
α As given in Figures 6-8<br />
α k Fig.5<br />
* $ Assumed values ($ as per Indraratna, 2009)<br />
Figure 7. Variation of ξ with N.<br />
N: n s :<br />
6;<br />
2:<br />
2<br />
2<br />
Time = t 90<br />
k s/k h = 0.1; r s/r c = 1.15;<br />
α = 0.5; α k = 1;<br />
Normalized imposed stress, q / c u0<br />
Figure 8. Variation of β with normalized<br />
imposed load intensity.