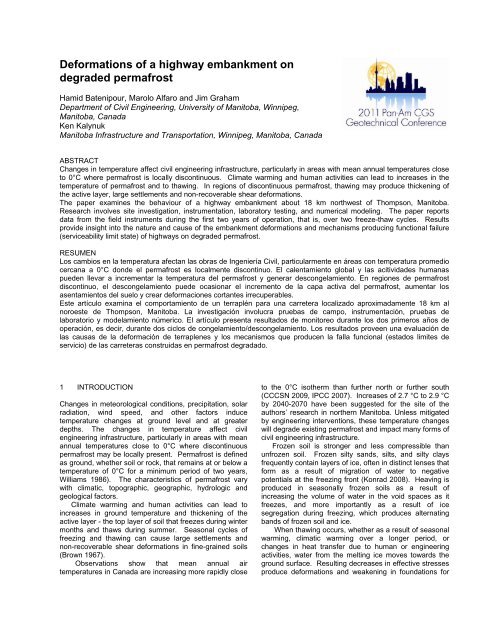
Deformations of a highway embankment on degraded permafrost
Deformations of a highway embankment on degraded permafrost
Deformations of a highway embankment on degraded permafrost

You also want an ePaper? Increase the reach of your titles
YUMPU automatically turns print PDFs into web optimized ePapers that Google loves.
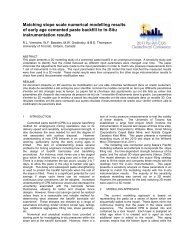
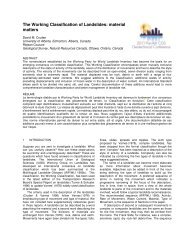
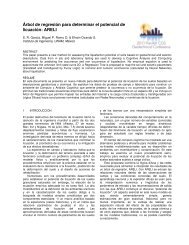
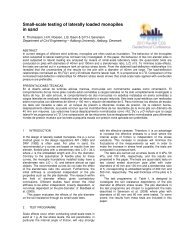
uildings and pipelines, airport runways, rail beds, and<str<strong>on</strong>g>highway</str<strong>on</strong>g> sub-bases, cuts and fills.Disc<strong>on</strong>tinuousPermafrostWinnipegPR391Thomps<strong>on</strong>ChurchillC<strong>on</strong>tinuous<strong>permafrost</strong>-1˚CFigure 1. Locati<strong>on</strong> <str<strong>on</strong>g>of</str<strong>on</strong>g> test site and <strong>permafrost</strong> in Manitoba,CanadaBecause the ice lenses are typically irregular inthickness and extent, out-migrati<strong>on</strong> <str<strong>on</strong>g>of</str<strong>on</strong>g> water <str<strong>on</strong>g>of</str<strong>on</strong>g>tenproduces differential settlements, lateral spreading, andreduced stability that lead to serviceability issues. .Typically, this thaw settlement is irregular (Hinkel et al.2003).Although the <strong>permafrost</strong> regi<strong>on</strong>s in northern Canadaare not heavily populated, their ec<strong>on</strong>omic importance hasincreased substantially in recent decades owing to thepresence <str<strong>on</strong>g>of</str<strong>on</strong>g> mineral, petrocarb<strong>on</strong> and hydroelectricresources. Thawing <str<strong>on</strong>g>of</str<strong>on</strong>g> summer ice in the Arctic Oceancan be expected to lead to additi<strong>on</strong>al shipping into the port<str<strong>on</strong>g>of</str<strong>on</strong>g> Churchill. New roads and railways will have to bec<strong>on</strong>structed into northern Manitoba and Nunavut oversoils with engineering properties that may degrade withclimate change and land-use. Design, c<strong>on</strong>structi<strong>on</strong>, andmaintenance <str<strong>on</strong>g>of</str<strong>on</strong>g> this new infrastructure will have to takeaccount <str<strong>on</strong>g>of</str<strong>on</strong>g> future warming (Hinkel et al. 2003).Figure 1 shows that Manitoba has disc<strong>on</strong>tinuous<strong>permafrost</strong> north <str<strong>on</strong>g>of</str<strong>on</strong>g> the isotherm for a current meanannual air temperature <str<strong>on</strong>g>of</str<strong>on</strong>g> about 0ºC (about 2500ºC-days<str<strong>on</strong>g>of</str<strong>on</strong>g> frost). The <strong>permafrost</strong> becomes c<strong>on</strong>tinuous furthernorth near the Huds<strong>on</strong> Bay coast.C<strong>on</strong>structi<strong>on</strong> in <strong>permafrost</strong> regi<strong>on</strong>s requires specialtechniques where soil pr<str<strong>on</strong>g>of</str<strong>on</strong>g>iles c<strong>on</strong>tain ice lenses.Disturbance <str<strong>on</strong>g>of</str<strong>on</strong>g> existing ground cover can change theenergy regime (Nels<strong>on</strong> and Outcalt, 1982). This <str<strong>on</strong>g>of</str<strong>on</strong>g>tenleads to thawing <str<strong>on</strong>g>of</str<strong>on</strong>g> underlying ice-rich <strong>permafrost</strong> andsubsidence <str<strong>on</strong>g>of</str<strong>on</strong>g> the road bed. <str<strong>on</strong>g>Deformati<strong>on</strong>s</str<strong>on</strong>g> can besufficiently large that the road becomes inoperable.Several methods are currently used to prevent orminimize thawing <str<strong>on</strong>g>of</str<strong>on</strong>g> <strong>permafrost</strong> and development <str<strong>on</strong>g>of</str<strong>on</strong>g>thermokarst. These include above-ground c<strong>on</strong>structi<strong>on</strong>,use <str<strong>on</strong>g>of</str<strong>on</strong>g> thermosyph<strong>on</strong>s, and buildings <strong>on</strong> piles or gravelpads above original ground level.Highway c<strong>on</strong>structi<strong>on</strong> in northern Canada followsbroadly similar practices to those in warmer regi<strong>on</strong>s. Fillsgenerally have high thermal c<strong>on</strong>ductivity, leading to heattransfer into underlying layers and thawing <str<strong>on</strong>g>of</str<strong>on</strong>g> previouslyfrozen foundati<strong>on</strong> soil (Batenipour et al. 2009b). Asphaltsurfacing absorbs heat from the sun and transfers it to the<str<strong>on</strong>g>embankment</str<strong>on</strong>g>. Generally, degradati<strong>on</strong> <str<strong>on</strong>g>of</str<strong>on</strong>g> <strong>permafrost</strong>begins at the toe <str<strong>on</strong>g>of</str<strong>on</strong>g> <str<strong>on</strong>g>embankment</str<strong>on</strong>g>s and extends laterbeneath the centre. Melting reduces strength andincreases pore water pressures when the hydraulicc<strong>on</strong>ductivity <str<strong>on</strong>g>of</str<strong>on</strong>g> the foundati<strong>on</strong> soil is low. This leads todifferential settlements, lateral spreading, and instability.In order to improve local design and maintenanceprocedures, Manitoba Infrastructure and Transportati<strong>on</strong>(MIT) and the University <str<strong>on</strong>g>of</str<strong>on</strong>g> Manitoba (UM) arecollaborating <strong>on</strong> several projects that involve fieldinstrumentati<strong>on</strong>, laboratory testing and numericalmodeling. This paper reports work <strong>on</strong> a project <strong>on</strong>Provincial Road PR391, about 18 km northwest <str<strong>on</strong>g>of</str<strong>on</strong>g>Thomps<strong>on</strong>, Manitoba (Figure 1). This is the <strong>on</strong>ly roadc<strong>on</strong>necting Thomps<strong>on</strong> to northern mining towns,hydroelectric generating stati<strong>on</strong>s, and first Nati<strong>on</strong>scommunities in north-western Manitoba. The site is in aregi<strong>on</strong> <str<strong>on</strong>g>of</str<strong>on</strong>g> disc<strong>on</strong>tinuous <strong>permafrost</strong>.2 GEOTECHNICAL SITE INVESTIGATIONS ANDFIELD INSTRUMENTATIONS2.1 Site Investigati<strong>on</strong>The PR391 was initially c<strong>on</strong>structed as a compactedearthen road <strong>on</strong> disc<strong>on</strong>tinuous <strong>permafrost</strong> in the mid-1960s and then c<strong>on</strong>verted to a gravel road in the early1970s. In the early 1980s, it was upgraded with abituminous pavement surface. Since c<strong>on</strong>structi<strong>on</strong>,changes in heat transfer have melted <strong>permafrost</strong> that hadbeen detected earlier, particularly under <str<strong>on</strong>g>embankment</str<strong>on</strong>g>s.Thawing led to large <strong>on</strong>going irregular deformati<strong>on</strong>s anddangerous traffic issues.Resp<strong>on</strong>ses by MIT included c<strong>on</strong>structi<strong>on</strong> <str<strong>on</strong>g>of</str<strong>on</strong>g> stabilizingberms and insulating peat berms beside the project<str<strong>on</strong>g>embankment</str<strong>on</strong>g> in the early 1990s. Over some years, theberms settled into the foundati<strong>on</strong> soil and essentiallydisappeared. They currently provide no additi<strong>on</strong>al supportto the original <str<strong>on</strong>g>embankment</str<strong>on</strong>g>. Regular maintenance hasadded several metres <str<strong>on</strong>g>of</str<strong>on</strong>g> gravel fill since initialc<strong>on</strong>structi<strong>on</strong>. Where extra maintenance is required, thewearing surface has been returned to gravel from asphalt:the asphalt pavement from the early 1980s has not beenreplaced.In 1991, drilling encountered frozen soil at depths from1.9m to 10.5m below the toe <str<strong>on</strong>g>of</str<strong>on</strong>g> the <str<strong>on</strong>g>embankment</str<strong>on</strong>g>. Laterdrilling in 2005, detected frozen soil at depths from 4.6mto 10.7m. Perhaps surprisingly, no frozen soil wasidentified in a recent drilling program in late 2008 usingc<strong>on</strong>tinuous flight, solid stem augers. A later secti<strong>on</strong> willshow no sub-zero temperatures below the active surfacelayer. C<strong>on</strong>siderable maintenance was required at the site.Records outlining maintenance procedures and annualapplicati<strong>on</strong> <str<strong>on</strong>g>of</str<strong>on</strong>g> gravel are unavailable.Figure 2 is the authors’ interpretati<strong>on</strong> <str<strong>on</strong>g>of</str<strong>on</strong>g> the results <str<strong>on</strong>g>of</str<strong>on</strong>g>the site investigati<strong>on</strong> at PR391 in 2008. The investigati<strong>on</strong>
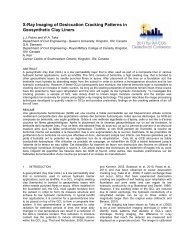
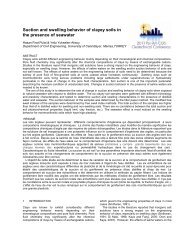
involved two cross-secti<strong>on</strong>s, <strong>on</strong>e <str<strong>on</strong>g>of</str<strong>on</strong>g> which was designatedas ‘stable’ and the other as ‘unstable’. The stable secti<strong>on</strong>is <strong>on</strong>ly about 2m high (Figure 2a) and has not deformedsignificantly. The unstable secti<strong>on</strong> is also about 2m highabove the surrounding natural ground. It has settledc<strong>on</strong>siderably and now c<strong>on</strong>tains about 5m - 6m <str<strong>on</strong>g>of</str<strong>on</strong>g> gravel(Figure 2b). The gravel is partly from the originalc<strong>on</strong>structi<strong>on</strong> and partly from <strong>on</strong>going re-grading. The‘zero’ depth in Figure 2 and in subsequent figures isreferenced to the level <str<strong>on</strong>g>of</str<strong>on</strong>g> the original ground surface and<str<strong>on</strong>g>of</str<strong>on</strong>g> the surrounding undisturbed land.near the toe. At the mid-slope, the soil is primarily silt toclayey silt. The toe <str<strong>on</strong>g>of</str<strong>on</strong>g> the unstable secti<strong>on</strong> c<strong>on</strong>sists <str<strong>on</strong>g>of</str<strong>on</strong>g>1.0m <str<strong>on</strong>g>of</str<strong>on</strong>g> clayey peat-silt, 1.0m <str<strong>on</strong>g>of</str<strong>on</strong>g> fine gravel, followed by alayer <str<strong>on</strong>g>of</str<strong>on</strong>g> highly plastic clay. This clay is firm, brown, siltyclay at upper levels and becomes very s<str<strong>on</strong>g>of</str<strong>on</strong>g>t and grey to adepth approaching 18m. The mid-slope <str<strong>on</strong>g>of</str<strong>on</strong>g> the unstablesecti<strong>on</strong> c<strong>on</strong>sists <str<strong>on</strong>g>of</str<strong>on</strong>g> almost 2.0m <str<strong>on</strong>g>of</str<strong>on</strong>g> clayey peat-silt, over2.0m <str<strong>on</strong>g>of</str<strong>on</strong>g> loose fine gravel, followed by firm brown silty claythat transiti<strong>on</strong>s to grey and s<str<strong>on</strong>g>of</str<strong>on</strong>g>t clay. Both secti<strong>on</strong>s areunderlain by gneissic bedrock. The surrounding area ispoorly drained - there is free-standing water withinapproximately 20m <str<strong>on</strong>g>of</str<strong>on</strong>g> the <str<strong>on</strong>g>embankment</str<strong>on</strong>g> toe when snow isnot present.2.2 Instrumentati<strong>on</strong>Clusters <str<strong>on</strong>g>of</str<strong>on</strong>g> instruments were installed at the shoulder,mid-slope and toe <str<strong>on</strong>g>of</str<strong>on</strong>g> both the stable and unstable secti<strong>on</strong>s(Figure 3). They include thermistor strings at 1m intervals,vibrating wire piezometers and standpipes, surfacesettlement plates, slope inclinometers, and lateraldisplacement extensometers at the toe <str<strong>on</strong>g>of</str<strong>on</strong>g> the<str<strong>on</strong>g>embankment</str<strong>on</strong>g>. The piezometers and standpipes wereused to identify possible upwards or downwards hydraulicgradients.Temperatures have been collected during two wintercycles. Readings were taken m<strong>on</strong>thly <strong>on</strong> a dataacquisiti<strong>on</strong> system and downloaded manually. Teleph<strong>on</strong>eaccess was not available at reas<strong>on</strong>able cost at therelatively remote site.3 DATA FROM FIELD INSTRUMENTATIONFollowing secti<strong>on</strong>s analyse the results <str<strong>on</strong>g>of</str<strong>on</strong>g> the fieldobservati<strong>on</strong>s. The data include surveyed results from thesurface settlement plates, displacements measured byinclinometers and horiz<strong>on</strong>tal extensometers, pore waterpressures, and m<strong>on</strong>thly temperatures from the thermistorstrings. Inserts in following figures show the positi<strong>on</strong>s <str<strong>on</strong>g>of</str<strong>on</strong>g>the instruments for which results are being reported.3.1 Movements measured by surface settlement platesFigure 2. a) stable secti<strong>on</strong>; b) unstable secti<strong>on</strong>The terms stable and unstable are here used in thesense <str<strong>on</strong>g>of</str<strong>on</strong>g> a serviceability limit state and not an ultimatelimit state. There are no indicati<strong>on</strong>s <str<strong>on</strong>g>of</str<strong>on</strong>g> deep-seatedrotati<strong>on</strong>al movements.Boreholes were drilled at the mid-slope and toe <str<strong>on</strong>g>of</str<strong>on</strong>g>each secti<strong>on</strong> to examine the stratigraphy, collect samplesfor laboratory testing, and install instruments to record thebehaviour <str<strong>on</strong>g>of</str<strong>on</strong>g> the foundati<strong>on</strong> soils over several years.Batenipour et al. (2009a, b and 2010) provided additi<strong>on</strong>alinformati<strong>on</strong> about site characterizati<strong>on</strong>, instrumentati<strong>on</strong>and material properties. This paper provides informati<strong>on</strong><strong>on</strong> two full years <str<strong>on</strong>g>of</str<strong>on</strong>g> field measurements.Figure 2 shows that soil c<strong>on</strong>diti<strong>on</strong>s below the originalground level (at depth ‘0’ in the figure) at the two secti<strong>on</strong>sare c<strong>on</strong>siderably different. The stable secti<strong>on</strong> c<strong>on</strong>sists <str<strong>on</strong>g>of</str<strong>on</strong>g>approximately 4.0m <str<strong>on</strong>g>of</str<strong>on</strong>g> s<str<strong>on</strong>g>of</str<strong>on</strong>g>t-to-firm clayey silt/silty clay withpeat intrusi<strong>on</strong>s that vary from thin stratificati<strong>on</strong>s to pocketsFigures 4 and 5 show displacements <str<strong>on</strong>g>of</str<strong>on</strong>g> surface settlementplates in metres in both the stable and unstable secti<strong>on</strong>sat the shoulder <str<strong>on</strong>g>of</str<strong>on</strong>g> the road, at mid-slope, and at the toe <str<strong>on</strong>g>of</str<strong>on</strong>g>the <str<strong>on</strong>g>embankment</str<strong>on</strong>g>s. Vertical movements are shown aselevati<strong>on</strong> changes in Figure 4, and horiz<strong>on</strong>tal (lateral)movements perpendicular to the centreline <str<strong>on</strong>g>of</str<strong>on</strong>g> the road inFigure 5.Figures 4a, 4b, and 4c show the vertical movements atthe shoulder, mid-slope and toe <str<strong>on</strong>g>of</str<strong>on</strong>g> the two secti<strong>on</strong>s. Bothshow seas<strong>on</strong>al movements that are largely, but notcompletely recoverable. Because <str<strong>on</strong>g>of</str<strong>on</strong>g> the gravel in the<str<strong>on</strong>g>embankment</str<strong>on</strong>g>, the seas<strong>on</strong>al movements at the shoulderare small. There appears to be little cumulativemovement at the shoulder <str<strong>on</strong>g>of</str<strong>on</strong>g> the stable secti<strong>on</strong>. Inc<strong>on</strong>trast, there has been about 0.15m <str<strong>on</strong>g>of</str<strong>on</strong>g> settlement at theshoulder <str<strong>on</strong>g>of</str<strong>on</strong>g> the unstable secti<strong>on</strong>. Seas<strong>on</strong>al heaves arelarger at mid-slope, and larger again at the toe. Again thestable secti<strong>on</strong> shows little cumulative movement, while
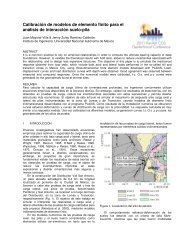
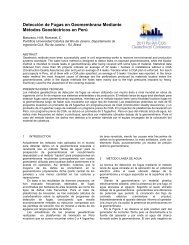
28-Mar-0906-Jul-0914-Oct-0922-Jan-1002-May-1010-Aug-1018-Nov-1026-Feb-11Vertical (m)Depth (m)28-Mar-0906-Jul-0914-Oct-0922-Jan-1002-May-1010-Aug-1018-Nov-1026-Feb-11Vertical (m)Depth (m)06-Jul-0914-Oct-0922-Jan-1002-May-1010-Aug-1018-Nov-1026-Feb-11Vertical (m)there is about 0.08m <str<strong>on</strong>g>of</str<strong>on</strong>g> cumulative settlement at midslopeand 0.04m at the toe.The lateral movements at the ground surface (againfrom the settlement plates) in Figures 5a, 5b, and 5c showsomewhat similar trends, though seas<strong>on</strong>al effects areperhaps <strong>on</strong>ly apparent at the toes <str<strong>on</strong>g>of</str<strong>on</strong>g> the <str<strong>on</strong>g>embankment</str<strong>on</strong>g>s.Again, the stable secti<strong>on</strong> did not move much in the two040123415114.414.41 2 2 31 2 31 2 3 4 4 5 6 7a) -0.151 2 3 4 5 6 71 - SurfaceSettlement2 - DeepSettlement3 - Thermistors4 - Stand Pipe5 - SlopeInclinometer6 - Piezometers7 - ExtensometerThe toe <str<strong>on</strong>g>of</str<strong>on</strong>g> the <str<strong>on</strong>g>embankment</str<strong>on</strong>g> shows the highest amount <str<strong>on</strong>g>of</str<strong>on</strong>g>frost-heave during the freezing seas<strong>on</strong> while the shouldershows almost no frost heave, probably due to the gravelfill <strong>on</strong> the shoulder. Gravel can be c<strong>on</strong>sidered to be an<strong>on</strong>-frost susceptible material (Koyama and Sasaki 1967).It drains freely by gravity and does not lead to upwardmovement <str<strong>on</strong>g>of</str<strong>on</strong>g> capillary moisture.Elevati<strong>on</strong>0.050.00-0.05-0.100.100.050.00-0.05-0.10SurfaceSettlement14.414.4SurfaceSettlementa)Date Elevati<strong>on</strong>b)StableUnstableStableUnstable8b)0.100.050.00StableUnstableElevati<strong>on</strong> Date-0.0514.4SurfaceSettlementc)20-0.10Figure 3. Instrumentati<strong>on</strong> at a) stable secti<strong>on</strong>; b) unstablesecti<strong>on</strong>years <str<strong>on</strong>g>of</str<strong>on</strong>g> observati<strong>on</strong> – the scatter in the data is probablyabout equal to the precisi<strong>on</strong> <str<strong>on</strong>g>of</str<strong>on</strong>g> the observati<strong>on</strong>s. All threeplates at the unstable secti<strong>on</strong> show cumulativemovements, about 0.07m at the shoulder and mid-slope,and 0.03m at the toe.‘Frost heave’ <str<strong>on</strong>g>of</str<strong>on</strong>g> the road <str<strong>on</strong>g>embankment</str<strong>on</strong>g> is associatedwith the formati<strong>on</strong> <str<strong>on</strong>g>of</str<strong>on</strong>g> ice lenses in seas<strong>on</strong>ally frozenground. Heave results when the water freezes, attractsadditi<strong>on</strong>al water by capillary acti<strong>on</strong>, and forms ice lenses.Lenses form in all soil types by the additi<strong>on</strong> <str<strong>on</strong>g>of</str<strong>on</strong>g> waterduring stati<strong>on</strong>ary or slow movement <str<strong>on</strong>g>of</str<strong>on</strong>g> the freezing fr<strong>on</strong>tinto the soil but are most comm<strong>on</strong> in silts and fine sand.The supply <str<strong>on</strong>g>of</str<strong>on</strong>g> water and ease <str<strong>on</strong>g>of</str<strong>on</strong>g> water movement(hydraulic c<strong>on</strong>ductivity) determines the extent andthickness <str<strong>on</strong>g>of</str<strong>on</strong>g> ice lenses. Frost heave occurs at the frostline, with T ≤ 0°C (Andersland and Ladanyi, 2004).The seas<strong>on</strong>al heaves seen in Figure 4 for theunstable secti<strong>on</strong> are believed to be due to frost heave.DateFigure 4. Vertical movements (settlements) at shoulder;mid-slope; and toe <str<strong>on</strong>g>of</str<strong>on</strong>g> the <str<strong>on</strong>g>embankment</str<strong>on</strong>g>3.2 Lateral Displacements from Shallow ExtensometersVibrating wire extensometers with a gauge-length <str<strong>on</strong>g>of</str<strong>on</strong>g> 1.0mwere installed at the toes <str<strong>on</strong>g>of</str<strong>on</strong>g> both test secti<strong>on</strong>s at a depth<str<strong>on</strong>g>of</str<strong>on</strong>g> 0.8m. The instruments were intended to m<strong>on</strong>itor lateraldeformati<strong>on</strong>s at shallow depths and hopefully to relatemovements at the toe to lateral spreading and l<strong>on</strong>gitudinalcracking <str<strong>on</strong>g>of</str<strong>on</strong>g> the road surface. Unfortunately, theextensometer at the stable secti<strong>on</strong> failed shortly afterinstallati<strong>on</strong>. Figure 6 shows horiz<strong>on</strong>tal strains at the toe <str<strong>on</strong>g>of</str<strong>on</strong>g>the unstable secti<strong>on</strong> plotted against time over a 28 m<strong>on</strong>thperiod in 2008-2011.
28-Mar-0906-Jul-0914-Oct-0922-Jan-1002-May-1010-Aug-1018-Nov-1026-Feb-11Depth (m)Horiz<strong>on</strong>tal (m)28-Mar-0906-Jul-0914-Oct-0922-Jan-1002-May-1010-Aug-1018-Nov-1026-Feb-11Horiz<strong>on</strong>tal (m)Extensometer Horiz<strong>on</strong>tal Strain (%)01-Nov-0809-Feb-0920-May-0928-Aug-0906-Dec-0916-Mar-1024-Jun-1002-Oct-1010-Jan-1106-Jul-0914-Oct-0922-Jan-1002-May-1010-Aug-1018-Nov-1026-Feb-11Depth (m)Horiz<strong>on</strong>tal (m)0.100.050.00-0.05-0.100.100.05StableUnstableSurfaceSettlement14.4StableUnstableDown Slopea)Date Down Slopeinclinometer moved Unstable back Secti<strong>on</strong> towards at the Toe (Corrected) the centre <str<strong>on</strong>g>of</str<strong>on</strong>g> the0.80.70.60.50.40.30.20.10.01 4.40Extensometer4200.00-0.05-0.1014.4SurfaceSettlementb)Figure 6. Extensometer horiz<strong>on</strong>tal strain vs. time at 0.8mdepth at the toe <str<strong>on</strong>g>of</str<strong>on</strong>g> the unstable secti<strong>on</strong>0.100.050.00StableUnstableDown Date Slope<str<strong>on</strong>g>embankment</str<strong>on</strong>g>. This is believed to be due to creati<strong>on</strong> <str<strong>on</strong>g>of</str<strong>on</strong>g> iceat the frost fr<strong>on</strong>t during the freezing seas<strong>on</strong> and rearwardsbending <str<strong>on</strong>g>of</str<strong>on</strong>g> the slope indicator casing.SI at Unstable Secti<strong>on</strong>0-0.0514.4SurfaceSettlementc)2-0.104DateFigure 5. Horiz<strong>on</strong>tal movements in down-slope directi<strong>on</strong> atshoulder; mid-slope; and toe <str<strong>on</strong>g>of</str<strong>on</strong>g> the roadThe results in Figure 6 show <strong>on</strong>going outwarddisplacements, currently with about 0.75% horiz<strong>on</strong>talstrains at the toe <str<strong>on</strong>g>of</str<strong>on</strong>g> the unstable secti<strong>on</strong> over a period <str<strong>on</strong>g>of</str<strong>on</strong>g>28 m<strong>on</strong>ths. The figure indicates fairly rapid deformati<strong>on</strong>rates during the first freezing seas<strong>on</strong> (November 2008 toJune 2009). This may be due to natural re-densificati<strong>on</strong> <str<strong>on</strong>g>of</str<strong>on</strong>g>soil around the extensometer following installati<strong>on</strong>. Afterthe first year, from July 2009 to present, the rate <str<strong>on</strong>g>of</str<strong>on</strong>g>horiz<strong>on</strong>tal straining decreased.3.3 Lateral Displacements from Slope Inclinometers atDepthSlope inclinometers were installed beneath the toes <str<strong>on</strong>g>of</str<strong>on</strong>g> the<str<strong>on</strong>g>embankment</str<strong>on</strong>g>s at both secti<strong>on</strong>s. The lateral movementsbeneath the toe <str<strong>on</strong>g>of</str<strong>on</strong>g> the stable secti<strong>on</strong> are small and will notbe discussed here. Figure 7 shows cumulativedisplacements measured by the slope inclinometer at thetoe <str<strong>on</strong>g>of</str<strong>on</strong>g> the unstable secti<strong>on</strong>. The figure shows that theinclinometer experienced lateral displacements away fromthe centre <str<strong>on</strong>g>of</str<strong>on</strong>g> the <str<strong>on</strong>g>embankment</str<strong>on</strong>g> at depths greater thanabout 3m. Maximum displacement <str<strong>on</strong>g>of</str<strong>on</strong>g> about 0.09m occursat a depth <str<strong>on</strong>g>of</str<strong>on</strong>g> 8m. At shallower depths, the slope68101214161819-Jun-0927-Jul-0930-Sep-0921-Jan-1015-Mar-1015-Jun-1016-Aug-1004-Oct-1016-Nov-1026-Jan-11-0.04 -0.03 -0.02 -0.01 0 0.01Cumulative Displacement (m)Figure 7. Slope Inclinometer at the toe <str<strong>on</strong>g>of</str<strong>on</strong>g> the unstablesecti<strong>on</strong>In general, the combined surface and deepmeasurements <str<strong>on</strong>g>of</str<strong>on</strong>g> displacements show that the cumulativemovements <str<strong>on</strong>g>of</str<strong>on</strong>g> the <str<strong>on</strong>g>embankment</str<strong>on</strong>g> are largely downward atthe shoulder and smaller at the toe. The resulting shearstrains push the lower levels <str<strong>on</strong>g>of</str<strong>on</strong>g> clay horiz<strong>on</strong>tally awayfrom the centre <str<strong>on</strong>g>of</str<strong>on</strong>g> the <str<strong>on</strong>g>embankment</str<strong>on</strong>g> at greater depths.
01-Nov-0809-Feb-0920-May-0928-Aug-0906-Dec-0916-Mar-1024-Jun-1002-Oct-1010-Jan-11Total Head (m)Depth (m)01-Nov-0809-Feb-0920-May-0928-Aug-0906-Dec-0916-Mar-1024-Jun-1002-Oct-1010-Jan-11Total Head (m)Depth (m)3.4 Ground Water DataFigures 8a and 8b show total heads plotted against time(indicated here as dates) at two different depths in thestable and unstable secti<strong>on</strong>s respectively. (Rememberthat the silty clay is much thicker beneath the unstablesecti<strong>on</strong> [Figure 2].) The figures imply seas<strong>on</strong>al changes inthe gradients <str<strong>on</strong>g>of</str<strong>on</strong>g> total head at both secti<strong>on</strong>s. Ground waterc<strong>on</strong>diti<strong>on</strong>s appear to be broadly hydrostatic duringsummer m<strong>on</strong>ths, with the ground water levelapproximately at the ground surface. During freezing,upwards gradients develop. These are believed to becaused by upward flow <str<strong>on</strong>g>of</str<strong>on</strong>g> water towards sucti<strong>on</strong> pressures(negative potentials) at the freezing fr<strong>on</strong>t as it movesdownwards during the winter.Stable Secti<strong>on</strong> at the Toe1.51Depth (m)a)3.40.51.50-0.5-1-1.5-21.510.50-0.5-1-1.5-2Unstable Secti<strong>on</strong> at the ToeDepth (m)8.74.5b)3.5 Ground TemperaturesFigures 9 and 10 show minimum, average, and maximumtemperature pr<str<strong>on</strong>g>of</str<strong>on</strong>g>iles with depth for the unstable and stablesecti<strong>on</strong>s respectively, for years 2008-09 and 2009-10.Please note the different scales used for depths in thesefigures. They arise from the different thicknesses <str<strong>on</strong>g>of</str<strong>on</strong>g> thefoundati<strong>on</strong> soils under the two secti<strong>on</strong>s, (Figure 2). Again,the original ground level is at depth ‘0’.Unstable Secti<strong>on</strong>, Mid SlopeTemperature (˚C)-6 -4 -2 0 2 4 6 8 10 12 14 16 18 20-10123456789101145678910MinAveMax2008-092009-10Unstable Secti<strong>on</strong>, ToeTemperature (˚C)-6 -4 -2 0 2 4 6 8 10 12 14 16 18 200123MinAveMaxb)a)2008-092009-10Figure 8. Total head vs. time at different depths at the toe<str<strong>on</strong>g>of</str<strong>on</strong>g> the a) stable secti<strong>on</strong>; b) unstable secti<strong>on</strong>The effects <str<strong>on</strong>g>of</str<strong>on</strong>g> frost acti<strong>on</strong> involve a combinati<strong>on</strong> <str<strong>on</strong>g>of</str<strong>on</strong>g>frost heave during a downward advance <str<strong>on</strong>g>of</str<strong>on</strong>g> the freezingfr<strong>on</strong>t, with the accompanying formati<strong>on</strong> <str<strong>on</strong>g>of</str<strong>on</strong>g> ice lenses; anda subsequent reducti<strong>on</strong> <str<strong>on</strong>g>of</str<strong>on</strong>g> shear strengths and highercompressibilities when the ice melts during the springthaw (Andersland and Ladanyi, 2004).Figure 9. Annual temperature envelopes betweenNovember 2008 and October 2010 for the unstablesecti<strong>on</strong> at the a) mid-slope; b) toeThe figures show temperatures measured by thethermistor clusters at the toes and mid-slopes <str<strong>on</strong>g>of</str<strong>on</strong>g> bothsecti<strong>on</strong>s. ‘Geothermal gradient’ is the rate <str<strong>on</strong>g>of</str<strong>on</strong>g> change <str<strong>on</strong>g>of</str<strong>on</strong>g>temperature with depth in the ground. When averagetemperatures are examined in this way, the slope <str<strong>on</strong>g>of</str<strong>on</strong>g> theaverage temperature pr<str<strong>on</strong>g>of</str<strong>on</strong>g>ile can be taken as anapproximate indicator <str<strong>on</strong>g>of</str<strong>on</strong>g> net heat flow into, or out from, theground surface over a period <str<strong>on</strong>g>of</str<strong>on</strong>g> <strong>on</strong>e year.
Depth (m)Depth (m)Depth (m)Depth (m)Stable Secti<strong>on</strong>, Mid SlopeTemperature (˚C)-6 -4 -2 0 2 4 6 8 10 12 14 16 18 20-10Min AveMax12342008-092009-105Stable Secti<strong>on</strong>, ToeTemperature (˚C)-6 -4 -2 0 2 4 6 8 10 12 14 16 18 200AveMaxMin12342008-092009-10Figure 10. Annual temperature envelopes betweenNovember 2008 and October 2010 for the stablesecti<strong>on</strong> at the a) mid-slope; b) toeFigures 9 and 10 show average temperature pr<str<strong>on</strong>g>of</str<strong>on</strong>g>ilesover two years at the four instrumented locati<strong>on</strong>s, that isat the toes and mid-slopes <str<strong>on</strong>g>of</str<strong>on</strong>g> the two test secti<strong>on</strong>s. Nosub-zero temperatures were observed during 2008-09 and2009-10. The average temperatures at all four locati<strong>on</strong>sdecrease with increasing depth. This indicates a net heatflux into the foundati<strong>on</strong> soils. It also supports theobservati<strong>on</strong>s in an earlier secti<strong>on</strong> that initially frozen soilhas thawed during the lifetime <str<strong>on</strong>g>of</str<strong>on</strong>g> the soil - there has beengeneral warming <str<strong>on</strong>g>of</str<strong>on</strong>g> the <str<strong>on</strong>g>embankment</str<strong>on</strong>g>s and theirfoundati<strong>on</strong>s.Figure 11 shows the m<strong>on</strong>thly temperature pr<str<strong>on</strong>g>of</str<strong>on</strong>g>iles for<strong>on</strong>e cycle <str<strong>on</strong>g>of</str<strong>on</strong>g> cooling and heating between November 2009and October 2010. The two graphs in Figure 11 c<strong>on</strong>taindata from instrument clusters at a) mid-slope and b) toefor the unstable secti<strong>on</strong>. (For reas<strong>on</strong>s <str<strong>on</strong>g>of</str<strong>on</strong>g> space andclarity, we are not including observati<strong>on</strong>s from 2008-2009and 2010-2011.)With increasing depths, seas<strong>on</strong>al differences intemperature become less. The depth <str<strong>on</strong>g>of</str<strong>on</strong>g> zero annualtemperature amplitude is the depth at which the seas<strong>on</strong>alvariati<strong>on</strong>s <str<strong>on</strong>g>of</str<strong>on</strong>g> temperatures are essentially zero(Andersland and Ladanyi, 2004). Figures 11a and 11bshow that the depth <str<strong>on</strong>g>of</str<strong>on</strong>g> zero annual amplitude at thea)b)unstable secti<strong>on</strong> is about 8 – 9m below the original ground012345678910Unstable Secti<strong>on</strong>, Mid Slope, Nov 09-Oct 10Temperature (˚C)-6 -4 -2 0 2 4 6 8 10 12 14 16 18 20-10a)123402-Nov-09 15-Nov-09505-Dec-09 21-Jan-10619-Feb-10 15-Mar-10714-Apr-10 15-May-10815-Jun-10 16-Jul-10916-Aug-10 13-Sep-101025-Sep-10 04-Oct-1011Unstable Secti<strong>on</strong>, Toe, Nov 09-Oct 10Temperature (˚C)-6 -4 -2 0 2 4 6 8 10 12 14 16 18 2002-Nov-0905-Dec-0919-Feb-1014-Apr-1015-Jun-1016-Aug-1025-Sep-1015-Nov-0921-Jan-1015-Mar-1015-May-1016-Jul-1013-Sep-1004-Oct-10Figure 11. M<strong>on</strong>thly temperature pr<str<strong>on</strong>g>of</str<strong>on</strong>g>iles betweenNovember 2009 and October 2010 for the unstablesecti<strong>on</strong> at the a) mid-slope; b) toelevel.The respective temperatures pr<str<strong>on</strong>g>of</str<strong>on</strong>g>iles for the mid-slopeand toe c<strong>on</strong>verge at about the same depth, although thereis approximately a 1.6°C difference between the twovalues. The soil underneath the <str<strong>on</strong>g>embankment</str<strong>on</strong>g> is colderthan soil at the same depth underneath the toe. It isbelieved that this can be explained by the previouspresence and thawing <str<strong>on</strong>g>of</str<strong>on</strong>g> a frost bulb underneath the<str<strong>on</strong>g>embankment</str<strong>on</strong>g> or alternatively by differences in thermalc<strong>on</strong>ductivity between gravel in the <str<strong>on</strong>g>embankment</str<strong>on</strong>g> and clayin the foundati<strong>on</strong> soils. This observati<strong>on</strong> could have beenverified if thermistor strings had been installed under thecentre <str<strong>on</strong>g>of</str<strong>on</strong>g> the <str<strong>on</strong>g>embankment</str<strong>on</strong>g>. Perhaps unfortunately, safety,snow clearing, and grading made this impossible. Coolertemperatures beneath the <str<strong>on</strong>g>embankment</str<strong>on</strong>g> may also be dueto an insulating cover <str<strong>on</strong>g>of</str<strong>on</strong>g> snow beneath the toe, combinedwith the effects <str<strong>on</strong>g>of</str<strong>on</strong>g> show clearing <strong>on</strong> the roadway.4 SUMMARYb)
The paper reports and analyzes measurements <str<strong>on</strong>g>of</str<strong>on</strong>g> surfacesettlements, toe displacements, pore water pressures andtemperatures from a low <str<strong>on</strong>g>highway</str<strong>on</strong>g> <str<strong>on</strong>g>embankment</str<strong>on</strong>g> nearThomps<strong>on</strong> in northern Manitoba.The deformati<strong>on</strong> results indicate a combinati<strong>on</strong> <str<strong>on</strong>g>of</str<strong>on</strong>g>seas<strong>on</strong>al and cumulative displacements, with largerdisplacements at the toe than at the shoulder. The resultsshow a combinati<strong>on</strong> <str<strong>on</strong>g>of</str<strong>on</strong>g> seas<strong>on</strong>al heaving and lateralspreading. The pore water pressure results suggest thedevelopment <str<strong>on</strong>g>of</str<strong>on</strong>g> cyclic seas<strong>on</strong>al gradients <str<strong>on</strong>g>of</str<strong>on</strong>g> total head.These indicate hydrostatic water pressure c<strong>on</strong>diti<strong>on</strong>sduring summer m<strong>on</strong>ths and upwards flow during thefreezing seas<strong>on</strong>. Measured temperatures also showedseas<strong>on</strong>al changes. Net heat flow into the ground ispossibly a c<strong>on</strong>firmati<strong>on</strong> <str<strong>on</strong>g>of</str<strong>on</strong>g> general warming in the area,although it we note that <strong>on</strong>ly two years <str<strong>on</strong>g>of</str<strong>on</strong>g> readings havebeen collected. The data c<strong>on</strong>firm field observati<strong>on</strong>s <str<strong>on</strong>g>of</str<strong>on</strong>g> thethawing <str<strong>on</strong>g>of</str<strong>on</strong>g> ice that was present in the first drilling <str<strong>on</strong>g>of</str<strong>on</strong>g> thesite in 1991 but absent in recent drilling in 2008.ACKNOWLEDGEMENTSFinancial support was provided by the Natural Sciencesand Engineering Research Council <str<strong>on</strong>g>of</str<strong>on</strong>g> Canada (NSERC)and by Manitoba Infrastructure and Transportati<strong>on</strong> (MIT).Technical and logistical support was provided by KerryLynch at the University <str<strong>on</strong>g>of</str<strong>on</strong>g> Manitoba, by engineers andtechnologists <str<strong>on</strong>g>of</str<strong>on</strong>g> Manitoba Infrastructure andTransportati<strong>on</strong> in Winnipeg and Thomps<strong>on</strong>, and by KellyBindle at Bindle Engineering in Thomps<strong>on</strong> MB.REFERENCESAndersland, O.B. and Ladanyi, B., (2004). Frozen GroundEngineering (2nd Editi<strong>on</strong>). John Wiley & S<strong>on</strong>s.Batenipour, H., Kurz, D., Alfaro, M., and Graham, J.2009a. Effect <str<strong>on</strong>g>of</str<strong>on</strong>g> Temperature <strong>on</strong> the 1-D Behaviour<str<strong>on</strong>g>of</str<strong>on</strong>g> Plastic Clay. In Proceedings <str<strong>on</strong>g>of</str<strong>on</strong>g> 62 nd CanadianGeotechnical C<strong>on</strong>ference, Halifax NS, September2009, pp. 47-52.Batenipour, H., Kurz, D.R., Alfaro, M.C., Graham, J. andNg, T.N.S., 2009b. Highway Embankment <strong>on</strong>Degrading Permafrost. In proceedings <str<strong>on</strong>g>of</str<strong>on</strong>g> the 14thC<strong>on</strong>ference <strong>on</strong> Cold Regi<strong>on</strong>s Engineering in Duluth,Minnesota, USA, pp. 512-521.Batenipour, H., Kurz, D.R., Alfaro, M.C., Graham, J. andKalynuk, K., 2010. Results from an InstrumentedHighway Embankment <strong>on</strong> Degraded Permafrost. Inproceedings <str<strong>on</strong>g>of</str<strong>on</strong>g> the 63 rd Canadian GeotechnicalC<strong>on</strong>ference & 6 th Canadian Permafrost C<strong>on</strong>ference.Calgary: 512-519.Brown, R.J.E. 1967. Permafrost in Canada. Canada,Geological Survey Map 124A, first editi<strong>on</strong>.CCCSN (Canadian Climate Change Scenarios Network)2009. Arctic Ensemble Scenarios.Hinkel, K.M., Nels<strong>on</strong> F.E., Park W., Romanovsky V.,Smith O., Tucker W., Vins<strong>on</strong> T. and Brigham L.W.,2003. Climate Change, Permafrost, and Impacts <strong>on</strong>Civil Infrastructure, United States Arctic ResearchCommissi<strong>on</strong>: Permafrost Task Force Report, SpecialReport 01-03.IPCC (Intergovernmental Panel <strong>on</strong> Climate Change)2007. Summary for policymakers. In: Climate change2007: The physical science basis. C<strong>on</strong>tributi<strong>on</strong> <str<strong>on</strong>g>of</str<strong>on</strong>g>Working Group I to the Fourth Assessment Report <str<strong>on</strong>g>of</str<strong>on</strong>g>the Intergovernmental Panel <strong>on</strong> Climate Change. S.Solom<strong>on</strong>; D. Qin; M. Manning; Z. Chen; M. Marquis;K.B. Averyt; M.Tignor; H.L. Miller (eds.). Cambridge,UK, and New York, NY: Cambridge University Press.K<strong>on</strong>rad, J.-M. 2008. Freezing-induced water migrati<strong>on</strong> incompacted base-course materials. CanadianGeotechnical Journal 45, 895-909.Koyama, M. and Sasaki, H,, 1967. Frost Heave <str<strong>on</strong>g>of</str<strong>on</strong>g> Roadsin Hokkaido and Its Countermeasures, Physics <str<strong>on</strong>g>of</str<strong>on</strong>g>Snow and Ice : proceedings, 1(2): 1323-1331Nels<strong>on</strong>, F.E. and Outcalt, S.I.: 1982, Anthropogenicgeomorphology in northern Alaska, PhysicalGeography 3, 17–48.Osterkamp, T.E. and Lachenbruch, A.H. 1990. Thermalregime <str<strong>on</strong>g>of</str<strong>on</strong>g> <strong>permafrost</strong> in Alaska and predicted globalwarming. ASCE Journal <str<strong>on</strong>g>of</str<strong>on</strong>g> Cold Regi<strong>on</strong>s Engineering4, 38-42.Williams, P. J. 1986, Pipelines & Permafrost: Science in aCold Climate, Carlet<strong>on</strong> University Press, D<strong>on</strong> Mills,Ontario, 129 pp.