Deformations of a highway embankment on degraded permafrost
Deformations of a highway embankment on degraded permafrost
Deformations of a highway embankment on degraded permafrost

Create successful ePaper yourself
Turn your PDF publications into a flip-book with our unique Google optimized e-Paper software.
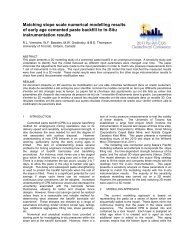
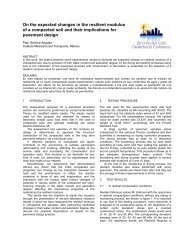
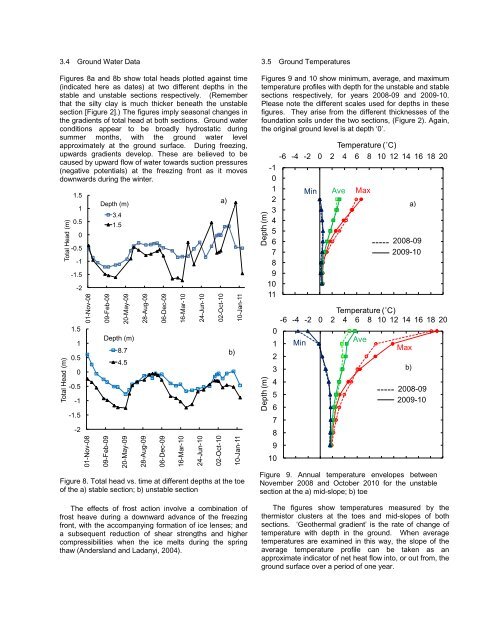
01-Nov-0809-Feb-0920-May-0928-Aug-0906-Dec-0916-Mar-1024-Jun-1002-Oct-1010-Jan-11Total Head (m)Depth (m)01-Nov-0809-Feb-0920-May-0928-Aug-0906-Dec-0916-Mar-1024-Jun-1002-Oct-1010-Jan-11Total Head (m)Depth (m)3.4 Ground Water DataFigures 8a and 8b show total heads plotted against time(indicated here as dates) at two different depths in thestable and unstable secti<strong>on</strong>s respectively. (Rememberthat the silty clay is much thicker beneath the unstablesecti<strong>on</strong> [Figure 2].) The figures imply seas<strong>on</strong>al changes inthe gradients <str<strong>on</strong>g>of</str<strong>on</strong>g> total head at both secti<strong>on</strong>s. Ground waterc<strong>on</strong>diti<strong>on</strong>s appear to be broadly hydrostatic duringsummer m<strong>on</strong>ths, with the ground water levelapproximately at the ground surface. During freezing,upwards gradients develop. These are believed to becaused by upward flow <str<strong>on</strong>g>of</str<strong>on</strong>g> water towards sucti<strong>on</strong> pressures(negative potentials) at the freezing fr<strong>on</strong>t as it movesdownwards during the winter.Stable Secti<strong>on</strong> at the Toe1.51Depth (m)a)3.40.51.50-0.5-1-1.5-21.510.50-0.5-1-1.5-2Unstable Secti<strong>on</strong> at the ToeDepth (m)8.74.5b)3.5 Ground TemperaturesFigures 9 and 10 show minimum, average, and maximumtemperature pr<str<strong>on</strong>g>of</str<strong>on</strong>g>iles with depth for the unstable and stablesecti<strong>on</strong>s respectively, for years 2008-09 and 2009-10.Please note the different scales used for depths in thesefigures. They arise from the different thicknesses <str<strong>on</strong>g>of</str<strong>on</strong>g> thefoundati<strong>on</strong> soils under the two secti<strong>on</strong>s, (Figure 2). Again,the original ground level is at depth ‘0’.Unstable Secti<strong>on</strong>, Mid SlopeTemperature (˚C)-6 -4 -2 0 2 4 6 8 10 12 14 16 18 20-10123456789101145678910MinAveMax2008-092009-10Unstable Secti<strong>on</strong>, ToeTemperature (˚C)-6 -4 -2 0 2 4 6 8 10 12 14 16 18 200123MinAveMaxb)a)2008-092009-10Figure 8. Total head vs. time at different depths at the toe<str<strong>on</strong>g>of</str<strong>on</strong>g> the a) stable secti<strong>on</strong>; b) unstable secti<strong>on</strong>The effects <str<strong>on</strong>g>of</str<strong>on</strong>g> frost acti<strong>on</strong> involve a combinati<strong>on</strong> <str<strong>on</strong>g>of</str<strong>on</strong>g>frost heave during a downward advance <str<strong>on</strong>g>of</str<strong>on</strong>g> the freezingfr<strong>on</strong>t, with the accompanying formati<strong>on</strong> <str<strong>on</strong>g>of</str<strong>on</strong>g> ice lenses; anda subsequent reducti<strong>on</strong> <str<strong>on</strong>g>of</str<strong>on</strong>g> shear strengths and highercompressibilities when the ice melts during the springthaw (Andersland and Ladanyi, 2004).Figure 9. Annual temperature envelopes betweenNovember 2008 and October 2010 for the unstablesecti<strong>on</strong> at the a) mid-slope; b) toeThe figures show temperatures measured by thethermistor clusters at the toes and mid-slopes <str<strong>on</strong>g>of</str<strong>on</strong>g> bothsecti<strong>on</strong>s. ‘Geothermal gradient’ is the rate <str<strong>on</strong>g>of</str<strong>on</strong>g> change <str<strong>on</strong>g>of</str<strong>on</strong>g>temperature with depth in the ground. When averagetemperatures are examined in this way, the slope <str<strong>on</strong>g>of</str<strong>on</strong>g> theaverage temperature pr<str<strong>on</strong>g>of</str<strong>on</strong>g>ile can be taken as anapproximate indicator <str<strong>on</strong>g>of</str<strong>on</strong>g> net heat flow into, or out from, theground surface over a period <str<strong>on</strong>g>of</str<strong>on</strong>g> <strong>on</strong>e year.