MS Word Technical Paper Template
MS Word Technical Paper Template
MS Word Technical Paper Template

You also want an ePaper? Increase the reach of your titles
YUMPU automatically turns print PDFs into web optimized ePapers that Google loves.
et al. 1999). Different reconstitution methods result in<br />
different fabric, and the method of reconstitution used in<br />
the laboratory should simulate the natural deposition<br />
process, if laboratory results are to be applied to in-situ<br />
soils with confidence.<br />
Simple shear tests in this research study were<br />
conducted on specimens reconstituted using the dry<br />
pluviation method. This technique yields uniform and<br />
repeatable specimens, which is a key requirement in<br />
fundamental studies that attempt to assess the effects of<br />
state variables. Fraser Delta sands are deposited in a<br />
fluvial environment in nature, and hence water pluviation<br />
would have been better at simulating the natural<br />
deposition process. However, previous studies show that<br />
differences between the two pluviation techniques are<br />
relatively minor in clean sands (Vaid et al. 1999), and the<br />
presence of fines is generally responsible for the<br />
structural differences (McGowan 1974) between pluviated<br />
specimens. Both sands tested herein are fairly clean with<br />
negligible amount of fines below #200 sieve, and hence<br />
both pluviation methods are expected to yield similar<br />
response.<br />
Specimens were reconstituted at the loosest state,<br />
and higher densities, when needed were obtained by<br />
applying low-energy, high frequency vertical vibrations<br />
under a small seating load of about 5 kPa. Void ratio of<br />
the specimens was confidently determined using the<br />
volume of the cavity and mass of the solids. After<br />
reconstitution specimens were moved to the simple shear<br />
device and a seating load of about 15 kPa was applied.<br />
Consolidation stresses were applied along the required α<br />
line for initial states with a static shear stress on the<br />
horizontal plane. Target OCR values were realised by<br />
loading, and unloading the specimen along the same α<br />
line. Consolidation process of specimens without initial<br />
static shear is similar to 1-D consolidation, and 1-D<br />
rebound in the case of overconsolidated specimens.<br />
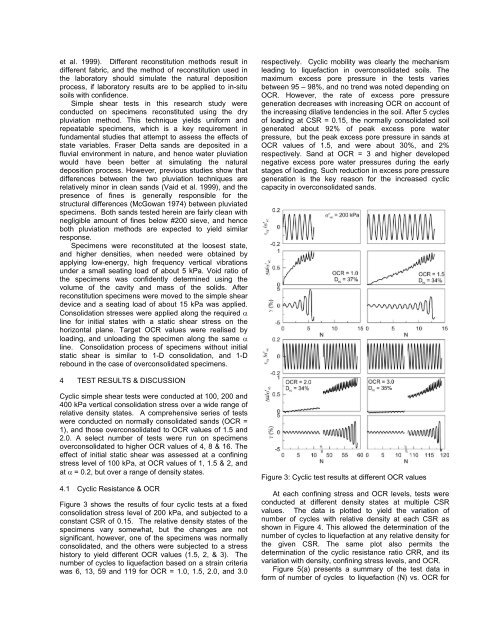
respectively. Cyclic mobility was clearly the mechanism<br />
leading to liquefaction in overconsolidated soils. The<br />
maximum excess pore pressure in the tests varies<br />
between 95 – 98%, and no trend was noted depending on<br />
OCR. However, the rate of excess pore pressure<br />
generation decreases with increasing OCR on account of<br />
the increasing dilative tendencies in the soil. After 5 cycles<br />
of loading at CSR = 0.15, the normally consolidated soil<br />
generated about 92% of peak excess pore water<br />
pressure, but the peak excess pore pressure in sands at<br />
OCR values of 1.5, and were about 30%, and 2%<br />
respectively. Sand at OCR = 3 and higher developed<br />
negative excess pore water pressures during the early<br />
stages of loading. Such reduction in excess pore pressure<br />
generation is the key reason for the increased cyclic<br />
capacity in overconsolidated sands.<br />
4 TEST RESULTS & DISCUSSION<br />
Cyclic simple shear tests were conducted at 100, 200 and<br />
400 kPa vertical consolidation stress over a wide range of<br />
relative density states. A comprehensive series of tests<br />
were conducted on normally consolidated sands (OCR =<br />
1), and those overconsolidated to OCR values of 1.5 and<br />
2.0. A select number of tests were run on specimens<br />
overconsolidated to higher OCR values of 4, 8 & 16. The<br />
effect of initial static shear was assessed at a confining<br />
stress level of 100 kPa, at OCR values of 1, 1.5 & 2, and<br />
at α = 0.2, but over a range of density states.<br />
4.1 Cyclic Resistance & OCR<br />
Figure 3 shows the results of four cyclic tests at a fixed<br />
consolidation stress level of 200 kPa, and subjected to a<br />
constant CSR of 0.15. The relative density states of the<br />
specimens vary somewhat, but the changes are not<br />
significant, however, one of the specimens was normally<br />
consolidated, and the others were subjected to a stress<br />
history to yield different OCR values (1.5, 2, & 3). The<br />
number of cycles to liquefaction based on a strain criteria<br />
was 6, 13, 59 and 119 for OCR = 1.0, 1.5, 2.0, and 3.0<br />
Figure 3: Cyclic test results at different OCR values<br />
At each confining stress and OCR levels, tests were<br />
conducted at different density states at multiple CSR<br />
values. The data is plotted to yield the variation of<br />
number of cycles with relative density at each CSR as<br />
shown in Figure 4. This allowed the determination of the<br />
number of cycles to liquefaction at any relative density for<br />
the given CSR. The same plot also permits the<br />
determination of the cyclic resistance ratio CRR, and its<br />
variation with density, confining stress levels, and OCR.<br />
Figure 5(a) presents a summary of the test data in<br />
form of number of cycles to liquefaction (N) vs. OCR for