MS Word Technical Paper Template
MS Word Technical Paper Template
MS Word Technical Paper Template

Create successful ePaper yourself
Turn your PDF publications into a flip-book with our unique Google optimized e-Paper software.
4.3 Influence of OCR on K σ and K α factors<br />
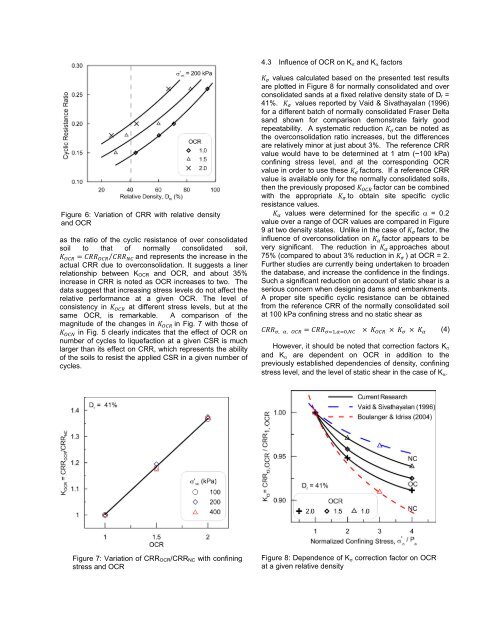
Figure 6: Variation of CRR with relative density<br />
and OCR<br />
as the ratio of the cyclic resistance of over consolidated<br />
soil to that of normally consolidated soil,<br />
K OCR = CRR OCR ⁄ CRR NC and represents the increase in the<br />
actual CRR due to overconsolidation. It suggests a liner<br />
relationship between K OCR and OCR, and about 35%<br />
increase in CRR is noted as OCR increases to two. The<br />
data suggest that increasing stress levels do not affect the<br />
relative performance at a given OCR. The level of<br />
consistency in K OCR at different stress levels, but at the<br />
same OCR, is remarkable. A comparison of the<br />
magnitude of the changes in K OCR in Fig. 7 with those of<br />
K OCN in Fig. 5 clearly indicates that the effect of OCR on<br />
number of cycles to liquefaction at a given CSR is much<br />
larger than its effect on CRR, which represents the ability<br />
of the soils to resist the applied CSR in a given number of<br />
cycles.<br />
K σ values calculated based on the presented test results<br />
are plotted in Figure 8 for normally consolidated and over<br />
consolidated sands at a fixed relative density state of D r =<br />
41%. K σ values reported by Vaid & Sivathayalan (1996)<br />
for a different batch of normally consolidated Fraser Delta<br />
sand shown for comparison demonstrate fairly good<br />
repeatability. A systematic reduction K σ can be noted as<br />
the overconsolidation ratio increases, but the differences<br />
are relatively minor at just about 3%. The reference CRR<br />
value would have to be determined at 1 atm (~100 kPa)<br />
confining stress level, and at the corresponding OCR<br />
value in order to use these K σ factors. If a reference CRR<br />
value is available only for the normally consolidated soils,<br />
then the previously proposed K OCR factor can be combined<br />
with the appropriate K σ to obtain site specific cyclic<br />
resistance values.<br />
K α values were determined for the specific α = 0.2<br />
value over a range of OCR values are compared in Figure<br />
9 at two density states. Unlike in the case of K σ factor, the<br />
influence of overconsolidation on K α factor appears to be<br />
very significant. The reduction in K α approaches about<br />
75% (compared to about 3% reduction in K σ ) at OCR = 2.<br />
Further studies are currently being undertaken to broaden<br />
the database, and increase the confidence in the findings.<br />
Such a significant reduction on account of static shear is a<br />
serious concern when designing dams and embankments.<br />
A proper site specific cyclic resistance can be obtained<br />
from the reference CRR of the normally consolidated soil<br />
at 100 kPa confining stress and no static shear as<br />
CRR σ, α, OCR = CRR σ=1,α=0,NC × K OCR × K σ × K α (4)<br />
However, it should be noted that correction factors K σ<br />
and K α are dependent on OCR in addition to the<br />
previously established dependencies of density, confining<br />
stress level, and the level of static shear in the case of K α .<br />
Figure 7: Variation of CRR OCR/CRR NC with confining<br />
stress and OCR<br />
Figure 8: Dependence of K σ correction factor on OCR<br />
at a given relative density