Guidelines for Calculating Effect Sizes for Practice-Based Research ...
Guidelines for Calculating Effect Sizes for Practice-Based Research ...
Guidelines for Calculating Effect Sizes for Practice-Based Research ...

Create successful ePaper yourself
Turn your PDF publications into a flip-book with our unique Google optimized e-Paper software.
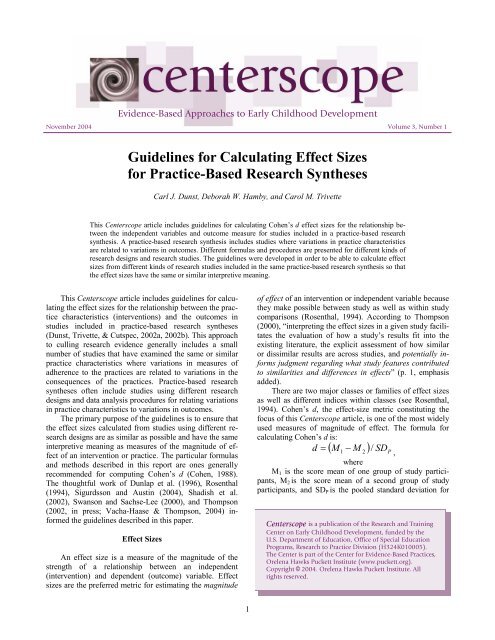
Evidence-<strong>Based</strong> Approaches to Early Childhood Development<br />
November 2004 Volume 3, Number 1<br />
<strong>Guidelines</strong> <strong>for</strong> <strong>Calculating</strong> <strong>Effect</strong> <strong>Sizes</strong><br />
<strong>for</strong> <strong>Practice</strong>-<strong>Based</strong> <strong>Research</strong> Syntheses<br />
Carl J. Dunst, Deborah W. Hamby, and Carol M. Trivette<br />
This Centerscope article includes guidelines <strong>for</strong> calculating Cohen’s d effect sizes <strong>for</strong> the relationship between<br />
the independent variables and outcome measure <strong>for</strong> studies included in a practice-based research<br />
synthesis. A practice-based research synthesis includes studies where variations in practice characteristics<br />
are related to variations in outcomes. Different <strong>for</strong>mulas and procedures are presented <strong>for</strong> different kinds of<br />
research designs and research studies. The guidelines were developed in order to be able to calculate effect<br />
sizes from different kinds of research studies included in the same practice-based research synthesis so that<br />
the effect sizes have the same or similar interpretive meaning.<br />
This Centerscope article includes guidelines <strong>for</strong> calculating<br />
the effect sizes <strong>for</strong> the relationship between the practice<br />
characteristics (interventions) and the outcomes in<br />
studies included in practice-based research syntheses<br />
(Dunst, Trivette, & Cutspec, 2002a, 2002b). This approach<br />
to culling research evidence generally includes a small<br />
number of studies that have examined the same or similar<br />
practice characteristics where variations in measures of<br />
adherence to the practices are related to variations in the<br />
consequences of the practices. <strong>Practice</strong>-based research<br />
syntheses often include studies using different research<br />
designs and data analysis procedures <strong>for</strong> relating variations<br />
in practice characteristics to variations in outcomes.<br />
The primary purpose of the guidelines is to ensure that<br />
the effect sizes calculated from studies using different research<br />
designs are as similar as possible and have the same<br />
interpretive meaning as measures of the magnitude of effect<br />
of an intervention or practice. The particular <strong>for</strong>mulas<br />
and methods described in this report are ones generally<br />
recommended <strong>for</strong> computing Cohen’s d (Cohen, 1988).<br />
The thoughtful work of Dunlap et al. (1996), Rosenthal<br />
(1994), Sigurdsson and Austin (2004), Shadish et al.<br />
(2002), Swanson and Sachse-Lee (2000), and Thompson<br />
(2002, in press; Vacha-Haase & Thompson, 2004) in<strong>for</strong>med<br />
the guidelines described in this paper.<br />
<strong>Effect</strong> <strong>Sizes</strong><br />
An effect size is a measure of the magnitude of the<br />
strength of a relationship between an independent<br />
(intervention) and dependent (outcome) variable. <strong>Effect</strong><br />
sizes are the preferred metric <strong>for</strong> estimating the magnitude<br />
of effect of an intervention or independent variable because<br />
they make possible between study as well as within study<br />
comparisons (Rosenthal, 1994). According to Thompson<br />
(2000), “interpreting the effect sizes in a given study facilitates<br />
the evaluation of how a study’s results fit into the<br />
existing literature, the explicit assessment of how similar<br />
or dissimilar results are across studies, and potentially in<strong>for</strong>ms<br />
judgment regarding what study features contributed<br />
to similarities and differences in effects” (p. 1, emphasis<br />
added).<br />
There are two major classes or families of effect sizes<br />
as well as different indices within classes (see Rosenthal,<br />
1994). Cohen’s d, the effect-size metric constituting the<br />
focus of this Centerscope article, is one of the most widely<br />
used measures of magnitude of effect. The <strong>for</strong>mula <strong>for</strong><br />
calculating Cohen’s d is:<br />
( M1 − M ) SDP<br />
d = /<br />
2 ,<br />
where<br />
M 1 is the score mean of one group of study participants,<br />
M 2 is the score mean of a second group of study<br />
participants, and SD P is the pooled standard deviation <strong>for</strong><br />
Centerscope is a publication of the <strong>Research</strong> and Training<br />
Center on Early Childhood Development, funded by the<br />
U.S. Department of Education, Office of Special Education<br />
Programs, <strong>Research</strong> to <strong>Practice</strong> Division (H324K010005).<br />
The Center is part of the Center <strong>for</strong> Evidence-<strong>Based</strong> <strong>Practice</strong>s,<br />
Orelena Hawks Puckett Institute (www.puckett.org).<br />
Copyright © 2004. Orelena Hawks Puckett Institute. All<br />
rights reserved.<br />
1
oth groups of study participants. In instances where the<br />
groups have been exposed to different experiences (e.g.,<br />
intervention), d is a measure of the magnitude of effect of<br />
the experience on the group receiving the enhanced opportunity.<br />
There is still no generally agreed upon standards <strong>for</strong><br />
interpreting the magnitude of effect sizes. Although<br />
Cohen’s (1977, 1988) original guidelines that d = .20 is a<br />
“small,” d = .50 is a “medium,” and d = .80 is a “large”<br />
effect size are still widely cited and used <strong>for</strong> interpreting<br />
magnitudes of effect (e.g., McCartney & Rosenthal, 2000),<br />
Glass, McGaw and Smith (1981) noted that “there is no<br />
wisdom…associat[ing] regions of the effect-size metric<br />
with descriptive adjectives such as ‘small,’ ‘moderate,’<br />
‘large,’ and the like” (p. 104). According to Lipsey (1998),<br />
however, an effect size of .20 “is a reasonable minimal<br />
effect size level to ask [intervention] research to detect--it<br />
is large enough to potentially represent an effect of practical<br />
significance, but not so small to represent an extreme<br />
outcome <strong>for</strong> intervention research” (p. 45).<br />
<strong>Research</strong>ers’ exposure to effect sizes is often<br />
times done in the context of comparing randomly assigned<br />
study participants to experimental and control conditions<br />
where Cohen’s d is used to estimate the effect or benefit of<br />
the intervention or treatment provided to the experimentalgroup<br />
participants. This often leads to a belief that calculating<br />
effect sizes are applicable only to these types of randomized<br />
design studies. This is not the case. As Thompson<br />
(2000) noted, because an effect size is a parametric measure<br />
and “parametric analyses are part of one general linear<br />
model family, and [they are all] correlational…effect sizes<br />
can be computed in all studies including, both experimental<br />
and non-experimental” (p. 2). As discussed next, the<br />
particular approach to conducting practice-based research<br />
syntheses we have developed <strong>for</strong> identifying evidencebased<br />
practice uses effect sizes as one means <strong>for</strong> ascertaining<br />
the particular practice characteristics that are associated<br />
with observed or reported differences on an outcome<br />
measure.<br />
<strong>Practice</strong>-<strong>Based</strong> <strong>Research</strong> Syntheses<br />
<strong>Practice</strong>-based research syntheses specifically focus<br />
on the characteristics or features of an intervention or environmental<br />
experience that are related to or are associated<br />
with variations in an outcome measure (Bronfenbrenner,<br />
1992). The extent to which the same or similar characteristics<br />
behave or operate in the same way in different studies<br />
provides accumulated evidence about what really matters<br />
in terms of producing desired benefits. The more specific<br />
the characteristics, the more the research evidence directly<br />
in<strong>for</strong>ms the day-to-day practice of interventionists.<br />
A practice-based research synthesis differs from more<br />
traditional reviews of research evidence by an explicit emphasis<br />
on unpacking and disentangling the characteristics,<br />
elements, and features of a practice (experience, opportunity,<br />
etc.) that account <strong>for</strong> the relationship between practice<br />
characteristics and desired benefits. Doing so directly<br />
in<strong>for</strong>ms what an individual (practitioner, parent, etc.) can<br />
do to produce a desired benefit.<br />
Relating variations in practice characteristics to variations<br />
in outcomes can be accomplished using different<br />
research designs and different research methodologies<br />
(Dunst et al., 2002b). This means that any one practicebased<br />
research synthesis could include studies that used<br />
group and single-participant research designs, experimental<br />
and nonexperimental research designs, etc. (see e.g.,<br />
Dunst, 2003).<br />
<strong>Effect</strong> <strong>Sizes</strong><br />
Establishing and interpreting the relationship between<br />
practice characteristics and outcomes can be aided using<br />
effect sizes as a metric <strong>for</strong> ascertaining the relationship<br />
among variables. <strong>Practice</strong>-based research syntheses can<br />
include effect sizes as a way of both discerning strength of<br />
relationship among variables and identifying the particular<br />
practice characteristics that matter most in terms of explaining<br />
the relationship among variables (Dunst et al.,<br />
2002b). For example, in a practice-based reanalysis of a<br />
more traditional research synthesis (De Wolff & van IJzendoorn,<br />
1997), Kassow and Dunst (2004) used effect sizes<br />
as a means <strong>for</strong> identifying the particular features of parental<br />
sensitivity that were most related to secure infant attachment.<br />
Similarly, in a practice-based research synthesis<br />
of the influence of interest-based child learning on behavioral<br />
and developmental competence, Raab and Dunst (in<br />
press) used effect sizes to discern the extent to which personal<br />
compared to situational interests (Renninger, Hidi, &<br />
Krapp, 1992) had like or unlike influences on child outcome.<br />
The usefulness of effect sizes as an interpretive device<br />
depends at least in part on the assumption that the effect<br />
sizes computed <strong>for</strong> individual studies included in a research<br />
synthesis have the same or similar meaning. This<br />
assumption is generally met when a synthesis includes<br />
studies that employed the same research design. This may<br />
not be the case in syntheses that include studies employing<br />
a variety of different research designs. The latter is what<br />
led us to prepare the guidelines in this Centerscope article.<br />
We have attempted to carefully select effect-size <strong>for</strong>mulas<br />
that are applicable to different types of research designs so<br />
as to yield metrics that can be interpreted in the same manner.<br />
<strong>Effect</strong>-Size Formulas<br />
Different effect-size <strong>for</strong>mulas require different in<strong>for</strong>mation<br />
in order to calculate Cohen’s d. Investigators are<br />
likely to find different terms and symbols <strong>for</strong> describing<br />
the means, standard deviations, and other statistics in research<br />
studies. For example, standard deviations may be<br />
represented as SD, sd, S, s, or σ.<br />
Table 1 lists some of the terms, symbols, and statistics<br />
that are likely to be found in research reports. The terms<br />
and symbols used in the <strong>for</strong>mulas below <strong>for</strong> calculating<br />
effect sizes are listed in the second column of the table.<br />
Subscripts are used in the different <strong>for</strong>mulas to differentiate<br />
between different groups or statistics. For example, M E<br />
2
Table 1<br />
Symbols and Terminology Typically Found<br />
in <strong>Research</strong> Reports<br />
<strong>Research</strong><br />
Literature<br />
Centerscope<br />
Term/<br />
Symbol<br />
M, X M Score mean of a dependent<br />
or outcome measure<br />
SD, sd, S,<br />
s, σ<br />
SD<br />
Description<br />
Standard deviation of a score<br />
mean<br />
se, SE SE Standard error of a score mean<br />
N, n N Sample size or number of<br />
participants in a group or study<br />
df df Degrees of freedom<br />
t t Student’s t-test<br />
F F F statistic<br />
χ 2 χ 2 Chi square statistic<br />
r, phi, rho r Correlation<br />
d d Cohen’s d effect size<br />
and M C are used to represent the score means of an experimental<br />
and comparison group, respectively. The last column<br />
of the table provides a brief description or explanation<br />
of the terms.<br />
Table 2 lists <strong>for</strong>mulas <strong>for</strong> calculating Cohen’s d effect<br />
sizes <strong>for</strong> different types of studies using different in<strong>for</strong>mation<br />
provided in research reports. The <strong>for</strong>mulas are<br />
grouped into categories corresponding to independent<br />
group design studies, nonindependent-group design studies,<br />
single-participant design studies, and correlational<br />
design studies. The required in<strong>for</strong>mation and statistics<br />
needed <strong>for</strong> using each <strong>for</strong>mula is listed in the column rows.<br />
A user can easily select the appropriate <strong>for</strong>mula by first<br />
determining the research design used in a study and by<br />
second using the in<strong>for</strong>mation in the research report to select<br />
the appropriate <strong>for</strong>mula <strong>for</strong> calculating Cohen’s d. The<br />
reader is referred to Shadish, Robinson and Lu (1997) and<br />
Thalheimer and Cook (2002, 2003) <strong>for</strong> computer software<br />
packages <strong>for</strong> calculating effect sizes. Clow and Dunst<br />
(2004) have developed EXCEL spreadsheets specifically<br />
<strong>for</strong> calculating effect sizes using the <strong>for</strong>mulas included in<br />
this Centerscope article.<br />
<strong>Calculating</strong> <strong>Effect</strong> <strong>Sizes</strong> <strong>for</strong><br />
Two Independent Groups of Study Participants<br />
The <strong>for</strong>mulas included in this section are used <strong>for</strong> calculating<br />
effect sizes when you have statistical in<strong>for</strong>mation<br />
<strong>for</strong> two different groups of study participants, and you<br />
want to know the magnitude of a treatment or intervention<br />
effect. The <strong>for</strong>mulas yield Cohen’s d <strong>for</strong> an experimental<br />
group vs. comparison group, treatment group vs. control<br />
group, intervention group vs. nonintervention group, etc.<br />
In most cases, the statistics used <strong>for</strong> calculating the effect<br />
size are <strong>for</strong> the measurements obtained after an intervention<br />
or treatment has been administered or experienced,<br />
where the effect size is a measure of the difference or advantage<br />
in the experimental group over and above that of<br />
the control or comparison group. In instances where there<br />
are pretest and posttest scores <strong>for</strong> the experimental and<br />
control groups, the effect-size computations are calculated<br />
<strong>for</strong> the posttest differences between groups.<br />
Computing <strong>Effect</strong> <strong>Sizes</strong> from<br />
Means and Standard Deviations<br />
The <strong>for</strong>mula <strong>for</strong> calculating Cohen’s d using the<br />
means and standard deviations <strong>for</strong> the two independent<br />
groups of study participants when either the sample sizes<br />
or the standard deviations are relatively equal is:<br />
2 2<br />
( M −M<br />
)/<br />
( SD SD )/<br />
2<br />
d =<br />
+<br />
E C<br />
E C<br />
(1)<br />
,<br />
where<br />
M E is the mean score of the experimental (intervention)<br />
group, M C is the mean score <strong>for</strong> the control (comparison)<br />
SD 2<br />
+ 2<br />
/<br />
( ) 2<br />
group, and<br />
SD E 2 2<br />
SD C<br />
E<br />
+ SD C<br />
/ is the pooled standard<br />
deviation <strong>for</strong> the two groups of study participants. Computationally,<br />
d is equal to the mean score of the experimental<br />
(intervention) group minus the mean score of the control<br />
(comparison) group divided by the pooled standard deviation<br />
<strong>for</strong> both groups of study participants. In cases where<br />
the sample sizes in the two groups are not relatively equal,<br />
the denominator term <strong>for</strong> calculating Cohen’s d is:<br />
2<br />
2<br />
([ SD ⋅ N −1] + [ SD ⋅ N −1]<br />
)/<br />
N + N − 2<br />
E<br />
E<br />
C<br />
C<br />
Computing <strong>Effect</strong> <strong>Sizes</strong> from<br />
Means and Standard Errors<br />
<strong>Research</strong> reports sometimes include standard errors of<br />
the mean scores <strong>for</strong> the experimental and comparison<br />
groups rather than standard deviations <strong>for</strong> the mean scores.<br />
The <strong>for</strong>mula <strong>for</strong> calculating the effect size from mean<br />
scores and standard errors of the mean scores is:<br />
2<br />
2<br />
[ SEE<br />
( NE<br />
) + SEC<br />
( NC<br />
)]<br />
d = ( M<br />
E<br />
−MC<br />
)/<br />
(2)<br />
2 ,<br />
where<br />
M E is the mean score of the experimental (intervention)<br />
group, M C is the mean score of the control (comparison)<br />
2<br />
2<br />
[ SE<br />
E<br />
( N<br />
E<br />
) + SE<br />
C<br />
( N )]<br />
2<br />
2 C<br />
[ SE<br />
E<br />
( N<br />
E<br />
) + SE<br />
C<br />
( N<br />
C<br />
)]<br />
group, and 2<br />
2 is the pooled standard<br />
deviation computed from standard errors of the means.<br />
Computing <strong>Effect</strong> <strong>Sizes</strong> from<br />
t Values and Sample <strong>Sizes</strong><br />
In instances where a research report includes both the<br />
Student’s t-test value <strong>for</strong> a between group comparison<br />
(e.g., experimental group vs. comparison group) and the<br />
E<br />
C<br />
.<br />
3
Table 2<br />
Formulas <strong>for</strong> <strong>Calculating</strong> Cohen’s d <strong>Effect</strong> <strong>Sizes</strong> <strong>for</strong> Different <strong>Research</strong> Designs<br />
Required In<strong>for</strong>mation/Statistics<br />
Formula<br />
M SD SE t χ 2 df N r<br />
Independent Sample Designs<br />
1.<br />
2.<br />
3.<br />
4.<br />
5.<br />
6.<br />
2 2<br />
( M − M )/<br />
( SD SD )/<br />
2<br />
d +<br />
d<br />
= ✓ ✓<br />
E<br />
C<br />
2<br />
2<br />
( )<br />
[ SEE<br />
( N<br />
E<br />
) + SEC<br />
( NC<br />
)]<br />
M − M /<br />
E<br />
C<br />
E<br />
2<br />
C<br />
= ✓ ✓ ✓<br />
⎛ N ⎞<br />
E<br />
+ NC<br />
d = t<br />
⎜<br />
⎟<br />
✓ ✓<br />
⎝ N<br />
E<br />
NC<br />
⎠<br />
d = t N + N ) /( df )( N N )<br />
✓ ✓ ✓<br />
(<br />
E C<br />
E C<br />
d = 2t<br />
/ df<br />
✓ ✓<br />
2<br />
2<br />
d = (4χ ) /( N − χ )<br />
✓ ✓<br />
Nonindependent Sample Designs<br />
7.<br />
8.<br />
2 2<br />
( M − M )/<br />
( SD )/<br />
2<br />
d +<br />
= ✓ ✓<br />
2 1<br />
1<br />
SD2<br />
( 1 r) N<br />
d t 2 − /<br />
= ✓ ✓ ✓<br />
Single Participant Designs<br />
9.<br />
10.<br />
2 2<br />
( M − M )/<br />
( SD SD )/<br />
2<br />
d = +<br />
✓ ✓<br />
I<br />
B<br />
( M − M )/ ⎛<br />
SD / 2(1 − r<br />
⎞<br />
⎟ ⎠<br />
d =<br />
B ⎜ P<br />
)<br />
⎝<br />
B<br />
I<br />
I ✓ ✓ ✓<br />
Correlational Designs<br />
11.<br />
d<br />
2<br />
= 2r<br />
/ 1−<br />
r<br />
✓<br />
12.<br />
d<br />
⎛<br />
= ⎜<br />
⎜<br />
⎝<br />
2<br />
NT<br />
− 2N<br />
N N<br />
1<br />
2<br />
T<br />
⎞<br />
⎟<br />
⎛<br />
⎜<br />
⎟<br />
⎠ ⎝<br />
r<br />
1−<br />
r<br />
2<br />
⎞<br />
⎟<br />
⎠<br />
✓<br />
✓<br />
4
sample sizes <strong>for</strong> both groups of study participants, the <strong>for</strong>mula<br />
<strong>for</strong> calculating Cohen’s d is:<br />
d = t<br />
⎛ N<br />
E<br />
+ N<br />
⎜<br />
⎝ N<br />
E<br />
NC<br />
,<br />
where<br />
t is the Student’s t value <strong>for</strong> the between group comparison,<br />
N E is the sample size of the experimental group, N C is<br />
the sample size of the comparison group, and the effect<br />
size is the t value multiplied by the square root of the sample<br />
size term. In some cases, an analysis of variance F-test<br />
rather than a t-test will be used to make the between group<br />
comparison. The square root of the F-test is the t-test value<br />
( t)<br />
F = t used in Equation 3.<br />
( )<br />
Computing <strong>Effect</strong> <strong>Sizes</strong> from t Values,<br />
Sample <strong>Sizes</strong>, and Degrees of Freedom<br />
Some research reports may include Student’s t-test<br />
values, sample sizes, and degrees of freedom. When these<br />
statistics are available, the <strong>for</strong>mula <strong>for</strong> calculating d is:<br />
E C<br />
E<br />
(4)<br />
,<br />
where<br />
t is the Student’s t value <strong>for</strong> the between group comparison,<br />
N E and N C are the number of participants in the experimental<br />
and comparison groups, respectively, and df is<br />
the degrees of freedom from the t test. The effect size is<br />
calculated by multiplying the t value by the total sample<br />
size (N E + N C ) divided by the product of the square root of<br />
the degrees of freedom and the square root of the product<br />
of the two sample sizes. The degrees of freedom (df) <strong>for</strong><br />
the calculation is N E<br />
N − 2 .<br />
Computing <strong>Effect</strong> <strong>Sizes</strong> from<br />
t Values and Degrees of Freedom<br />
In cases where the sample sizes of both the experimental<br />
and comparison groups are relatively equal and<br />
in<strong>for</strong>mation is available to ascertain the degrees of freedom<br />
of the t-test comparison, the <strong>for</strong>mula <strong>for</strong> calculating d<br />
is:<br />
,<br />
where<br />
t = is the Student’s t value <strong>for</strong> the between group comparison<br />
and df is the number of degrees of freedom <strong>for</strong> the<br />
t test. The degrees of freedom are equal to (N E + N C ) – 2,<br />
where N E is the number if participants in the experimental<br />
group and N C is the number of participants in the comparison<br />
group.<br />
In some cases you may be able to ascertain the total<br />
number of participants in a study but not be able to know if<br />
the sample sizes <strong>for</strong> the two groups of study participants<br />
are equal. Formula 5 can be used to calculate Cohen’s d,<br />
but will likely overestimate the magnitude of effect.<br />
C<br />
⎞<br />
⎟<br />
⎠<br />
d = t( N + N ) /( df )( N NC<br />
)<br />
N E<br />
+ N C<br />
− 2<br />
( )<br />
+ C<br />
d = 2t<br />
/<br />
df<br />
(3)<br />
(5)<br />
<strong>Calculating</strong> <strong>Effect</strong> <strong>Sizes</strong><br />
from Chi Square Statistics<br />
There are sometimes instances where both an independent<br />
variable and outcome variable or measure are both<br />
measured dichotomously. In this case, a Chi-square test is<br />
often used to evaluate whether the proportions of participants<br />
in two groups (e.g., experimental group vs. comparison<br />
groups) differ on the presence or absence of some criterion<br />
measure (e.g., high vs. low blood pressure). Cohen’s<br />
d effect size <strong>for</strong> the χ 2 can be calculated using the <strong>for</strong>mula:<br />
2<br />
2<br />
d = (4χ ) /( N − χ )<br />
(6)<br />
,<br />
where<br />
the square root of four (4) times the χ 2 value is divided by<br />
the total sample size in the study minus the χ 2 value.<br />
<strong>Calculating</strong> <strong>Effect</strong> <strong>Sizes</strong> <strong>for</strong><br />
Nonindependent Groups of Study Participants<br />
The procedures included in this section are <strong>for</strong> calculating<br />
effect sizes when the same group of participants are<br />
measured on two separate occasions (e.g., pretest vs. posttest)<br />
or the same group of participants are measured under<br />
contrasting conditions (e.g., child-initiated learning vs.<br />
adult-directed learning) where one condition is hypothesized<br />
to be related to better per<strong>for</strong>mance on a dependent<br />
measure. The nonindependent-group design <strong>for</strong>mulas are<br />
also used if participants in the two groups are matched on<br />
some third variable (e.g., child developmental quotients).<br />
Computing <strong>Effect</strong> <strong>Sizes</strong> from<br />
Means and Standard Deviations<br />
The <strong>for</strong>mula <strong>for</strong> calculating Cohen’s d from the means<br />
and standard deviations <strong>for</strong> the two measurement occasions<br />
is:<br />
2 2<br />
( M − M )/<br />
( SD )/<br />
2<br />
d =<br />
2<br />
+ SD<br />
(7)<br />
1<br />
1 2<br />
,<br />
where<br />
M 2 is the mean posttest score or mean score of the measure<br />
that is expected to be positively related to the independent<br />
variable, M 1 is the pretest or comparison group mean<br />
2 2<br />
SD /<br />
score, and 1 2<br />
SD 22<br />
( SD<br />
1<br />
+ SD2<br />
)/<br />
2 is the pooled standard<br />
deviation <strong>for</strong> the two measurement occasions. Formula 7 is<br />
applicable to situations where the correlation between the<br />
two sets of scores is small. When this is not the case, Formula<br />
8 should be used to calculate the magnitude of effect.<br />
Computing <strong>Effect</strong> <strong>Sizes</strong> from<br />
t Values and Study Sample <strong>Sizes</strong><br />
In cases where a research report includes the Student’s<br />
t-test value <strong>for</strong> the pretest/post-test or matched groups<br />
comparison, the correlation <strong>for</strong> the two sets of scores, and<br />
the sample sizes are reported or can be ascertained, a special<br />
<strong>for</strong>mula can be used to calculate Cohen’s d so as to not<br />
overestimate the magnitude of effect (Dunlap et al., 1996).<br />
The <strong>for</strong>mula is:<br />
5
( ) N<br />
d = t 2 1−<br />
r /<br />
(8)<br />
between conditions and the dependent measures is small,<br />
,<br />
Formula 9 should be used to calculate the effect size. In<br />
where<br />
many cases, the baseline or intervention phase data may<br />
t is the Student’s t value <strong>for</strong> the between measurement include one or more outliers. This is not uncommon in<br />
occasion comparison, r is the correlation between the two single-participant design studies. Although it is tempting to<br />
sets of measures, and N is the number of study participants.<br />
should not be done unless there is an identifiable cause or<br />
exclude the outliers in calculating standard deviations, this<br />
reason <strong>for</strong> the aberrant response or behavior that can reasonably<br />
be explained.<br />
<strong>Calculating</strong> <strong>Effect</strong> <strong>Sizes</strong> from<br />
Single-Participant <strong>Research</strong> Design Studies<br />
The <strong>for</strong>mula <strong>for</strong> calculating an effect size when the<br />
above conditions are met is:<br />
The procedures described in this section are <strong>for</strong> calculating<br />
effect sizes <strong>for</strong> single-participant design studies that<br />
have both baseline (pretest) and intervention (posttest)<br />
phase data (Sigurdsson & Austin, 2004; Swanson &<br />
Sachse-Lee, 2000). In a few cases, raw data may be presented<br />
in a research report that can be used to calculate<br />
needed statistics. In most cases, the data will need to be<br />
estimated from graphs displaying patterns of findings. In<br />
order to calculate effect sizes from single-participant research<br />
design studies, a sufficient number of data points<br />
need to be available to calculate the statistics needed to use<br />
either <strong>for</strong>mula (see below).<br />
There is considerable controversy surrounding, and<br />
objections about, calculating effect sizes from singleparticipant<br />
design studies (see e.g., Busk & Serlin, 1992;<br />
Faith, Allison, & Gorman, 1997; Salzberg, Strain, & Baer,<br />
1987; Scruggs & Mastropieri, 2001). Our main purpose in<br />
calculating magnitude of treatment effects in singleparticipant<br />
design studies is to produce a metric that is<br />
comparable to effect sizes computed from data in studies<br />
using other types of research designs.<br />
The particular <strong>for</strong>mulas we have included in the<br />
guidelines are applicable <strong>for</strong> different sets of conditions. If<br />
the “spread of scores” in the baseline and intervention<br />
phases are varied and the correlation between the baseline<br />
vs. intervention phase and dependent measures is small,<br />
Formula 9 can be used to calculate Cohen’s d. If the baseline<br />
and intervention phase data are mostly nonoverlapping<br />
or the correlation between the baseline vs. intervention<br />
phases and dependent measures is large, Formula 10<br />
should be used.<br />
A decision about which <strong>for</strong>mula to use should be done<br />
by first calculating the means and standard deviations <strong>for</strong><br />
the baseline and intervention phases and the correlation<br />
between the baseline condition coded zero (0) and the intervention<br />
phase condition coded one (1) and the dependent<br />
measures of both phases of data. With those results,<br />
you can decide which <strong>for</strong>mula to use to code Cohen’s d.<br />
Computing <strong>Effect</strong> <strong>Sizes</strong> from Mean<br />
Scores and Pooled Standard Deviations<br />
Sigurdsson and Austin (2004) and Swanson and<br />
Sachse-Lee (2000) both recommend that the effect sizes<br />
<strong>for</strong> intervention vs. baseline phase single-participant design<br />
study data be calculated using the pooled standard<br />
deviations <strong>for</strong> estimating the magnitude of intervention<br />
effect. In instances where there is reasonable spread in the<br />
baseline and intervention phase data and the correlation<br />
6<br />
( ) ( ) 2<br />
2 2<br />
d = M<br />
I<br />
− M<br />
B<br />
/ SDB<br />
+ SDI<br />
/<br />
,<br />
(9)<br />
where<br />
M I is the mean score <strong>for</strong> the intervention phase data, M B is<br />
the mean score <strong>for</strong> the baseline phase data, and<br />
SD 2<br />
SD 2<br />
B 2<br />
( I 2<br />
SD + )/<br />
2<br />
B<br />
SD I<br />
is the pooled standard deviation.<br />
<strong>Calculating</strong> <strong>Effect</strong> <strong>Sizes</strong> from the Correlations<br />
Between the Baseline and Intervention Phase Data<br />
Many single-participant research design studies produce<br />
findings where the correlation between baseline vs.<br />
intervention phases and the dependent measure is high<br />
(Swanson & Sachse-Lee, 2000). Dunlap et al. (1996) has<br />
shown that where contrasting conditions data are correlated,<br />
effect-size calculations yield overestimates of the<br />
magnitude of effect of the intervention. The correlation<br />
between the baseline and intervention phase data will especially<br />
be inflated when the spread of scores is small, the<br />
percentage of scores or measures <strong>for</strong> the two conditions<br />
are nonoverlapping, and the correlation between conditions<br />
and the dependent measures is large.<br />
The <strong>for</strong>mula <strong>for</strong> calculating an effect size from<br />
single-participant design studies where one or more of<br />
these situations are present is:<br />
( M − M )/ ⎛<br />
SD / 2(1 − r<br />
⎞<br />
⎟ ⎠<br />
d = ⎜<br />
)<br />
I B P<br />
(10)<br />
⎝<br />
,<br />
where<br />
M I is the mean score <strong>for</strong> the intervention phase data, M B is<br />
the mean score <strong>for</strong> the baseline phase data, SD P is the<br />
pooled standard deviation <strong>for</strong> both data phases (calculated<br />
in the manner shown in Formula 9), and r is the correlation<br />
between the baseline and intervention phase data.<br />
Converting Correlation Coefficients to <strong>Effect</strong> <strong>Sizes</strong><br />
In some cases, research reports will include correlation<br />
coefficients <strong>for</strong> showing the relationship between an<br />
independent variable and a dependent or outcome measure.<br />
These may include Pearson’s product moment correlations,<br />
point biserial correlations or biserial correlations.<br />
The <strong>for</strong>mulas in this section permit conversion of correlation<br />
coefficients to effect sizes <strong>for</strong> different kinds of designs<br />
and analyses.<br />
There are two types of correlational research designs<br />
that are most likely to be encountered in conducting a
practice-based research synthesis. One design involves<br />
studies where variations in practice characteristics are related<br />
to variations in the consequences of the practices in<br />
the same sample of study participants. The second design<br />
involves studies where a point biserial or biserial correlation<br />
is used to relate group membership (e.g., experimental<br />
group vs. comparison group) to variations in an outcome<br />
measure. In the latter type of study, the number of study<br />
participants in each group will not necessarily be equal. In<br />
instances where the sample sizes are not equal or the total<br />
sample size is small, Formula 12 should be used to convert<br />
a correlation coefficient to an effect size (Aaron, Kromrey,<br />
& Ferron, 1998; Thompson, 2000).<br />
Computing <strong>Effect</strong> <strong>Sizes</strong> from Correlation Coefficients<br />
in Equal Sample Size Studies<br />
In cases where the sample sizes <strong>for</strong> experimental and<br />
comparison groups are relatively equal, or variations in<br />
practice characteristics are correlated with variations in an<br />
outcome measure <strong>for</strong> the same group of study participants,<br />
Cohen’s d can be calculated using the <strong>for</strong>mula:<br />
2<br />
d = 2r<br />
/ 1−<br />
r ,<br />
(11)<br />
where<br />
r is the correlation coefficient, and the effect size d is determined<br />
by multiplying r by two (2) and dividing by the<br />
square root of 1(one) minus r squared. Alternatively, you<br />
can use the Appendix to convert a correlation coefficient<br />
to an effect size. Simply find the r that matches the one in<br />
the research report and convert it to the corresponding d<br />
values.<br />
Computing <strong>Effect</strong> <strong>Sizes</strong> from Correlation Coefficients<br />
in Unequal Sample Size Studies<br />
In cases where the sample sizes in the experimental<br />
and comparison groups are not relatively equal, the <strong>for</strong>mula<br />
<strong>for</strong> converting a correlation coefficient to Cohen’s d<br />
is:<br />
⎛<br />
d = ⎜<br />
⎜<br />
⎝<br />
2<br />
NT<br />
− 2N<br />
N N<br />
1<br />
2<br />
⎞<br />
⎟<br />
⎛<br />
⎜<br />
⎟<br />
⎠ ⎝<br />
r<br />
1−<br />
r<br />
,<br />
where<br />
N T is the total number of study participants (N 1 + N 2 ), N 1<br />
and N 2 are the sample sizes <strong>for</strong> the two groups of study<br />
participants, and r is the correlation coefficient between<br />
the groups coded dichotomously and related to variations<br />
in an outcome measure.<br />
Converting Probability Levels to <strong>Effect</strong> <strong>Sizes</strong><br />
In some cases, research reports include only p-values<br />
<strong>for</strong> the differences between score means. The reported<br />
probability level can be converted to an effect size using a<br />
normal curve table. The procedures <strong>for</strong> doing so are described<br />
in Rosenthal (1994). Although this method yields<br />
less accurate effect sizes, it sometimes is the only way to<br />
calculate the magnitude of effect <strong>for</strong> study results. The<br />
T<br />
2<br />
⎞<br />
⎟<br />
⎠<br />
(12)<br />
procedure should be used only when Cohen’s d cannot be<br />
calculated using more accurate computational methods.<br />
Conclusions<br />
The purpose of this Centerscope article is to describe<br />
procedures <strong>for</strong> calculating Cohen’s d effect sizes in studies<br />
using different research designs so as to be able to have a<br />
common metric <strong>for</strong> ascertaining the magnitude and nature<br />
of the relationship between the practice characteristics and<br />
outcomes in a study. The guidelines ensure that the effect<br />
sizes calculated from different research designs have similar<br />
interpretive meaning.<br />
In cases where practice-based research syntheses include<br />
studies using different research designs, explicitly<br />
determining whether bias may be present <strong>for</strong> differences in<br />
computational methods should be done as part of the interpretive<br />
process (Shadish et al., 2002). There<strong>for</strong>e, the magnitude<br />
and patterns of effect sizes <strong>for</strong> different research<br />
designs and different effect-size <strong>for</strong>mulas should be compared<br />
to ensure no one procedure produces biased indices.<br />
The reader should be aware that there are other possible<br />
biases that may lead to misinterpretations of effect sizes.<br />
Shadish et al. (2002, Appendix 13.1) describe several<br />
threats to inferences made from study findings that involve<br />
effect-size computations.<br />
Implications<br />
A practice-based research synthesis is concerned with<br />
both the characteristics and consequences of practice variables<br />
and how variations in characteristics are related to<br />
variations in outcomes (Dunst et al., 2002b). There are<br />
three primary implications <strong>for</strong> using effect sizes <strong>for</strong> discerning<br />
the nature of these relationships.<br />
One implication of effect sizes in practice-based research<br />
syntheses is to isolate those practice characteristics<br />
that matter most in explaining variations in an outcome<br />
measure. <strong>Effect</strong> sizes provide one way of determining<br />
among any number of related practice characteristics,<br />
which ones best explain study results and there<strong>for</strong>e are the<br />
characteristics that make more explicit what intervention<br />
practices ought to look like to produce desired effects<br />
(Kassow & Dunst, 2004).<br />
A second implication of effect sizes in practice-based<br />
research syntheses is determining the strength of relationship<br />
between particular kinds of practice characteristics<br />
and specific outcomes. The usefulness of research evidence<br />
<strong>for</strong> in<strong>for</strong>ming practice is, in part, determined by the<br />
probability that a given practice will produce a desired<br />
effect. The magnitude of effect can help in<strong>for</strong>m the likelihood<br />
of a practice having a minor or major impact.<br />
A third implication of effect sizes in practice-based<br />
research syntheses is to establish which kinds of practices<br />
have like or unlike effects in different outcomes. This is<br />
done, <strong>for</strong> example, by comparing the effect sizes <strong>for</strong> the<br />
relationship between variations in practice characteristics<br />
<strong>for</strong> related but different outcome measures (e.g., language<br />
production vs. language comprehension). Doing so can<br />
7
help isolate what effects the intervention is likely and not<br />
likely to produce.<br />
Summary<br />
A major goal of a practice-based research synthesis is<br />
increased understanding of how different kinds of environmental<br />
variables influence behavior and development. <strong>Effect</strong><br />
sizes are one “tool” that can be used <strong>for</strong> in<strong>for</strong>ming the<br />
nature of these relationships. The procedures and guidelines<br />
described in this article facilitate this process.<br />
References<br />
Aaron, B., Kromrey, J. D., & Ferron, J. M. (1998, November).<br />
Equating r-based and d-based effect size indices:<br />
Problems with a commonly recommended <strong>for</strong>mula.<br />
Paper presented at the annual meeting of the Florida<br />
Educational <strong>Research</strong> Association, Orlando, FL<br />
(ERIC Document Reproduction Service No.<br />
ED433353).<br />
Bronfenbrenner, U. (1992). Ecological systems theory. In<br />
R. Vasta (Ed.), Six theories of child development: Revised<br />
<strong>for</strong>mulations and current issues (pp. 187-248).<br />
Philadelphia: Jessica Kingsley.<br />
Busk, P. L., & Serlin, R. C. (1992). Meta-analysis <strong>for</strong> single-case<br />
research. In T. R. Kratochwill & J. R. Levin<br />
(Eds.), Single-case research design and analysis: New<br />
directions <strong>for</strong> psychology and education (pp. 187-<br />
212). Hillsdale, NJ: Erlbaum.<br />
Clow, P. W., & Dunst, C. J. (2004). <strong>Calculating</strong> effect<br />
sizes <strong>for</strong> practice-based research syntheses. Centerscope,<br />
3(2).<br />
Cohen, J. (1977). Statistical power analysis <strong>for</strong> the behavioral<br />
sciences. New York: Academic Press.<br />
Cohen, J. (1988). Statistical power analysis <strong>for</strong> the behavioral<br />
sciences. (2nd ed.). Hillsdale, NJ: Erlbaum.<br />
De Wolff, M. S., & van IJzendoorn, M. H. (1997). Sensitivity<br />
and attachment: A meta-analysis on parental<br />
antecedents of infant attachment. Child Development,<br />
68, 571-591.<br />
Dunlap, W. P., Cortina, J. M., Vaslow, J. B., & Burke, M.<br />
J. (1996). Meta-analysis of experiments with matched<br />
groups or repeated measure designs. Psychological<br />
Methods, 1, 170-177.<br />
Dunst, C. J. (2003). Social-emotional consequences of<br />
response-contingent learning opportunities. Bridges,<br />
1(1), 1-17. Available at http://www.evidencebasedpractices.org/centerscope/centerscopevol1no2.pdf.<br />
Dunst, C. J., Trivette, C. M., & Cutspec, P. A. (2002a). An<br />
evidence-based approach to documenting the characteristics<br />
and consequences of early intervention practices.<br />
Centerscope, 1(2), 1-6. Available from http://<br />
www.evidencebasedpractices.org/centerscope/centers<br />
copevol1no2pdf..<br />
Dunst, C. J., Trivette, C. M., & Cutspec, P. A. (2002b).<br />
Toward an operational definition of evidence-based<br />
practices. Centerscope, 1(1), 1-10. Available from<br />
http://www.evidencebasedpractices.org/centerscope/<br />
centerscopevol1no1.pdf.<br />
Faith, M. S., Allison, D. B., & Gorman, B. S. (1997).<br />
Meta-analysis of single-case research. In R. D. Franklin,<br />
D. B. Allison, & B. S. Gorman (Eds.), Design and<br />
analysis of single-case research (pp. 245-277). Mahwah,<br />
NJ: Erlbaum.<br />
Glass, G. V., McGaw, B., & Smith, M. L. (1981). Metaanalysis<br />
in social research. Beverly Hills, CA: Sage.<br />
Kassow, D. Z., & Dunst, C. J. (2004). Characteristics of<br />
parental sensitivity related to secure infant attachment.<br />
Bridges, in press.<br />
Lipsey, M. W. (1998). Design sensitivity: Statistical power<br />
<strong>for</strong> applied experimental research. In L. Bickman &<br />
D. J. Rog (Eds.), Handbook of applied social research<br />
methods (pp. 39-68). Thousand Oaks, CA: Sage.<br />
McCartney, K., & Rosenthal, R. (2000). <strong>Effect</strong> size, practical<br />
importance, and social policy <strong>for</strong> children. Child<br />
Development, 71, 173-180.<br />
Raab, M., & Dunst, C. J. (in press). Characteristics and<br />
consequences of interest-based child learning opportunities.<br />
Bridges.<br />
Renninger, K. A., Hidi, S., & Krapp, A. (Eds.). (1992).<br />
The role of interest in learning and development.<br />
Hillsdale, NJ: Erlbaum.<br />
Rosenthal, R. (1994). Parametric measures of effect size.<br />
In H. Cooper & L. V. Hedges (Eds.), The handbook of<br />
research synthesis (pp. 231-244). New York: Russell<br />
Sage Foundation.<br />
Salzberg, C. L., Strain, P. S., & Baer, D. M. (1987). Metaanalysis<br />
<strong>for</strong> single-subject research: When does it clarify?<br />
When does it obscure? Remedial and Special<br />
Education, 8, 43-48.<br />
Scruggs, T. E., & Mastropieri, M. A. (2001). How to summarize<br />
single-participant research: Ideas and applications.<br />
Exceptionality, 9, 227-244.<br />
Shadish, W. R., Cook, T. D., & Campbell, D. T. (2002).<br />
Experimental and quasi-experimental designs <strong>for</strong> generalized<br />
causal inference. Boston: Houghton Mifflin.<br />
Shadish, W. R., Robinson, L., & Lu, C. (1997). ES: <strong>Effect</strong><br />
size calculator. Retrieved July 28, 2004, from Assessment<br />
Systems Corporation Web site<br />
http://www.assess.com/Software/ES.htm.<br />
Sigurdsson, S. O., & Austin, J. (2004). Should we be measuring<br />
effect size in applied behavior analysis? Retrieved<br />
July 23, 2004, from www.obmnetwork.com/<br />
resources/articles/Sigurdsson_<strong>Effect</strong>Size.htm.<br />
Swanson, H. L., & Sachse-Lee, C. (2000). A meta-analysis<br />
of single-subject-design intervention research <strong>for</strong> students<br />
with LD. Journal of Learning Disabilities, 33,<br />
114-136.<br />
Thalheimer, W., & Cook, S. (2002). How to calculate effect<br />
sizes from published research: A simplified methodology.<br />
Retrieved July 26, 2004, http://worklearning.com/effect_sizes.htm.<br />
Thalheimer, W., & Cook, S. (2003). How to calculate effect<br />
sizes from published research: A simplified<br />
spreadsheet. Retrieved July 23, 2004, from http://-<br />
8
work- learning.com/effect_sizes.htm.<br />
Thompson, B. (2000). A suggested revision to the <strong>for</strong>thcoming<br />
5th edition of the APA Publication Manual.<br />
Retrieved July 23, 2004, from www.coe.tamu.edu/<br />
~bthompson/apaeffec.htm.<br />
Thompson, B. (2002). What future quantitative social science<br />
research could look like: Confidence intervals <strong>for</strong><br />
effect sizes. Educational <strong>Research</strong>er, 31(3), 24-31.<br />
Thompson, B. (in press). <strong>Research</strong> synthesis: <strong>Effect</strong> sizes.<br />
In J. Green, G. Camilli, & P. B. Elmore (Eds.), Complementary<br />
methods <strong>for</strong> research in education. Washington,<br />
DC: American Educational <strong>Research</strong> Association.<br />
Vacha-Haase, T., & Thompson, B. (2004). How to estimate<br />
and interpret various effect sizes. Journal of<br />
Counseling Psychology, 51, 473-481.<br />
Acknowledgments<br />
This paper was prepared as part of the <strong>Research</strong> and<br />
Training Center on Early Childhood Development funded<br />
by the U.S. Department of Education, Office of Special<br />
Education Programs, <strong>Research</strong> to <strong>Practice</strong> Division<br />
(H324K01005). Appreciation is extended to Bruce<br />
Thompson, Ph.D., and Jeffrey Kromrey, Ph.D., <strong>for</strong> their<br />
comments, feedback, and suggestions on an earlier version<br />
of the paper. The opinions expressed in this paper,<br />
however, are solely those of the authors and do not necessarily<br />
reflect those of the reviewers or the U.S. Department<br />
of Education.<br />
Authors<br />
Carl J. Dunst, Ph.D., is a Co-Director and <strong>Research</strong><br />
Scientist at the Orelena Hawks Puckett Institute,<br />
Asheville, North Carolina, and <strong>Research</strong> Director at the<br />
Family, Infant and Preschool Program, Morganton, NC;<br />
e-mail: dunst@-puckett.org. Deborah W. Hamby,<br />
MPH, is a <strong>Research</strong> Analyst at the Orelena Hawks<br />
Puckett Institute, Morganton, North Carolina; e-mail:<br />
dhamby@puckett.org. Carol M. Trivette, Ph.D., is a<br />
Co-Director and <strong>Research</strong> Scientist at the Orelena<br />
Hawks Puckett Institute, Morganton, North Carolina; e-<br />
mail: trivette@puckett.org.<br />
9
Appendix<br />
Conversion Table <strong>for</strong> Determining Cohen’s d <strong>Effect</strong> <strong>Sizes</strong> from a Correlation Coefficient Coefficients<br />
r d r d r d<br />
0.00 0.00 0.33 0.70 0.66 1.76<br />
0.01 0.02 0.34 0.72 0.67 1.81<br />
0.02 0.04 0.35 0.75 0.68 1.85<br />
0.03 0.06 0.36 0.77 0.69 1.91<br />
0.04 0.08 0.37 0.80 0.70 1.96<br />
0.05 0.10 0.38 0.82 0.71 2.02<br />
0.06 0.12 0.39 0.85 0.72 2.08<br />
0.07 0.14 0.40 0.87 0.73 2.14<br />
0.08 0.16 0.41 0.90 0.74 2.20<br />
0.09 0.18 0.42 0.93 0.75 2.27<br />
0.10 0.20 0.43 0.95 0.76 2.34<br />
0.11 0.22 0.44 0.98 0.77 2.41<br />
0.12 0.24 0.45 1.01 0.78 2.49<br />
0.13 0.26 0.46 1.04 0.79 2.58<br />
0.14 0.28 0.47 1.06 0.80 2.67<br />
0.15 0.30 0.48 1.09 0.81 2.76<br />
0.16 0.32 0.49 1.12 0.82 2.87<br />
0.17 0.35 0.50 1.15 0.83 2.98<br />
0.18 0.37 0.51 1.19 0.84 3.10<br />
0.19 0.39 0.52 1.22 0.85 3.23<br />
0.20 0.41 0.53 1.25 0.86 3.37<br />
0.21 0.43 0.54 1.28 0.87 3.53<br />
0.22 0.45 0.55 1.32 0.88 3.71<br />
0.23 0.47 0.56 1.35 0.89 3.90<br />
0.24 0.49 0.57 1.39 0.90 4.13<br />
0.25 0.52 0.58 1.42 0.91 4.39<br />
0.26 0.54 0.59 1.46 0.92 4.69<br />
0.27 0.56 0.60 1.50 0.93 5.06<br />
0.28 0.58 0.61 1.54 0.94 5.51<br />
0.29 0.61 0.62 1.58 0.95 6.08<br />
0.30 0.63 0.63 1.62 0.96 6.86<br />
0.31 0.65 0.64 1.67 0.97 7.98<br />
0.32 0.68 0.65 1.71 0.98 9.85<br />
10