Variance Estimates and the F Ratio
Variance Estimates and the F Ratio
Variance Estimates and the F Ratio

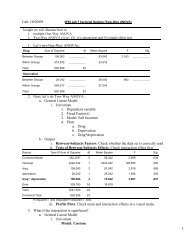
You also want an ePaper? Increase the reach of your titles
YUMPU automatically turns print PDFs into web optimized ePapers that Google loves.
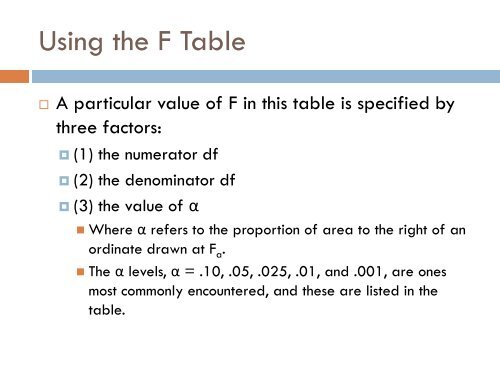
Using <strong>the</strong> F Table<br />
A particular value of F in this table is specified by<br />
three factors:<br />
(1) <strong>the</strong> numerator df<br />
(2) <strong>the</strong> denominator df<br />
(3) <strong>the</strong> value of α<br />
• Where α refers to <strong>the</strong> proportion of area to <strong>the</strong> right of an<br />
ordinate drawn at F a .<br />
• The α levels, α = .10, .05, .025, .01, <strong>and</strong> .001, are ones<br />
most commonly encountered, <strong>and</strong> <strong>the</strong>se are listed in <strong>the</strong><br />
table.