Variance Estimates and the F Ratio
Variance Estimates and the F Ratio
Variance Estimates and the F Ratio

You also want an ePaper? Increase the reach of your titles
YUMPU automatically turns print PDFs into web optimized ePapers that Google loves.
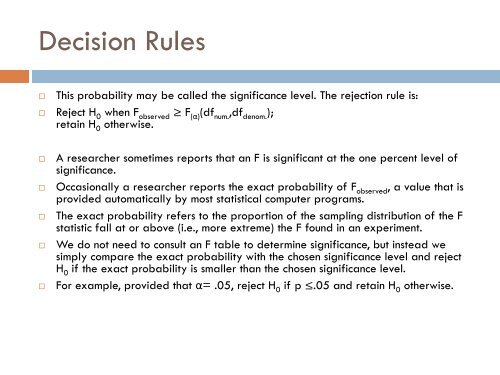
Decision Rules<br />
This probability may be called <strong>the</strong> significance level. The rejection rule is:<br />
Reject H 0 when F observed ≥ F (α) (df num. ,df denom. );<br />
retain H 0 o<strong>the</strong>rwise.<br />
<br />
<br />
<br />
<br />
<br />
A researcher sometimes reports that an F is significant at <strong>the</strong> one percent level of<br />
significance.<br />
Occasionally a researcher reports <strong>the</strong> exact probability of F observed , a value that is<br />
provided automatically by most statistical computer programs.<br />
The exact probability refers to <strong>the</strong> proportion of <strong>the</strong> sampling distribution of <strong>the</strong> F<br />
statistic fall at or above (i.e., more extreme) <strong>the</strong> F found in an experiment.<br />
We do not need to consult an F table to determine significance, but instead we<br />
simply compare <strong>the</strong> exact probability with <strong>the</strong> chosen significance level <strong>and</strong> reject<br />
H 0 if <strong>the</strong> exact probability is smaller than <strong>the</strong> chosen significance level.<br />
For example, provided that α= .05, reject H 0 if p ≤.05 <strong>and</strong> retain H 0 o<strong>the</strong>rwise.