Analysis of trend Chapter 5
Analysis of trend Chapter 5
Analysis of trend Chapter 5

You also want an ePaper? Increase the reach of your titles
YUMPU automatically turns print PDFs into web optimized ePapers that Google loves.
ANALYSIS OF TREND<br />
CHAPTER 5<br />
ERSH 8310 • Lecture 7 • September 13, 2007
Today’s Class<br />
<strong>Analysis</strong> <strong>of</strong> <strong>trend</strong>s…<br />
Using contrasts to do something a bit more practical.<br />
Linear <strong>trend</strong>s.<br />
Quadratic <strong>trend</strong>s.<br />
Trends in SPSS.
Today’s Example Data<br />
Training Times
Yet Another Experiment<br />
From p. 89:<br />
“Consider an experiment designed to test the proposition that subjects<br />
learn better when training is distributed or spaced over a period <strong>of</strong><br />
time than when the training is massed all at once. We could<br />
investigate this question with just two groups, one group that receives<br />
massed training and another that receives training at spaced<br />
intervals. However, this study would allow only a restricted glimpse<br />
<strong>of</strong> the phenomenon. Instead we could conduct a more comprehensive<br />
study that included conditions with several different spacings. It<br />
would provide information about the form <strong>of</strong> the relationship<br />
between learning and the degree <strong>of</strong> distributed training, giving a<br />
much clearer picture <strong>of</strong> the spacing phenomenon.”
The Task…<br />
<br />
P. 89, continued…<br />
“The subject’s task is to track a spot moving in a random path around a<br />
computer screen, using a control stick to position a circle over it. Each<br />
subject has 10 one-minute practice trials learning how to track the<br />
spot. The independent variable is the time between practice trials:<br />
For one group the trials immediately follow another (0 seconds<br />
spacing – the massed condition); for a second group there is a 20-<br />
second pause between trials, for a third group there is a 40-second<br />
pause; and for the fourth group there is a 60-second pause. Twenty<br />
minutes after the last practice trial, each subject is given a 30-<br />
second test trial, and the dependent variable is the number <strong>of</strong><br />
seconds that the subject is able to keep on the target. Suppose n=5<br />
subjects are randomly assigned to the four groups. [The scores are<br />
given in the table on the next slide.]”
<strong>Analysis</strong> <strong>of</strong> Linear Trend
Trend <strong>Analysis</strong><br />
Trend analysis is a specialized form <strong>of</strong> single-df<br />
comparisons when a quantitative independent variable<br />
is manipulated.<br />
The treatment levels represent different amount <strong>of</strong> a<br />
single common variable (e.g., the number <strong>of</strong> hours <strong>of</strong><br />
food deprivation, different dosage levels <strong>of</strong> particular<br />
drug, rates <strong>of</strong> stimulus presentation, and the intensity <strong>of</strong><br />
the unconditional stimulus in a conditioning experiment).<br />
We usually plot the entire set <strong>of</strong> treatment means on a<br />
graph, connect the points, and examine the display for<br />
any underling shape or <strong>trend</strong>.
A Numerical Example<br />
Assume the following experiment:<br />
Subjects are given some material to learn with the<br />
independent variable, the trial interval <strong>of</strong> 0, 20, 40,<br />
and 60 seconds (i.e., a = 4).<br />
The dependent variable is the number <strong>of</strong> seconds that<br />
the subject is able to keep on the target (i.e., tracking<br />
score).<br />
Suppose that an = 20 and the hypothetical results are<br />
presented in Table 5.1.
Tracking Task…Bringing You To Our Data
The Data<br />
Intertrial Interval (A)<br />
0 seconds 20 seconds 40 seconds 60 seconds<br />
a 1 a 2 a 3 a 4<br />
4 18 24 16<br />
6 13 19 17<br />
10 15 21 13<br />
9 11 16 23<br />
11 13 15 21
Testing for Linear Trend<br />
A way <strong>of</strong> assessing linear <strong>trend</strong> is to use a set <strong>of</strong><br />
coefficients that represents an idealized version <strong>of</strong><br />
a straight line (see Appendix A.3 on p. 577).<br />
Note that there are a-1 number <strong>of</strong> the orthogonal<br />
polynomials.<br />
For our example, this would be:<br />
c 1 c 2 c 3 c 4<br />
-3 -1 1 3
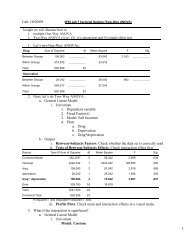
Example in SPSS<br />
Run the ANOVA:<br />
Analyze…Compare Means…One-Way ANOVA
Example in SPSS<br />
Click on the “Contrasts…” button…<br />
Be sure the checkbox by polynomial is checked.<br />
Select “linear” in the degree listbox.
Descriptives…
Means Plot (Is There A Trend?)
The Single-df Linear Trend Test<br />
The single-df comparison for the testing <strong>of</strong> linear<br />
<strong>trend</strong> is performed with:
We Can Formulate Our Contrast
Contrast Test <strong>of</strong> Hypothesis<br />
We can test the hypothesis:<br />
H 0: Ψ = 0<br />
This is the p-value for<br />
the contrast<br />
hypothesis test
Contrast Coefficients<br />
The c 1j are the linear coefficients in Appendix A.3<br />
(e.g., -3, -1, 1, 3, for a = 4) and df num = 1 and<br />
df denom = a(n-1).<br />
The four means can be plotted and a straight line<br />
can also be drawn.<br />
The straight line (i.e., the linear function) does not fit<br />
the data perfectly.
Plotting the Regression Line<br />
We may express the linear relationship using the<br />
liner regression equation,
Evaluating the Linear Fit<br />
It can be determined if the linear function provides<br />
a complete summary <strong>of</strong> the relationship between X<br />
and Y. The test is:
<strong>Analysis</strong> <strong>of</strong> Quadratic Trend
<strong>Analysis</strong> <strong>of</strong> Quadratic Trend<br />
A quadratic <strong>trend</strong> is one that displays concavity, a<br />
single bend either upward or downward.<br />
The coefficients <strong>of</strong> orthogonal polynomials in<br />
Appendix A.3 can be used to test quadratic <strong>trend</strong>.<br />
The testing <strong>of</strong> quadratic <strong>trend</strong> can be accomplished<br />
by the formulae on the next slide.
Our Example<br />
Quadratic contrast coefficients:<br />
c 1 c 2 c 3 c 4<br />
1 -1 -1 1
Testing Quadratic Trend<br />
with df num = 1 and df denom = a(n-1).
In SPSS…
SPSS Output<br />
Is our quadratic <strong>trend</strong> contrast significant?
Evaluating the Quadratic Fit<br />
The residual variation remaining beyond the linear and<br />
quadratic components can be evaluated with F failure .<br />
The quadratic regression equation can be constructed,<br />
similarly to the linear regression equation:<br />
Use a multiple regression program to obtain the<br />
regression coefficients.
Higher-Order Trend Components<br />
Testing for Higher-Order Trends:<br />
A curve that has two reversals is called a cubic <strong>trend</strong><br />
component, and one that has three reversals is called a<br />
quartic <strong>trend</strong> component.<br />
The higher-order <strong>trend</strong> can be tested with the coefficients in<br />
Appendix A.3.<br />
For example, we may calculate the cubic <strong>trend</strong> for a = 4.
Planning a Trend <strong>Analysis</strong>
Issues in Trend <strong>Analysis</strong><br />
There are two questions that surround the choice <strong>of</strong><br />
intervals, namely, the nature <strong>of</strong> the spacing between<br />
adjacent levels and the number <strong>of</strong> intervals.<br />
It is better to use equally spaced intervals.<br />
Trend Coefficients for Unequal Intervals:<br />
The coefficients can be found by simply picking numbers<br />
that agree with the actual spacing and adjust them to sum to<br />
zero.<br />
The Number <strong>of</strong> Intervals:<br />
Seriously consider investing in a substantial experiment that<br />
includes a sufficient number <strong>of</strong> treatment conditions to<br />
provide convincing evidence <strong>of</strong> the <strong>trend</strong>s.
Other Issues<br />
Other Functional Forms<br />
Other functions (e.g., exponential or logarithm) can be<br />
used.<br />
Monotonic Trend <strong>Analysis</strong><br />
When we have only predicted the rank order <strong>of</strong> the<br />
conditions, we have a monotonic hypothesis based on a<br />
monotonic function.<br />
We may apply the logic behind the <strong>trend</strong> coefficients in<br />
Appendix A.3 appropriately modified for a given<br />
problem.
Final Thought<br />
<br />
<br />
Trend analysis takes the idea <strong>of</strong><br />
contrasts and maps it onto looking<br />
at <strong>trend</strong>s.<br />
Trend analysis is typically<br />
conducted when the factor levels<br />
have some understandable scale.<br />
<br />
Contrasts are specific hypothesis tests that examine how each<br />
mean may differ from all the other means.
Next Class<br />
<strong>Chapter</strong> 6: Pairwise Comparisons