ISSN 2087-3940 (PRINT) | ISSN 2087-3956 ... - Biodiversitas
ISSN 2087-3940 (PRINT) | ISSN 2087-3956 ... - Biodiversitas
ISSN 2087-3940 (PRINT) | ISSN 2087-3956 ... - Biodiversitas

Create successful ePaper yourself
Turn your PDF publications into a flip-book with our unique Google optimized e-Paper software.
40<br />
3 (1): 36-43, March 2011<br />
Also, choosing a higher number of criteria used for<br />
comparison gives rise to shefting the priority into the site<br />
that is appropriate to most of the used criteria.<br />
Site priorities for tourist uses<br />
Acoording to the total assigned sensitivity<br />
significance and considering a sensitivity<br />
significance score < 50 to be suitable for<br />
touristic use, 16 sites were selected are<br />
suggested for touristc uses. As many of these<br />
sites have some sensitive resources, these sites<br />
are suggested to be divided into two categories:<br />
first category sites includes sites with some<br />
sensitive resources and with 30 ≤ sensitivity<br />
significance < 50, second category sites include<br />
sites without sensitive resources and with<br />
sensitivity significance < 30. First category sites<br />
are sites 1, 3, 8, 11, 13, 15. Second category<br />
sites are sites 2, 4, 6, 9, 12, 14, 19, 20. Sensitive<br />
habitats for first category sites are rarity for site<br />
1, diversity and rarity for site 3, fragility for site<br />
8, diversity for site 11 and typicalness for site<br />
13.<br />
Site description<br />
Site 1 (Marsa Nakry) is characterized by a<br />
95% degraded reef flat, 38% dead corals with<br />
increase in the hydrocoral Millepora dichotoma<br />
at 1-5m zone. However, one threatened manta<br />
ray (Taenura lymma) was observed. Site 2 is<br />
very poor and far from the shore with increased<br />
algae, sands and dead corals. Site 3 has 45%<br />
dead corals and one threatened stingray<br />
(Taenura lymma). Site 4 is dominated with<br />
algae while site 5 is characterized by two main<br />
ecosystems: a coral reef ecosystem and a<br />
seagrass ecosystem, 38.5% live corals, 66.5%<br />
dead corals and one threatened threatened<br />
Manta Ray (Himantura uarnak). Site 6 has the<br />
shoreline heavily condensed with quite a lot<br />
amount of plastic bags, glass and plastic bottles,<br />
wood pieces, steel pieces, robes, old shoes,<br />
small and big canes with a very poor marine<br />
life. Site 7 has 65% live corals, 14% dead corals<br />
and one endangered reptile, (the green turtle<br />
Chelonia mydas. Site 8 has 20% live corals and<br />
55% dead corals, site 9 has 46.5% live corals<br />
and 50% dead corals while site 10 has 91% live<br />
corals and 5% dead corals. Sites 11 and 12 have<br />
a poor marine life except some algae and spots<br />
of corals while site 13 is a clean sandy beach<br />
with few small coral patches having 47% dead<br />
corals and 35% live corals. Site 14 is mostly<br />
sand with few patches of algae, sea grasses and<br />
a well developed reef. Site 15 has a seagrass<br />
patch, a small reef patch suffering from old<br />
dynamite fishing and a lot of deep crab niches<br />
on the shoreline while site 16 has a fringing<br />
reef, a patch reef and a barrier reef with a<br />
seagrass bed in between. Site 17 has a a<br />
degraded reef flat, with 40% live corals, 30% dead corals<br />
with juveniles of the threatened organ pipe coral Tubipora<br />
musica attaching rocks, dead corals and rubble on the reef<br />
crest, fishes were mostly of large sizes. while site 18 has<br />
heavily condensed mangrove trees on both land and water<br />
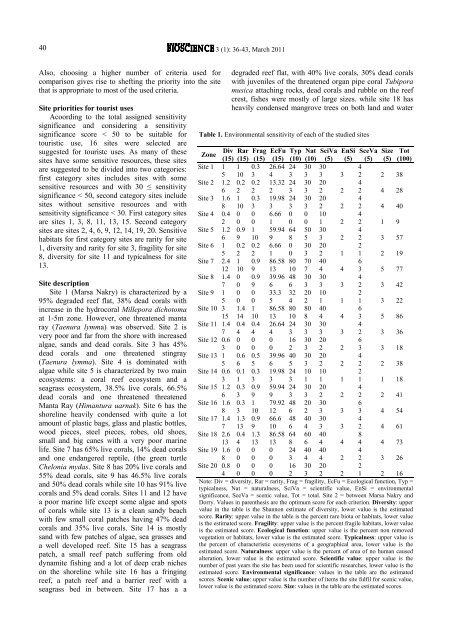
Table 1. Environmental sensitivity of each of the studied sites<br />
Zone<br />
Div Rar Frag EcFu Typ Nat SciVa EnSi SceVa Size Tot<br />
(15) (15) (15) (15) (10) (10) (5) (5) (5) (5) (100)<br />
Site 1 1 1 0.3 26.64 24 30 30 4<br />
5 10 3 4 3 3 3 3 2 2 38<br />
Site 2 1.2 0.2 0.2 13.32 24 30 20 4<br />
6 2 2 2 3 3 2 2 2 4 28<br />
Site 3 1.6 1 0.3 19.98 24 30 20 4<br />
8 10 3 3 3 3 2 2 2 4 40<br />
Site 4 0.4 0 0 6.66 0 0 10 4<br />
2 0 0 1 0 0 1 2 2 1 9<br />
Site 5 1.2 0.9 1 59.94 64 50 30 4<br />
6 9 10 9 8 5 3 2 2 3 57<br />
Site 6 1 0.2 0.2 6.66 0 30 20 2<br />
5 2 2 1 0 3 2 1 1 2 19<br />
Site 7 2.4 1 0.9 86.58 80 70 40 6<br />
12 10 9 13 10 7 4 4 3 5 77<br />
Site 8 1.4 0 0.9 39.96 48 30 30 4<br />
7 0 9 6 6 3 3 3 2 3 42<br />
Site 9 1 0 0 33.3 32 20 10 2<br />
5 0 0 5 4 2 1 1 1 3 22<br />
Site 10 3 1.4 1 86.58 80 80 40 6<br />
15 14 10 13 10 8 4 4 3 5 86<br />
Site 11 1.4 0.4 0.4 26.64 24 30 30 4<br />
7 4 4 4 3 3 3 3 2 3 36<br />
Site 12 0.6<br />
3<br />
0<br />
0<br />
0<br />
0<br />
0<br />
0<br />
16<br />
2<br />
30<br />
3<br />
20<br />
2 2<br />
6<br />
3 3 18<br />
Site 13 1 0.6 0.5 39.96 40 30 20 4<br />
5 6 5 6 5 3 2 2 2 2 38<br />
Site 14 0.6 0.1 0.3 19.98 24 10 10 2<br />
3 1 3 3 3 1 1 1 1 1 18<br />
Site 15 1.2 0.3 0.9 59.94 24 30 20 4<br />
6 3 9 9 3 3 2 2 2 2 41<br />
Site 16 1.6 0.3 1 79.92 48 20 30 6<br />
8 3 10 12 6 2 3 3 3 4 54<br />
Site 17 1.4<br />
7<br />
1.3<br />
13<br />
0.9<br />
9<br />
66.6<br />
10<br />
48<br />
6<br />
40<br />
4<br />
30<br />
3 3<br />
4<br />
2 4 61<br />
Site 18 2.6 0.4 1.3 86.58 64 60 40 8<br />
13 4 13 13 8 6 4 4 4 4 73<br />
Site 19 1.6<br />
8<br />
0<br />
0<br />
0<br />
0<br />
0<br />
0<br />
24<br />
3<br />
40<br />
4<br />
40<br />
4 2<br />
4<br />
2 3 26<br />
Site 20 0.8<br />
4<br />
0<br />
0<br />
0<br />
0<br />
0<br />
0<br />
16<br />
2<br />
30<br />
3<br />
20<br />
2 2<br />
2<br />
1 2 16<br />
Note: Div = diversity, Rar = rarity, Frag = fragility, EcFu = Ecological function, Typ =<br />
typicalness, Nat = naturalness, SciVa = scientific value, EnSi = environmental<br />
significance, SceVa = scenic value, Tot = total. Site 2 = between Marsa Nakry and<br />
Dorry. Values in parenthesis are the optimum score for each criterion. Diversity: upper<br />
value in the table is the Shannon estimate of diversity, lower value is the estimated<br />
score. Rarity: upper value in the table is the percent rare biota or habitats, lower value<br />
is the estimated score. Fragility: upper value is the percent fragile habitats, lower value<br />
is the estimated score. Ecological function: upper value is the percent non removed<br />
vegetation or habitats, lower value is the estimated score. Typicalness: upper value is<br />
the percent of characteristic ecosystems of a geographical area, lower value is the<br />
estimated score. Naturalness: upper value is the percent of area of no human caused<br />
alteration, lower value is the estimated score. Scientific value: upper value is the<br />
number of past years the site has been used for scientific researches, lower value is the<br />
estimated score. Environmental significance: values in the table are the estimated<br />
scores. Scenic value: upper value is the number of items the site fulfil for scenic value,<br />
lower value is the estimated score. Size: values in the table are the estimated scores.