ISSN 2087-3940 (PRINT) | ISSN 2087-3956 ... - Biodiversitas
ISSN 2087-3940 (PRINT) | ISSN 2087-3956 ... - Biodiversitas
ISSN 2087-3940 (PRINT) | ISSN 2087-3956 ... - Biodiversitas

You also want an ePaper? Increase the reach of your titles
YUMPU automatically turns print PDFs into web optimized ePapers that Google loves.
4<br />
3 (1): 1-6, March 2011<br />
The young leaves have a high cleavage activity. In the<br />
division process, DNA replication will experience, so the<br />
amount of DNA will double itself, thus DNA concentration<br />
is relatively high in young leaves. On older leaves, the<br />
division process could decrease, until finally stopped<br />
altogether. On the leaves that have yellowed, in addition to<br />
the absence of the division process, it also exacerbated the<br />
death of cells that were old, so the amount of DNA was<br />
also decreased dramatically (Salisbury and Ross 1995).<br />
Test the quality and quantity of DNA with UV-Vis<br />
spectrophotometer<br />
The quantity (concentration) and quality of DNA<br />
determined by UV-Vis spectrophotometer at wavelength<br />
260 and 280 nm. Determination of the total DNA quantity<br />
was calculated based on the value of absorbance at a<br />
wavelength of 260 nm. The highest DNA purity can be<br />
seen in the A260/280 ratio that produces the value of 1.8 to<br />
2. According to Sambrook et al. (1989) DNA with a ratio<br />
in the range of figures have met the requirements of purity<br />
required in molecular analysis. Spectrophotometer results<br />
show relatively good purity DNA that has yet to reach<br />
100% purity in some accessions. The concentration and<br />
purity of genomic DNA was analyzed using UV-Vis<br />
spectrophotometer can be seen in Table 1.<br />
Genomic DNA which has a purity of 100% contained in<br />
the accession J1 was extracted from the third leaf with<br />
value ratio of 1.9063. Genomic DNA from the first leaf<br />
accession J1 has a value ratios approaching 100% purity<br />
with ratio of 2.0131. While the three other leaves, that<br />
leaves the fifth, seventh, and yellow leaves have a value<br />
ratio of less than 1.8 respectively, 1.7417, 1.2578, and<br />
1.2356. Results DNA extraction leaves first, third, and fifth<br />
of the accession J2 has a value closer to purity ratio,<br />
respectively 2.0697, 2.0162, 2.0914, while the seventh<br />
leaves and yellow leaves have a ratio value that is still far<br />
from purity, namely 1.5873 and 1, 1940.<br />
On the accession of S1, almost all of the extracted DNA<br />
purity approaching leaves, each leaf of the first, third, fifth,<br />
and seventh ratio is 2.0768, 2.0116, 2.0792, 2.0225, while<br />
the yellow leaves have value ratio far from the purity of<br />
1.4434. DNA extracted first and third leaf from the<br />
accession of S2 close to the purity of the value ratio of<br />
2.0611 and 2.0856. While leaf fifth, seventh, and yellow<br />
leaves have a ratio that is far from the purity of the<br />
respective ratios 2.2187, 2.1782, and 1.5177.<br />
Besides the purity of genomic DNA samples, another<br />
consideration that must be considered is the quantity of<br />
genomic DNA was generated from the DNA extraction<br />
process. Readings A260 = 1 means the concentration of<br />
DNA obtained at 50 ug/mL (Herison 2003). The<br />
concentration of genomic DNA was extracted was<br />
calculated by the formula: DNA concentration (ug/mL) =<br />
A260 x dilution factor x 50 ug/mL.<br />
DNA concentration resulting from the extraction<br />
process represents the amount of DNA contained in the leaf<br />
tissue used for the sample and treatment methods used in<br />
each sample is the same. Table 1 below is the concentration<br />
of DNA from samples of twenty leaves from four<br />
accessions of jatropha plant that is used. From Table 1,<br />
note the concentration ratio of genomic DNA from leaf<br />
tissue of each first, third, fifth, seventh, and yellow leaves,<br />
and comparison of genomic DNA concentration between<br />
sections. In general, genomic DNA concentration<br />
decreased with increasing age of leaves used as a sample.<br />
Samples from the first leaf shows the quantity of<br />
genomic DNA is much larger than the sample leaves the<br />
third, fifth, seventh, and yellow leaves. Measurement of the<br />
quantity of genomic DNA samples from accessions J1<br />
genomic DNA in Klaten produces relatively little<br />
compared to the accession of J2, S1, and S2, which is 27.69<br />
ug/mL for the first leaf, 19.33 ug/mL for the third leaf, 3.68<br />
tg/mL for the fifth leaf, 2.03 g/mL for the seventh leaf, and<br />
4.51 ug/mL for yellow leaves. This is due to a smaller<br />
sample size compared to other accessions due to spill some<br />
of the samples by laboratory staff who worked on, so that<br />
DNA samples that were tested got reduced. While the<br />
accession J2, where accession was also derived from the<br />
same home with the accession of J1, which was from<br />
Klaten, Central Java, and comes from the same parent, the<br />
quantity of genomic DNA generated greater than J1, which<br />
is 62.06 ug/mL for the extraction of the first leaf, 26.21<br />
ug/mL for the third leaf, 27.69 ug/mL for the fifth leaf,<br />
5.37 g/mL for the seventh leaf, and 4.37 ug/mL for yellow<br />
leaves.<br />
The concentration of genomic DNA for S1 accession on<br />
the first leaves produced 67.61 g/mL DNA, whereas the<br />
third leaf, the concentration of genomic DNA was 31.20<br />
ug/mL, on the fifth leaves of 46.71 ug/mL, on the seventh<br />
leaf, 22, 90 ug/mL, and the yellow leaves of 7.59 g/mL.<br />
Accession S2 on the first leaves produced 101.35 g/mL<br />
genomic DNA, while the third leaf, the concentration of<br />
genomic DNA was 61.03 ug/mL, on the fifth leaves of<br />
44.18 ug/mL, leaves the seventh, 26.27 ug/mL , and the<br />
yellow leaves of 5.37 g/mL. The Figure 1 shows the<br />
concentration of the extracted genomic DNA of<br />
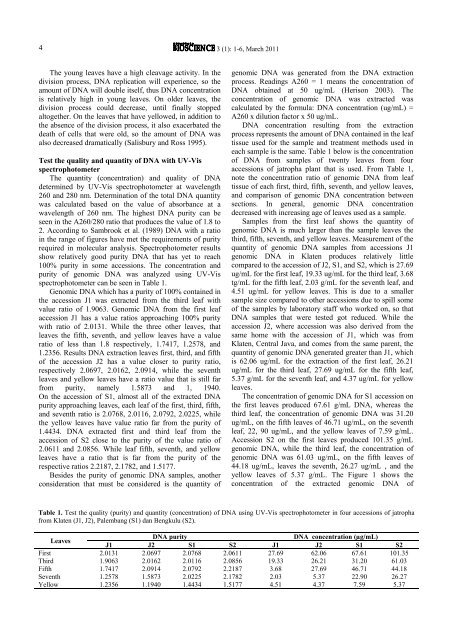
Table 1. Test the quality (purity) and quantity (concentration) of DNA using UV-Vis spectrophotometer in four accessions of jatropha<br />
from Klaten (J1, J2), Palembang (S1) dan Bengkulu (S2).<br />
Leaves<br />
DNA purity<br />
DNA concentration (µg/mL)<br />
J1 J2 S1 S2 J1 J2 S1 S2<br />
First 2.0131 2.0697 2.0768 2.0611 27.69 62.06 67.61 101.35<br />
Third 1.9063 2.0162 2.0116 2.0856 19.33 26.21 31.20 61.03<br />
Fifth 1.7417 2.0914 2.0792 2.2187 3.68 27.69 46.71 44.18<br />
Seventh 1.2578 1.5873 2.0225 2.1782 2.03 5.37 22.90 26.27<br />
Yellow 1.2356 1.1940 1.4434 1.5177 4.51 4.37 7.59 5.37