Report - Wollongong City Council - NSW Government
Report - Wollongong City Council - NSW Government
Report - Wollongong City Council - NSW Government

You also want an ePaper? Increase the reach of your titles
YUMPU automatically turns print PDFs into web optimized ePapers that Google loves.
<strong>Wollongong</strong> <strong>City</strong> <strong>Council</strong><br />
Coastal Zone Study<br />
Volume 1 – Main <strong>Report</strong><br />
LJ2822/R2564/v2<br />
Prepared for <strong>Wollongong</strong> <strong>City</strong> <strong>Council</strong>*<br />
30 June 2010
<strong>Wollongong</strong> <strong>City</strong> <strong>Council</strong> Coastal Zone Study<br />
Prepared for <strong>Wollongong</strong> <strong>City</strong> <strong>Council</strong><br />
Cardno (<strong>NSW</strong>/ACT) Pty Ltd<br />
Trading as Cardno Lawson Treloar Pty Ltd<br />
ABN 95 001 145 035<br />
Level 2, 910 Pacific Highway<br />
Gordon <strong>NSW</strong> 2072<br />
Australia<br />
Telephone: 02 9499 3000<br />
Facsimile: 02 9499 3033<br />
International: +61 2 9499 3000<br />
www.cardno.com.au<br />
<strong>Report</strong> No:_____<br />
Document Control<br />
Version Status Date Author Reviewer<br />
1 DRAFT 29 April 2010<br />
Sean Garber,<br />
Shani Archer and<br />
Tanja Mackenzie<br />
SJG<br />
SCA<br />
TJM<br />
Doug Treloar<br />
PDT<br />
2 FINAL 30 June 2010<br />
Sean Garber and<br />
Shani Archer<br />
SJG<br />
SCA<br />
Doug Treloar<br />
PDT<br />
*<strong>Wollongong</strong> <strong>City</strong> <strong>Council</strong> has prepared this document with financial assistance from the <strong>NSW</strong> <strong>Government</strong><br />
through the Department of Environment, Climate Change and Water. This document does not necessarily<br />
represent the opinions of the <strong>NSW</strong> <strong>Government</strong> or the Department of Environment, Climate Change and Water.<br />
"© 2010 Cardno (<strong>NSW</strong>/ACT) Pty Ltd Trading as Cardno Lawson Treloar Pty Ltd All Rights Reserved. Copyright<br />
in the whole and every part of this document belongs to Cardno (<strong>NSW</strong>/ACT) Pty Ltd Trading as Cardno Lawson<br />
Treloar Pty Ltd and may not be used, sold, transferred, copied or reproduced in whole or in part in any manner<br />
or form or in or on any media to any person without the prior written consent of Cardno (<strong>NSW</strong>/ACT) Pty Ltd<br />
Trading as Cardno Lawson Treloar Pty Ltd.”
<strong>Wollongong</strong> <strong>City</strong> <strong>Council</strong> Coastal Zone Study<br />
Prepared for <strong>Wollongong</strong> <strong>City</strong> <strong>Council</strong><br />
Executive Summary<br />
Cardno Lawson Treloar was engaged by <strong>Wollongong</strong> <strong>City</strong> <strong>Council</strong> (WCC) to undertake a Coastal<br />
Zone Study for the <strong>Wollongong</strong> Local <strong>Government</strong> Area (LGA). The study was conducted between<br />
June 2009 and May 2010 and included the following elements: a series of site inspections of the<br />
study area, detailed studies of the coastal and geotechnical processes affecting the study area and<br />
targeted stakeholder consultation.<br />
The study area includes the coastal zone of the <strong>Wollongong</strong> LGA, extending from the shores of Lake<br />
Illawarra and the Windang Peninsula in the south to the Royal National Park in the north. It covers<br />
approximately 60km of coastline and includes those portions of the coastal zone that are under the<br />
influence of coastal processes, including the beaches, dunes, headlands, bluffs, estuary entrances<br />
and near shore waters. The coastline consists of a series of embayed sandy beach compartments<br />
with a headland or rock shelf at each end and separated by sandstone cliffs. Note that Port Kembla<br />
Harbour was not included in the study area.<br />
ES1 Coastal Processes<br />
A range of coastal processes were assessed in order to determine coastal hazard magnitudes<br />
throughout the study area. They included:-<br />
• Water Levels and Wave Climate<br />
• Wave Run-up and Overtopping<br />
• Historical Beach Changes - Long Term Shoreline Recession<br />
• Storm Demand<br />
• Geotechnical Hazard<br />
Wave Levels and Wave Climate<br />
Design wave conditions at the site are dominated by waves breaking in near shore depths that may<br />
be as shallow as 4 to 6m. Due to the dominance of breaking wave conditions, the SWAN model has<br />
been used to determine peak storm wave conditions at selected locations within the study site for<br />
return periods of between 5 and 100-years ARI. Near shore wave conditions have been obtained at<br />
sites for cliff locations and offshore of the beach compartment areas. Along the study site, wave<br />
heights and associated breaking wave water depths are strongly influenced by the offshore wave<br />
directions. The beaches within the study site are most exposed to waves from the east to south-east<br />
sector. The critical offshore wave direction for the <strong>Wollongong</strong> beaches is generally east-south-east<br />
(ESE), being the offshore wave direction that leads to the largest near-shore wave heights for a<br />
specified offshore wave height. The critical wave direction for cliff and headland regions is strongly<br />
dependent on the aspect (or exposure) of the cliff to the offshore wave direction.<br />
Wave set-up is an important component in the design water level observed at the shoreline of the<br />
study area. Considering an open beach, when wave breaking occurs, there is an increase in water<br />
level in the direction of the shoreline. This process is referred to as wave set-up. Design still water<br />
levels, including local wave set-up, were derived along the coast and are integral in the definition of<br />
erosion and inundation hazards.<br />
Wave run-up is an important process for the consideration of wave overtopping rates for cliffs and<br />
structures as well as cliff stability. Empirical formulae for the estimation of irregular wave run-up on<br />
rough impermeable slopes were adopted to define the vertical distance between the still water level<br />
and the elevation exceeded by 2 percent of the run-up distribution (that is, for every 100 incident<br />
waves, two waves would have a run-up elevation exceeding this level). These outcomes were utilised<br />
in the geotechnical and tidal inundation investigations.<br />
30 June 2010 Cardno Lawson Treloar Pty Ltd Page i<br />
H:\Doc\2010\<strong>Report</strong>s.2010\Rep2564v2.doc
<strong>Wollongong</strong> <strong>City</strong> <strong>Council</strong> Coastal Zone Study<br />
Prepared for <strong>Wollongong</strong> <strong>City</strong> <strong>Council</strong><br />
Historical Beach Change<br />
Photogrammetric data for 11 sandy beach areas within the study site were obtained from DECCW. A<br />
full range of analyses were undertaken to determine the historical beach change at these sites. It was<br />
found that there is presently no evidence of long term shoreline recession or loss of beach volume.<br />
For almost all locations, the minimum beach volume was observed from the 1974 profiles. The data<br />
for these profiles was collected approximately 5 months after the May and June 1974 storms that<br />
caused extensive erosion along the <strong>NSW</strong> coast. The storm erosion which was observed along the<br />
mid-<strong>NSW</strong> coast during 1974 was the most severe in recent history and has commonly been adopted<br />
as the ‘design’ erosion event for this section of coast. However, since then almost all the profiles<br />
have shown a steady accretion of beach width and beach volume. To this end no long-term shoreline<br />
recession could be indentified and was therefore adopted to be zero (for present MSL) for the<br />
determination of erosion hazard lines.<br />
Storm Demand<br />
Erosion hazard associated with storm events was quantified for the 100-years ARI design event in<br />
order to develop appropriate risk based foreshore planning controls. Numerical modelling of a series<br />
of beach profiles was undertaken to quantify the storm demand under this design storm erosion<br />
condition.<br />
At the commencement of the study an overall DEM was developed from all available topographic and<br />
bathymetric data. This included high resolution airborne laser survey (ALS) data over the beach<br />
areas. For the beach areas where photogrammetric data was unavailable, profiles were extracted<br />
from the DEM for the purposes of erosion hazard mapping.<br />
SBEACH was used to model the storm erosion resulting from 100-years ARI storm parameters,<br />
adopting a 7-days storm event at a number profiles within each beach compartment in order to<br />
describe the variation in storm demand along the <strong>Wollongong</strong> coast. These storm ‘hydrographs’<br />
include varying wave parameters and tide level. The resulting storm demand values varied<br />
significantly amongst beaches, as erosion is dependent upon wave conditions (relative exposure),<br />
profile shape and the presence of rock layers.<br />
It is typically considered that the 100-years ARI high storm demand for open coast beaches along the<br />
<strong>NSW</strong> coast is 250m 3 /m. Similarly, low storm demand is defined at 160m 3 /m above -1m AHD for open<br />
coast beaches. In light of the fact that there was no appropriate data to validate the storm demand<br />
modelling, the outcomes were calibrated to these commonly adopted storm demand values. That is,<br />
in the southern region of the study area there are beaches that fulfil the description of an open coast,<br />
fully-exposed sandy beach. The largest observed storm demand (213m 3 /m) on Bulli Beach was<br />
scaled up to the 250m 3 /m value and the SBEACH analyses also showed that Bulli Beach was the<br />
most exposed in terms of erosion. Storm demand requirements on other beaches were scaled<br />
accordingly in terms of their relative exposure. In this way the storm demand modelling provided the<br />
relative exposure of each beach.<br />
Geotechnical Hazard<br />
The <strong>Wollongong</strong> LGA is known to be an area of many geotechnical hazards with numerous slope and<br />
cliff instability issues being documented in recent years. As a result <strong>Council</strong> has well established<br />
planning requirements for individual development applications that require the completion of site<br />
specific geotechnical assessments. As part of the coastal processes and hazard investigations,<br />
Cardno Lawson Treloar engaged GHD Geotechnics to undertaken a slope and cliff stability<br />
assessment of the <strong>Wollongong</strong> LGA as it relates to coastal processes.<br />
30 June 2010 Cardno Lawson Treloar Pty Ltd Page ii<br />
H:\Doc\2010\<strong>Report</strong>s.2010\Rep2564v2.doc
<strong>Wollongong</strong> <strong>City</strong> <strong>Council</strong> Coastal Zone Study<br />
Prepared for <strong>Wollongong</strong> <strong>City</strong> <strong>Council</strong><br />
The main objective of this assessment was to establish a framework or criteria within which current or<br />
potential future geotechnical hazards are deemed to be influenced by coastal processes for planning<br />
purposes. This resulted in the definition of a Coastal-Influenced Geotechnical Hazard Zone, defined<br />
as follows:-<br />
“The Coastal-Influenced Geotechnical Hazard Zone includes areas where coastal processes<br />
(including climate change) will directly influence geotechnical hazards for the defined study time<br />
period to 2100. Geotechnical assessments of proposed or future development in accordance with<br />
<strong>Wollongong</strong> <strong>City</strong> <strong>Council</strong>’s Development Control Plan requirements should include specific<br />
assessment of coastal processes if located within this Zone.” – GHD (2010).<br />
To undertake this assessment Cardno Lawson Treloar provided GHD with a range of coastal<br />
processes, hazard and climate change information (as described in this report) including:-<br />
• Sea Level Rise Projections<br />
• Rainfall Predictions<br />
• Erosion Hazard Extents<br />
• Cliff Wave Run-up Levels<br />
• Wave Inundation Extents.<br />
ES2 Coastal Hazards<br />
Erosion Hazard<br />
The present day, 2050 and 2100-years hazard extents have been determined along all beaches<br />
within the study area at selected profile locations using site specific wave climate and beach profile<br />
information. For each planning period two hazard extents are specified:-<br />
• Immediate Impact Zone – the landward extent of the eroded scarp following the 100-years<br />
design event at the end of the specified planning period.<br />
• Zone of Reduced Foundation Capacity – the zone in which any structure will require piles to<br />
extend below a site specific specified level in order to prevent failure following the design<br />
storm erosion extent and scarp slumping.<br />
The hazard zones have been calculated using the method described by Nielsen et al (1992). An<br />
average beach profile based on either available photogrammetric data or ALS data was used to<br />
calculate the baseline volume, and average ground level for each profile location. The beach-specific<br />
storm erosion volume was taken from the storm demand results for each beach profile and applied to<br />
this methodology. Sets of hazard lines were then produced for the existing, 2050 and 2100 planning<br />
horizons that include beach response to sea level rise based on the <strong>NSW</strong> Sea level rise benchmarks.<br />
Erosion hazard definition at the ends of the beach compartments required some extrapolation of the<br />
storm demand/recession results and considered the presence of rock headland and cliff features.<br />
These areas of the mapping underwent review and incorporated the geotechnical advice (slope and<br />
cliff stability) that was undertaken by GHD as part of this overall study.<br />
Lagoon entrances are formed by both catchment and ocean processes and hence the definition of the<br />
erosion hazard line required some consideration. Catchment flooding was beyond the scope of this<br />
study and therefore lagoon entrance breakout events were not investigated. The erosion hazard<br />
through the lagoon entrance areas was therefore defined at the design water levels. Should the<br />
entrance be open during an ocean storm event, waves may penetrate into the lagoon and attack the<br />
shorelines at the storm tide level. Future catchment studies should consider entrance breakout<br />
processes and would need to define a second erosion hazard line through these areas, which may be<br />
30 June 2010 Cardno Lawson Treloar Pty Ltd Page iii<br />
H:\Doc\2010\<strong>Report</strong>s.2010\Rep2564v2.doc
<strong>Wollongong</strong> <strong>City</strong> <strong>Council</strong> Coastal Zone Study<br />
Prepared for <strong>Wollongong</strong> <strong>City</strong> <strong>Council</strong><br />
greater in extent. No erosion hazard line was defined for the Lake Illawarra foreshore as its definition<br />
is not appropriate for estuarine systems.<br />
Inundation Hazard<br />
Ocean inundation extent is defined as the point to which wave overtopping and run-up occurs. Wave<br />
overtopping and inundation modelling has been undertaken for the existing, 2050 and 2100 climate<br />
change scenarios. These studies identified the areas subject to wave inundation from the 100-years<br />
ARI ocean storm. The scenarios assume an eroded beach, therefore wave inundation extends from<br />
the relevant erosion hazard line. The inundation modelling was undertaken in 2D over the entire<br />
back-beach area to a land level of 10mAHD. Topographical information of the back-beach area<br />
integrated into the modelling setup allows the spatial definition and mapping of these inundation<br />
hazard lines.<br />
It is noted that structures (including buildings and stormwater infrastructure) are not described in the<br />
modelling and hence the inundation extents provided can be considered conservative. The duration<br />
of inundation would be much shorter than that of catchment flooding and would correspond to the<br />
peak of the high (storm) tide, being in the order of 1-2 hours, after which it is considered that the<br />
stormwater systems within the affected areas would be sufficient to allow the drainage of the ocean<br />
waters. Even though some drains may be so low that they become flooded as a result of sea level<br />
rise, the fall in astronomical tide level, which will be unaltered, will cause cessation of wave<br />
overtopping and a lower ocean-side water level and then provide a head that will drain the inundated<br />
areas. Apart from some ponding, most of the beach areas will drain naturally back to sea as the tide<br />
falls.<br />
The inundation hazard extents identify areas that would be potentially subject to inundation under the<br />
100-years ARI ocean storm event and consider the eroded form of the beach as well as the likely<br />
wave characteristics that cause overtopping.<br />
Inundation of the shoreline areas around Lake Illawarra may result from catchment flows, storm<br />
surge, wave overtopping or a combination of these phenomena. Recent investigations undertaken as<br />
part of the Lake Illawarra Floodplain Risk Management Study and Plan have defined peak flood levels<br />
within the Lake. That study utilised a full-process Delft3D model of Lake Illawarra. The model<br />
includes catchment flows as well as realistic ocean boundary conditions, for example, tides, waves<br />
and storm surge. The model included sediment transport calculations and morphological change so<br />
that the opening of the entrance during a flood is realistically simulated.<br />
A range of scenarios were modelled and relevant results were utilised for inundation mapping within<br />
this study. Inundation mapping of the Lake Illawarra foreshore area was undertaken for the 100-years<br />
ARI event (considering both catchment and ocean processes) under both existing and sea level rise<br />
scenarios, being the 2050 and 2100 planning horizons.<br />
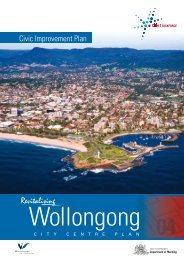
Hazard Mapping<br />
Erosion and Inundation Hazard extents were developed for each beach compartment considering the<br />
storm demand and wave overtopping for a 100-years ARI event for the present day and out to the<br />
2100 planning horizon. An example set of hazard lines are provided for Stanwell Park beach in<br />
Figure ES1 below. The Coastal Influenced Geotechnical Hazard Zone was also mapped.<br />
These hazard definitions may form the basis of <strong>Council</strong>’s foreshore planning policy.<br />
30 June 2010 Cardno Lawson Treloar Pty Ltd Page iv<br />
H:\Doc\2010\<strong>Report</strong>s.2010\Rep2564v2.doc
<strong>Wollongong</strong> <strong>City</strong> <strong>Council</strong> Coastal Zone Study<br />
Prepared for <strong>Wollongong</strong> <strong>City</strong> <strong>Council</strong><br />
Figure ES1: Erosion and Inundation Hazard Mapping at Stanwell Park Beach<br />
ES3 Risk Assessment<br />
A preliminary risk assessment was undertaken for the <strong>Wollongong</strong> coastal zone, whereby the spatial<br />
mapping gathered in relation to coastal features was overlaid with the erosion hazard extents. Erosion<br />
hazard is considered the key risk to assets located within the coastal zone.<br />
The preliminary risk assessment seeks to identify cadastral parcels, public assets, heritage items and<br />
significant ecological features that will be at risk due to storm erosion for each planning horizon (i.e.<br />
2010, 2050 and 2100). An item or site has been identified as being at risk if it is located within the<br />
erosion hazard line for that planning period. However, in the case of cadastral parcels and roads,<br />
these assets have been identified as being at risk if they are located within the zone of reduced<br />
foundation capacity for that respective planning period.<br />
The risk assessment provides an indication of the extent to which assets are at risk from coastal<br />
hazards. Despite the preliminary nature of the assessment, it is apparent that there is some potential<br />
for assets (mostly public assets) to be directly affected by coastal processes and that this risk is likely<br />
to increase over time due to the effects of climate change (in this case, SLR and associated shoreline<br />
30 June 2010 Cardno Lawson Treloar Pty Ltd Page v<br />
H:\Doc\2010\<strong>Report</strong>s.2010\Rep2564v2.doc
<strong>Wollongong</strong> <strong>City</strong> <strong>Council</strong> Coastal Zone Study<br />
Prepared for <strong>Wollongong</strong> <strong>City</strong> <strong>Council</strong><br />
recession). Where reference is made to private properties or other buildings located on a specific<br />
cadastral parcel being at risk from erosion hazard, it is considered that a more detailed, site specific<br />
investigation of coastal processes would be recommended to confirm the findings of this study.<br />
Only those assets for which mapping was available were considered in this assessment. It is noted<br />
that the full extent of the assets affected by erosion hazard is likely to be significantly greater than<br />
those considered as part of this assessment, particularly where inundation hazard is taken into<br />
account. It is recommended that a detailed audit be undertaken to fully quantify the risk and develop<br />
a risk management strategy.<br />
30 June 2010 Cardno Lawson Treloar Pty Ltd Page vi<br />
H:\Doc\2010\<strong>Report</strong>s.2010\Rep2564v2.doc
<strong>Wollongong</strong> <strong>City</strong> <strong>Council</strong> Coastal Zone Study<br />
Prepared for <strong>Wollongong</strong> <strong>City</strong> <strong>Council</strong><br />
Table of Contents<br />
Glossary and Abbreviations ............................................................................................................. xiii<br />
1 Introduction ................................................................................................................................... 1<br />
1.1 Background ............................................................................................................................. 1<br />
1.2 The Study Area ....................................................................................................................... 1<br />
1.3 Coastal Management Process ................................................................................................ 1<br />
1.4 Objectives ................................................................................................................................ 3<br />
1.5 Document Structure ................................................................................................................ 3<br />
2 Relevant Legislation and Policy .................................................................................................. 4<br />
2.1 Legislation ............................................................................................................................... 4<br />
2.2 Policies and Guidelines ........................................................................................................... 5<br />
3 Coastal Processes and Hazards .................................................................................................. 7<br />
3.1 Wave Processes ..................................................................................................................... 7<br />
3.2 Water Levels ......................................................................................................................... 10<br />
3.3 Coastal Inundation ................................................................................................................ 12<br />
3.4 Tsunami ................................................................................................................................. 13<br />
3.5 Sediment Transport, Storm Erosion and Recession ............................................................. 13<br />
3.6 Sand Drift .............................................................................................................................. 14<br />
3.7 Climate Change..................................................................................................................... 15<br />
4 Study Methodology and Data ..................................................................................................... 19<br />
4.1 Model Systems ...................................................................................................................... 19<br />
4.2 Data Inputs ............................................................................................................................ 20<br />
5 Coastal Processes and Hazard Definition ................................................................................ 26<br />
5.1 Nearshore Wave Climate ...................................................................................................... 26<br />
5.2 Wave Set-up .......................................................................................................................... 27<br />
5.3 Wave Run-up on Cliffs .......................................................................................................... 27<br />
5.4 Coastal Inundation of Back-Beach Areas ............................................................................. 28<br />
5.5 Sediment Transport and Historical Beach Change ............................................................... 31<br />
5.6 Shoreline Recession ............................................................................................................. 35<br />
6 Geotechnical and Slope Instability Investigations .................................................................. 39<br />
30 June 2010 Cardno Lawson Treloar Pty Ltd Page vii<br />
H:\Doc\2010\<strong>Report</strong>s.2010\Rep2564v2.Doc
<strong>Wollongong</strong> <strong>City</strong> <strong>Council</strong> Coastal Zone Study<br />
Prepared for <strong>Wollongong</strong> <strong>City</strong> <strong>Council</strong><br />
7 Coastal Features – Values and Significance ............................................................................ 40<br />
7.1 Overview ............................................................................................................................... 40<br />
7.2 Consultation .......................................................................................................................... 40<br />
7.3 Ecological Features ............................................................................................................... 41<br />
7.4 Estuary Condition Assessment ............................................................................................. 47<br />
7.5 Land Use and Land Tenure .................................................................................................. 51<br />
7.6 Human Usage of the Coastal Zone ....................................................................................... 52<br />
7.7 Economic Value of the Coastal Zone .................................................................................... 59<br />
7.8 Management Issues .............................................................................................................. 61<br />
7.9 Values and Significance of the Coastal Zone ....................................................................... 62<br />
8 Coastal Risk Assessment .......................................................................................................... 64<br />
8.1 Erosion Hazard Extents ........................................................................................................ 64<br />
8.2 Inundation Hazard Extents .................................................................................................... 65<br />
8.3 Risk Assessment ................................................................................................................... 66<br />
9 Qualifications and Assumptions ............................................................................................... 77<br />
10 Conclusions and Recommendations .................................................................................... 79<br />
11 References ............................................................................................................................... 80<br />
List of Tables<br />
Table 3.1: Tidal Planes for Port Kembla (after National Tide Tables, 2010) ..................................... 12<br />
Table 3.2: Water Level Components of SLR Planning Benchmarks (after DECCW, 2009a and b) . 16<br />
Table 4.1: Median Sediment Diameter (D 50 ) Values at Profile Modelling Sites ................................ 22<br />
Table 4.2: Available Photogrammetric Data ...................................................................................... 23<br />
Table 4.3: Extreme Water Levels at Fort Denison (Source: DECCW, 2010) .................................... 24<br />
Table 4.4: Peak Offshore Storm Wave Conditions Based on the Botany Bay WRB 1971-1985 ...... 25<br />
Table 5.1:<br />
100-years ARI Flood Levels (mAHD) in Lake Illawarra from Storm Surge and Catchment<br />
Events ............................................................................................................................... 31<br />
Table 5.2: Maximum Beach Volume Losses (above 0mAHD) .......................................................... 32<br />
Table 5.3: Storm Demand Results (above 0mAHD) ......................................................................... 37<br />
Table 7.1: Threatened Fauna Species .............................................................................................. 43<br />
30 June 2010 Cardno Lawson Treloar Pty Ltd Page viii<br />
H:\Doc\2010\<strong>Report</strong>s.2010\Rep2564v2.Doc
<strong>Wollongong</strong> <strong>City</strong> <strong>Council</strong> Coastal Zone Study<br />
Prepared for <strong>Wollongong</strong> <strong>City</strong> <strong>Council</strong><br />
Table 7.2: Threatened Flora Species ................................................................................................ 45<br />
Table 7.3: Changes in Area & Percent Cover of Dune & Estuarine Vegetation 1977-2006 ............. 46<br />
Table 7.4: Estuary Condition Assessment ......................................................................................... 49<br />
Table 7.5: Recreational Opportunities in the <strong>Wollongong</strong> Coastal Zone .......................................... 54<br />
Table 7.6: Places Registered on the Register of the National Estate ............................................... 58<br />
Table 7.7: Places/Items Listed on the State Heritage Register. ........................................................ 58<br />
Table 7.8: Values and Significance of the <strong>Wollongong</strong> Coastal Zone .............................................. 62<br />
Table 8.1: Risk Assessment: Stanwell Park Beach (see Figure 8.1 and Figure 8.14) ...................... 67<br />
Table 8.2: Risk Assessment: Coalcliff Beach (see Figure 8.2 and Figure 8.15) ............................... 67<br />
Table 8.3: Risk Assessment: Scarborough/Wombarra Beach (see Figure 8.3 and Figure 8.16) ..... 68<br />
Table 8.4: Risk Assessment: Coledale Beach (see Figure 8.4 and Figure 8.17) .............................. 68<br />
Table 8.5: Risk Assessment: Sharkies Beach (see Figure 8.5 and Figure 8.18) .............................. 69<br />
Table 8.6:<br />
Risk Assessment: Austinmer & Austinmer North Beaches (see Figure 8.6 and Figure<br />
8.19) .................................................................................................................................. 69<br />
Table 8.7: Risk Assessment: Thirroul Beach (see Figure 8.7 and Figure 8.20) ................................ 70<br />
Table 8.8: Risk Assessment: McCauley’s Beach (see Figure 8.7 and Figure 8.20) ......................... 71<br />
Table 8.9: Risk Assessment: Sandon Point Beach (see Figure 8.8 and Figure 8.21) ...................... 71<br />
Table 8.10: Risk Assessment: Bulli Beach (see Figure 8.8 and Figure 8.21) ..................................... 72<br />
Table 8.11: Risk Assessment: Woonona/Bellambi Beach (see Figure 8.9 and Figure 8.22) ............. 72<br />
Table 8.12: Risk Assessment: Bellambi Harbour, Bellambi Point and Corrimal Beaches (see Figure<br />
8.10 and Figure 8.23) ....................................................................................................... 73<br />
Table 8.13: Risk Assessment: Towradgi/Fairy Meadow & North <strong>Wollongong</strong> Beaches (see Figure<br />
8.11 and Figure 8.24) ....................................................................................................... 73<br />
Table 8.14: Risk Assessment: <strong>Wollongong</strong> <strong>City</strong> / Coniston Beach (see Figure 8.12 and Figure 8.25)<br />
.......................................................................................................................................... 74<br />
Table 8.15: Risk Assessment: Perkins Beach (see Figure 8.13 and Figure 8.26) .............................. 75<br />
Table 8.16: Risk Assessment: Lake Illawarra (see Figures 8.27 A-C) ................................................ 75<br />
Table 8.17: Coastal-Influenced Geotechnical Hazard Extents, by Suburb ......................................... 76<br />
List of Figures<br />
Figure 1.1:<br />
Figure 1.2A-C:<br />
Study Area<br />
Study Beaches<br />
30 June 2010 Cardno Lawson Treloar Pty Ltd Page ix<br />
H:\Doc\2010\<strong>Report</strong>s.2010\Rep2564v2.Doc
<strong>Wollongong</strong> <strong>City</strong> <strong>Council</strong> Coastal Zone Study<br />
Prepared for <strong>Wollongong</strong> <strong>City</strong> <strong>Council</strong><br />
Figure 4.1:<br />
Figure 4.2:<br />
Figure 4.3:<br />
Swan Wave Model Domains<br />
Swan Wave Model Calibration<br />
D3D Overtopping Grid – ALS Data Sandon Point Beach<br />
Figure 4.4: Annual Offshore Wave Climate Port Kembla WRB 1992-2005<br />
Figure 4.5: Seasonal Offshore Wave Climate Port Kembla WRB 1992<br />
Figure 4.6:<br />
Comparison Of Offshore Wave Heights Long Reef (Sydney) and Port Kembla<br />
WRB’s<br />
Figure 4.7: Peak Offshore Wave Heights Port Kembla WRB 1987-2005<br />
Figure 4.8: Peak Offshore Wave Conditions Botany Bay WRB 1971-1985<br />
Figure 4.9:<br />
Figure 5.1-5.6:<br />
Figure 5.7<br />
Figure 7.1A-C:<br />
<strong>Wollongong</strong> 90 Day Rainfall Ari’s With Climate Change Scenarios<br />
Cliff, Beach and Offshore Wave Data Locations<br />
7 Day - 100 Year ARI Storm Hydrograph<br />
Ecological Attributes<br />
Figure 7.2: Changes in the Area of Dune and Estuarine Vegetation between 1977 and 2006<br />
Figure 7.3A-C:<br />
Figure 7.4A-C:<br />
Figure 7.5A-C:<br />
Figure 7.6A-C:<br />
Figure 7.7A-C:<br />
Figure 7.8A-C:<br />
Figure 7.9A-C:<br />
1977 Vegetation Extent and Percent Cover<br />
1987 Vegetation Extent and Percent Cover<br />
1999 Vegetation Extent and Percent Cover<br />
2006 Vegetation Extent and Percent Cover<br />
Vegetation Restoration Works<br />
Land Tenure<br />
Recreation<br />
Figures 7.10A-C: Heritage<br />
Figure 8.1:<br />
Figure 8.2:<br />
Figure 8.3:<br />
Figure 8.4:<br />
Figure 8.5:<br />
Figure 8.6:<br />
Figure 8.7:<br />
Figure 8.8:<br />
Figure 8.9:<br />
Erosion Hazard Extents – Stanwell Park Beach<br />
Erosion Hazard Extents – Coalcliff Beach<br />
Erosion Hazard Extents – Scarborough/Wombarra Beach<br />
Erosion Hazard Extents – Coledale Beach<br />
Erosion Hazard Extents – Sharkies Beach<br />
Erosion Hazard Extents – Austinmer & Austinmer North Beaches<br />
Erosion Hazard Extents – Thirroul & McCauley’s Beach<br />
Erosion Hazard Extents – Sandon Point & Bulli Beaches<br />
Erosion Hazard Extents – Woonona/Bellambi Beach<br />
30 June 2010 Cardno Lawson Treloar Pty Ltd Page x<br />
H:\Doc\2010\<strong>Report</strong>s.2010\Rep2564v2.Doc
<strong>Wollongong</strong> <strong>City</strong> <strong>Council</strong> Coastal Zone Study<br />
Prepared for <strong>Wollongong</strong> <strong>City</strong> <strong>Council</strong><br />
Figure 8.10:<br />
Figure 8.11:<br />
Figure 8.12:<br />
Figure 8.13:<br />
Figure 8.14:<br />
Figure 8.15:<br />
Figure 8.16:<br />
Figure 8.17:<br />
Figure 8.18:<br />
Figure 8.19:<br />
Figure 8.20:<br />
Figure 8.21:<br />
Figure 8.22:<br />
Figure 8.23:<br />
Figure 8.24:<br />
Figure 8.25:<br />
Figure 8.26:<br />
Erosion Hazard Extents – Bellambi Point & Corrimal Beaches<br />
Erosion Hazard Extents – Towradgi/Fairy Meadow & North <strong>Wollongong</strong> Beaches<br />
Erosion Hazard Extents – <strong>Wollongong</strong> <strong>City</strong>/Coniston Beach<br />
Erosion Hazard Extents – Perkins Beach<br />
Ocean Inundation Extents – Stanwell Park Beach<br />
Ocean Inundation Extents – Coalcliff Beach<br />
Ocean Inundation Extents – Scarborough/Wombarra Beach<br />
Ocean Inundation Extents – Coledale Beach<br />
Ocean Inundation Extents – Sharkies Beach<br />
Ocean Inundation Extents – Austinmer & Austinmer North Beaches<br />
Ocean Inundation Extents – Thirroul & McCauley’s Beach<br />
Ocean Inundation Extents – Sandon Point & Bulli Beaches<br />
Ocean Inundation Extents – Woonona/Bellambi Beach<br />
Ocean Inundation Extents – Bellambi Point & Corrimal Beaches<br />
Ocean Inundation Extents – Towradgi/Fairy Meadow & North <strong>Wollongong</strong> . Beaches<br />
Ocean Inundation Extents – <strong>Wollongong</strong> <strong>City</strong>/Coniston Beach<br />
Ocean Inundation Extents – Perkins Beach<br />
Figure 8.27 A-C: Lake Illawarra Flood Extents – 100-years ARI Ocean Storm Inundation<br />
Figure 8.28 A-C: Lake Illawarra Flood Extents – 100-years ARI Catchment Flooding<br />
Appendices<br />
Appendix A<br />
Appendix B<br />
Appendix C<br />
Appendix D<br />
Appendix E<br />
Appendix F<br />
Appendix G<br />
Appendix H<br />
WCC Geotechnical Data<br />
Photogrammetric Data<br />
Nearshore Wave Conditions<br />
Design Water and Run-up Levels<br />
Shoreline Recession and Storm Demand Results<br />
Geotechnical Assessment (GHD Geotechnics)<br />
Management Issues<br />
Storm Erosion Hazard and Stability Zones<br />
30 June 2010 Cardno Lawson Treloar Pty Ltd Page xi<br />
H:\Doc\2010\<strong>Report</strong>s.2010\Rep2564v2.Doc
<strong>Wollongong</strong> <strong>City</strong> <strong>Council</strong> Coastal Zone Study<br />
Prepared for <strong>Wollongong</strong> <strong>City</strong> <strong>Council</strong><br />
30 June 2010 Cardno Lawson Treloar Pty Ltd Page xii<br />
H:\Doc\2010\<strong>Report</strong>s.2010\Rep2564v2.Doc
<strong>Wollongong</strong> <strong>City</strong> <strong>Council</strong> Coastal Zone Study<br />
Prepared for <strong>Wollongong</strong> <strong>City</strong> <strong>Council</strong><br />
Glossary and Abbreviations<br />
AHIMS<br />
ARI<br />
BoM<br />
CAMBA<br />
Aboriginal Heritage Information Management System<br />
Average Recurrence Interval; relates to the probability of occurrence of a design<br />
event.<br />
Bureau of Meteorology<br />
China-Australia Migratory Bird Agreement<br />
CL Act <strong>NSW</strong> Crown Lands Act 1989<br />
Coastal<br />
Inundation<br />
Cross-shore<br />
Transport<br />
CSIRO<br />
DCC<br />
DECCW<br />
DEM<br />
DoP<br />
ECL<br />
EEC<br />
ENSO<br />
Flooding of coastal land due to inundation by ocean waters.<br />
Sediment transport occurring normal (or perpendicular) to the beach face.<br />
Commonwealth Scientific and Industrial Research Organisation<br />
Australian Department of Climate Change<br />
<strong>NSW</strong> Department of Environment, Climate Change and Water<br />
Digital Elevation Model<br />
<strong>NSW</strong> Department of Planning<br />
East Coast Low (low pressure system)<br />
Endangered Ecological Community<br />
El Nino Southern Oscillation<br />
EPBC Act Commonwealth Environment Protection and Biodiversity Conservation Act 1999<br />
Erosion<br />
ESD<br />
Short-term erosion, typically associated with a specific storm event. May be<br />
referred to as storm bite. The beach will typically recover after an erosion event.<br />
Ecologically Sustainable Development<br />
FM Act <strong>NSW</strong> Fisheries Management Act 1994<br />
GIS<br />
HAT<br />
H b<br />
H max<br />
H mo<br />
hPa<br />
H s<br />
ICOLLs<br />
IPCC<br />
JAMBA<br />
LALC<br />
LAT<br />
LEP<br />
Geographical Information System<br />
Highest Astronomical Tide<br />
Breaking wave height.<br />
Maximum wave height in a specified time period.<br />
Significant wave height (H s ) based on where is the zeroth moment of the wave<br />
energy spectrum (rather than the time domain H 1/3 parameter).<br />
hecta-Pascal<br />
Significant wave height is the average wave height of the highest third of a set of<br />
waves.<br />
Intermittently Closed and Open Lakes and Lagoons<br />
Intergovernmental Panel on Climate Change<br />
Japan-Australia Migratory Bird Agreement<br />
Local Aboriginal Land <strong>Council</strong><br />
Low Astronomical Tide<br />
Local Environment Plan<br />
LG Act <strong>NSW</strong> Local <strong>Government</strong> Act 1993<br />
30 June 2010 Cardno Lawson Treloar Pty Ltd Page xiii<br />
H:\Doc\2010\<strong>Report</strong>s.2010\Rep2564v2.Doc
<strong>Wollongong</strong> <strong>City</strong> <strong>Council</strong> Coastal Zone Study<br />
Prepared for <strong>Wollongong</strong> <strong>City</strong> <strong>Council</strong><br />
LGA<br />
LiDAR<br />
Longshore<br />
Transport<br />
LPMA<br />
AHD<br />
MHWM<br />
MHWN<br />
MHWS<br />
MLWN<br />
MLWS<br />
MSL<br />
Local <strong>Government</strong> Area<br />
Light Detection and Ranging<br />
The movement of sand along the coastline caused by waves and a wave-caused<br />
current running parallel to the beach.<br />
Land and Property Management Authority<br />
Australian Height Datum; about 0.87m above LAT in the <strong>Wollongong</strong> region.<br />
Mean High Water Mark<br />
Mean High Water Neap<br />
Mean High Water Springs<br />
Mean Low Water Neap<br />
Mean Low Water Springs<br />
Mean Sea Level<br />
NPW Act <strong>NSW</strong> National Parks and Wildlife Act 1974<br />
<strong>NSW</strong><br />
PKPC<br />
SEPP<br />
Shoreline<br />
Recession<br />
SLR<br />
SLSC<br />
New South Wales<br />
Port Kembla Port Corporation<br />
State Environment Planning Policy<br />
The long-term (decadal plus) net landward movement of the shoreline/mean<br />
water line. Occasionally referred to as long-term erosion.<br />
Sea Level Rise<br />
Surf Life Saving Club<br />
Storm surge<br />
Elevation in water levels along the coastline caused by wind set-up and the<br />
inverse barometer effect.<br />
T p<br />
Wave energy spectral peak period; that is, the wave period related to the highest<br />
ordinate in the wave energy spectrum.<br />
Average zero crossing period based on upward zero crossings of the still water<br />
T z<br />
line. An alternative definition is based on the zeroth an second spectral<br />
moments.<br />
TSC Act <strong>NSW</strong> Threatened Species Conservation Act 1995<br />
USACE<br />
VFR<br />
Wave Height<br />
Wave Length<br />
Wave Period<br />
Wave Run-up<br />
Wave Set-up<br />
WRB<br />
WCC<br />
United State Army Corps of Engineers<br />
Visiting Friends and Relatives; i.e. in relation to purpose of visit for tourists.<br />
The height between the top of the crest and the bottom of the trough.<br />
The distance between two wave crests.<br />
The time it takes for two successive wave crests to pass a given point.<br />
The vertical distance between the maximum height that a wave runs up the<br />
beach (or a coastal structure) and the still water level, comprising tide and storm<br />
surge.<br />
Wave set-up in included implicitly in wave run-up calculations.<br />
Wave Rider Buoy<br />
<strong>Wollongong</strong> <strong>City</strong> <strong>Council</strong><br />
30 June 2010 Cardno Lawson Treloar Pty Ltd Page xiv<br />
H:\Doc\2010\<strong>Report</strong>s.2010\Rep2564v2.Doc
<strong>Wollongong</strong> <strong>City</strong> <strong>Council</strong> Coastal Zone Study<br />
Prepared for <strong>Wollongong</strong> <strong>City</strong> <strong>Council</strong><br />
1 Introduction<br />
1.1 Background<br />
Cardno Lawson Treloar has been engaged by <strong>Wollongong</strong> <strong>City</strong> <strong>Council</strong> (WCC) to<br />
undertake a Coastal Zone Study for the <strong>Wollongong</strong> Local <strong>Government</strong> Area (LGA). The<br />
study was conducted between June 2009 and March 2010 and included the following<br />
elements: a series of site inspections of the study area, detailed studies of the coastal and<br />
geotechnical processes in the study area, and targeted stakeholder consultation. This<br />
coastal area includes a large number of individual embayed sandy beaches and cliffs.<br />
1.2 The Study Area<br />
Figure 1.1 shows the study area. The study area includes the coastal zone of the<br />
<strong>Wollongong</strong> LGA, extending from the shores of Lake Illawarra and the Windang Peninsula<br />
in the south, to the Royal National Park in the north. Port Kembla Harbour has been<br />
excluded from the study area as it is managed under a separate legislative and policy<br />
framework.<br />
The study area covers approximately 60km of coastline and includes those portions of the<br />
coastal zone that are under the influence of coastal processes, including the beaches,<br />
dunes, headlands, bluffs, estuaries and nearshore waters. The coastline consists of a<br />
series of embayed sandy beaches with a headland or rock shelf at each end, separated by<br />
sandstone cliffs.<br />
The Illawarra Escarpment runs nearly parallel with the coast for the entire length of the<br />
<strong>Wollongong</strong> LGA and therefore much of the development that has occurred is concentrated<br />
in the coastal strip. The escarpment is generally closer to the coast in the northern part of<br />
the LGA and therefore rocky cliffs tend to predominate in the north. The longer sandy<br />
beaches predominate in the south where the escarpment is further from the coast. There<br />
are a number of coastal creeks within the study area. In the south of the study area is Lake<br />
Illawarra, a large barrier estuary with a trained entrance.<br />
For the purposes of this project, the landward portion of the coastal zone has only been<br />
considered where relevant to the coastal processes being assessed. The study area, as<br />
represented by a nominal 1km boundary around the coastline, is shown in yellow in Figure<br />
1.1. The study beaches have been labelled in Figures 1.2A-C. In some cases, a single<br />
beach compartment will have two names, one for the northern end and one for the<br />
southern end. In other cases, an individual beach is unnamed. For clarification and<br />
consistency, the beach names shown in Figures 1.2A-C have been adopted throughout<br />
this report for beach identification.<br />
A series of inspections of the study area were made on 22 April 2009, 15 June 2009 and 22<br />
January 2010.<br />
1.3 Coastal Management Process<br />
The <strong>NSW</strong> <strong>Government</strong>’s Coastline Management Manual was released in 1990 to provide<br />
local <strong>Government</strong> with guidance for managing risk from coastal hazards and, more<br />
30 June 2010 Cardno Lawson Treloar Pty Ltd Page 1<br />
H:\Doc\2010\<strong>Report</strong>s.2010\Rep2564v2.Doc
<strong>Wollongong</strong> <strong>City</strong> <strong>Council</strong> Coastal Zone Study<br />
Prepared for <strong>Wollongong</strong> <strong>City</strong> <strong>Council</strong><br />
generally, how to undertake coastal management in an integrated fashion in order to<br />
provide for consideration of social, economic and environmental factors. The Manual<br />
identifies a stepwise process that <strong>Council</strong>s should follow in order to develop a Coastal Zone<br />
Management Plan.<br />
The Manual is currently being revised by the <strong>NSW</strong> Department of Environment, Climate<br />
Change and Water (DECCW) and the sequence of steps <strong>Council</strong>s are directed to follow are<br />
also being updated accordingly. The <strong>NSW</strong> coastal management process now consists of<br />
eleven steps as follow:<br />
1. Establish a Coastal Zone Management Committee;<br />
2. Identify issues, set goals and review existing data;<br />
3. Undertake a Coastal Zone Study, which is a targeted investigation of specific<br />
aspects of the coastal zone;<br />
4. Conduct a Coastal Zone Management Study to develop management objectives<br />
and consider all feasible management options while addressing the social,<br />
economic, aesthetic, recreational and ecological issues associated with land uses of<br />
the area;<br />
5. Prepare a Draft Coastal Zone Management Plan consisting of the best possible<br />
combination of options to achieve the Plan objectives;<br />
6. Review the Draft Coastal Zone Management Plan through public exhibition and<br />
consultation, including the preparation of a strategy to implement the Plan;<br />
7. <strong>Council</strong> adoption of the Coastal Zone Management Plan;<br />
8. Submit Plan to Minister for Climate Change and the Environment for approval in<br />
accordance with Part 4A of the Coastal Protection Act 1979;<br />
9. Gazettal by <strong>Council</strong> of the approved Coastal Zone Management Plan;<br />
10. Implement the approved Coastal Zone Management Plan; and<br />
11. Review the Coastal Zone Management Plan.<br />
<strong>Council</strong> has already established a Coasts and Estuaries Management Committee (Stage<br />
1). This study seeks to address Stages 2 and 3 of the Coastal Management Process, as<br />
highlighted in bold italics above.<br />
WCC has previously progressed through the coastal zone management process outlined in<br />
the original Coastline Management Manual (<strong>NSW</strong> <strong>Government</strong>, 1990) for a number of<br />
locations within the <strong>Wollongong</strong> LGA. However, a number of policies and guidelines on<br />
coastal management in <strong>NSW</strong> have recently been released, dealing in particular with how<br />
the potential impacts of climate change should be incorporated into coastal hazard<br />
investigations and also how coastal planning should be undertaken (refer to Section 2.2).<br />
At the same time, the <strong>NSW</strong> Department of Planning (DoP) is implementing planning reform<br />
in <strong>NSW</strong>, which requires all local <strong>Government</strong>s to prepare a new standard instrument Local<br />
Environment Plan (LEP).<br />
For these reasons <strong>Council</strong> has resolved to undertake to prepare a Coastal Zone<br />
Management Study for the entire LGA to assist in developing a strategic policy framework<br />
for coordinated, integrated and ecologically sustainable management of the coast into the<br />
future.<br />
30 June 2010 Cardno Lawson Treloar Pty Ltd Page 2<br />
H:\Doc\2010\<strong>Report</strong>s.2010\Rep2564v2.Doc
<strong>Wollongong</strong> <strong>City</strong> <strong>Council</strong> Coastal Zone Study<br />
Prepared for <strong>Wollongong</strong> <strong>City</strong> <strong>Council</strong><br />
1.4 Objectives<br />
<strong>Council</strong>’s objective for the study is to undertake an assessment of the coastal zone of the<br />
<strong>Wollongong</strong> LGA. The study covers such aspects as:<br />
• Past and present human activity in the coastal zone,<br />
• Important physical, ecological, cultural and economic features of the coastal zone,<br />
• The condition of those key features of the coastal zone,<br />
• The potential risks associated with climate change, and<br />
• The risk to coastal users and development from coastal hazards.<br />
The key objective of the study is to characterise the hazards affecting the <strong>Wollongong</strong><br />
coastline in order to delineate the extent of land and real property that could be affected by<br />
coastal hazards for a range of planning horizons. The projected effects of climate change<br />
are to form part of the coastal hazard assessment, including the potential effects of sea<br />
level rise and changes in storm patterns.<br />
1.5 Document Structure<br />
This document has been structured as follows:<br />
• Section 2 provides a brief overview of the key relevant legislation and policy on the<br />
assessment of coastal hazards;<br />
• An overview of coastal processes and hazards is provided in Section 3;<br />
• Details of the study methodology, data inputs and model systems used, are<br />
provided in Section 4;<br />
• The coastal processes and hazards investigations are detailed in Section 5;<br />
• Details of the geotechnical investigations on slope stability are provided in Section<br />
6;<br />
• Section 7 deals with those other aspects of the study area, including:<br />
− Coastal ecology (Section 7.3 and 7.4),<br />
− Land use and land tenure (Section 7.5),<br />
− Human usage of the coastal zone (Section 7.6),<br />
− The economic value of the coastal zone (Section 7.7); and<br />
− Management Issues (Section 7.8).<br />
• Section 8 provides a risk assessment of the <strong>Wollongong</strong> coastline based on the<br />
calculated coastal hazard extents; and<br />
• Concluding remarks and recommendations are provided in Section 10.<br />
Qualifications relevant to the study are listed in Section 9.<br />
30 June 2010 Cardno Lawson Treloar Pty Ltd Page 3<br />
H:\Doc\2010\<strong>Report</strong>s.2010\Rep2564v2.Doc
<strong>Wollongong</strong> <strong>City</strong> <strong>Council</strong> Coastal Zone Study<br />
Prepared for <strong>Wollongong</strong> <strong>City</strong> <strong>Council</strong><br />
2 Relevant Legislation and Policy<br />
This section of the report provides a brief overview of the legislation, policies and guidelines<br />
that are relevant to the determination of coastal hazards and coastal management more<br />
generally.<br />
A more comprehensive overview of the larger range of policy and planning instruments<br />
should be provided in the Coastal Management Study (the next stage of the Coastal<br />
Management Process).<br />
2.1 Legislation<br />
<strong>NSW</strong> Coastal Protection Act 1979<br />
The <strong>NSW</strong> Coastal Protection Act 1979 is the key piece of legislation relating to the coastal<br />
zone and its management.<br />
The Coastal Protection Act 1979 contains provisions relating to the use and occupation of<br />
the coastal zone, the carrying out of certain coastal protection works, the preparation of a<br />
coastal zone management plans and other ancillary matters relating to the coastal zone.<br />
The objectives of the Act are to provide for the protection of the coastal environment of the<br />
State for the benefit of both present and future generations and, in particular:<br />
• To protect, enhance, maintain and restore the environment of the coastal region, its<br />
associated ecosystems, ecological processes and biological diversity, and its water<br />
quality, and<br />
• To encourage, promote and secure the orderly and balanced utilisation and<br />
conservation of the coastal region and its natural and man-made resources, having<br />
regard to the principles of ecologically sustainable development (ESD), and<br />
• To recognise and foster the significant social and economic benefits to the State<br />
that results from a sustainable coastal environment, including:<br />
− Benefits to the environment, and<br />
− Benefits to urban communities, fisheries, industry and recreation, and<br />
− Benefits to culture and heritage, and<br />
− Benefits to Aboriginal people in relation to their spiritual, social, customary<br />
and economic use of land and water, and<br />
• To promote public pedestrian access to the coastal region and recognise the<br />
public’s right to access, and<br />
• To provide for the acquisition of land in the coastal region to promote the protection,<br />
enhancement, maintenance and restoration of the environment of the coastal<br />
region, and<br />
• To recognise the role of the community, as a partner with government, in resolving<br />
issues relating to protection of the coastal environment, and<br />
• To ensure co-ordination of the policies and activities of the <strong>Government</strong> and public<br />
authorities relating to the coastal region and to facilitate the proper integration of<br />
their management activities.<br />
Part 4A of the Act refers to the preparation of coastal zone management plans by local<br />
<strong>Council</strong>s. A Coastal Zone Management Plan must be prepared in accordance with the<br />
30 June 2010 Cardno Lawson Treloar Pty Ltd Page 4<br />
H:\Doc\2010\<strong>Report</strong>s.2010\Rep2564v2.Doc
<strong>Wollongong</strong> <strong>City</strong> <strong>Council</strong> Coastal Zone Study<br />
Prepared for <strong>Wollongong</strong> <strong>City</strong> <strong>Council</strong><br />
Coastline Management Manual (<strong>NSW</strong> <strong>Government</strong>, 1990) or other guidelines provided by<br />
DECCW.<br />
2.2 Policies and Guidelines<br />
Coastal Policy 1997<br />
The <strong>NSW</strong> Coastal Policy 1997 was developed in recognition of the intense pressure placed<br />
on the resources of the coastal zone. It provides the overarching framework for the<br />
management of the <strong>NSW</strong> coastal zone. Emphasis is placed on the value of integrated<br />
management in resolving the competing environmental, economic and social demands for<br />
finite coastal resources. This is articulated in a series of eight key goals.<br />
Two key elements of the Policy are the continuing commitment to the preparation and<br />
implementation of Coastal Zone Management Plans and the principles of ESD. The<br />
undertaking of this study and the subsequent steps in the Coastal Management Process<br />
(as listed in Section 1.3) form an integral part of the fulfilment of this Policy.<br />
Coastline Hazard Policy 1988<br />
The <strong>NSW</strong> Coastline Hazard Policy 1988 was developed with the primary objective of<br />
reducing the impact of coastline hazards on individual owners and occupiers of coastal<br />
lands and to reduce private and public losses resulting from such hazards.<br />
SEPP 71 – Coastal Protection<br />
State Environment Planning Policy (SEPP) 71 Coastal Protection seeks to ensure that<br />
development within the coastal zone is appropriate, suitably located and consistent with the<br />
principles of ESD. It applies to sensitive coastal locations, including:<br />
• Lands within 100m of the mean high water mark (MHWM) of the sea, a bay or an<br />
estuary;<br />
• Coastal lakes, Ramsar wetlands and World Heritage areas;<br />
• Marine parks and aquatic reserves;<br />
• Land reserved under the National Parks and Wildlife Act 1977;<br />
• Land within 100m of any of the above;<br />
• SEPP 14 Coastal Wetlands;<br />
• Residential land within 100m of SEPP 26 Littoral Rainforest.<br />
In essence, SEPP71 provides an assessment framework for development in the coastal<br />
zone and provides legal force to some elements of the Coastal Policy 1997.<br />
<strong>NSW</strong> Sea Level Rise Policy Statement<br />
DECCW recently released a Sea Level Rise Policy Statement (DECCW, 2009a), outlining<br />
their objectives and commitments to communities affected by sea level rise. The Policy<br />
Statement includes sea level rise planning benchmarks of 0.4m by 2050 and 0.9m by 2100.<br />
These values were established through careful consideration of available sea level rise<br />
projections and takes into account the uncertainty associated with these projections.<br />
Details regarding the derivation of these values are provided in DECCW (2009b).<br />
30 June 2010 Cardno Lawson Treloar Pty Ltd Page 5<br />
H:\Doc\2010\<strong>Report</strong>s.2010\Rep2564v2.Doc
<strong>Wollongong</strong> <strong>City</strong> <strong>Council</strong> Coastal Zone Study<br />
Prepared for <strong>Wollongong</strong> <strong>City</strong> <strong>Council</strong><br />
Draft Coastal Risk Management Guide<br />
DECCW has also prepared a Draft Coastal Risk Management Guide (2009c) that provides<br />
details on how the sea level rise planning benchmarks should be incorporated into coastal<br />
risk assessments. It describes how hazard extents should be calculated for a series of<br />
defined planning periods (being 50 and 100 years in this case).<br />
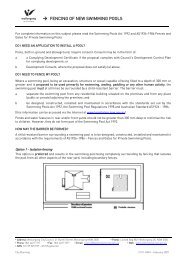
The immediate hazard lines represent the estimated landward extent of beach erosion from<br />
a design storm event, on top of which there may be a zone of reduced foundation capacity.<br />
An additional hazard line should be calculated landward of the immediate hazard line to<br />
represent the beach recession expected to occur for the 50 years and 100 years planning<br />
horizons with and without sea level rise. This has been illustrated in Plate 2.1.<br />
Plate 2.1: Coastal Hazard Planning Area Definition (after: DECCW, 2009c)<br />
The guide also includes advice on design still water levels and estimation of recession<br />
rates for unconsolidated (sandy) shorelines.<br />
Draft <strong>NSW</strong> Coastal Planning Guideline<br />
The Draft <strong>NSW</strong> Coastal Planning Guideline: Adapting to Sea Level Rise was released by<br />
the Department of Planning in October 2009 (DoP, 2009). It provides guidance to local<br />
government on how sea level rise and its associated impacts (on both flooding and coastal<br />
processes) should be incorporated into planning and development assessment processes<br />
in <strong>NSW</strong>.<br />
The outcome of this Coastal Zone Study will be the derivation of coastal hazard and sea<br />
level rise planning areas (as indicated in Plate 2.1) for the <strong>Wollongong</strong> LGA to be used by<br />
<strong>Council</strong> for strategic planning and development assessment purposes.<br />
30 June 2010 Cardno Lawson Treloar Pty Ltd Page 6<br />
H:\Doc\2010\<strong>Report</strong>s.2010\Rep2564v2.Doc
<strong>Wollongong</strong> <strong>City</strong> <strong>Council</strong> Coastal Zone Study<br />
Prepared for <strong>Wollongong</strong> <strong>City</strong> <strong>Council</strong><br />
3 Coastal Processes and Hazards<br />
The purpose of this section is to describe the physical coastal processes and hazards that<br />
affect the coastal region of the <strong>Wollongong</strong> LGA. The key processes include:<br />
• Wave Processes;<br />
• Water Levels;<br />
• Coastal Inundation;<br />
• Tsunami;<br />
• Sediment Transport and Storm Erosion; and<br />
• Climate Change.<br />
3.1 Wave Processes<br />
Waves that propagate to the <strong>Wollongong</strong> coastline may have energy in two distinct<br />
frequency bands. These are principally related to the generation and propagation of ocean<br />
swell and local sea (wind/waves). Large waves generated by a storm are generally<br />
categorised as local sea waves because wind energy is still in the process of being<br />
transferred to the ocean to form the waves. However, for the purposes of this study, no<br />
distinction was made between sea and swell waves.<br />
Waves are irregular in height and period and so it is necessary to describe wave conditions<br />
using a range of statistical parameters. In this study the following have been used:<br />
• H mo significant wave height (H s ) based on where is the zeroth moment of the<br />
wave energy spectrum (rather than the time domain H 1/3 parameter);<br />
• H max maximum wave height in a specified time period;<br />
• T p wave energy spectral peak period, that is, the wave period related to the<br />
highest ordinate in the wave energy spectrum; and<br />
• T z average zero crossing period based on upward zero crossings of the still<br />
water line. An alternative definition is based on the zeroth and second<br />
spectral moments.<br />
Wave heights defined by zero upcrossings of the still water line fulfil the Rayleigh<br />
Distribution in deep water and thereby provide a basis for estimating other wave height<br />
parameters from H s . In shallow water, i.e. within the nearshore areas, significant wave<br />
height defined from the wave spectrum, H mo , is normally larger (typically 5% to 8%) than<br />
H 1/3 defined from a time series analysis.<br />
Directional Spreading<br />
Waves also have a dominant direction of wave propagation and directional spread about<br />
that direction that can be defined by a Gaussian or generalised cosine (cos n ) distribution<br />
(amongst others), and a wave grouping tendency. Directional spread is reduced by<br />
refraction as waves propagate into the shallow, nearshore regions and the wave crests<br />
become more parallel with each other and the seabed contours. Although neither of these<br />
characteristics is addressed explicitly in this study, directional spreading was included in<br />
the numerical wave modelling work undertaken to describe the design wave climate along<br />
the <strong>Wollongong</strong> coastline. Directional spreading causes the sea surface to have a more<br />
short-crested wave structure in deep water.<br />
30 June 2010 Cardno Lawson Treloar Pty Ltd Page 7<br />
H:\Doc\2010\<strong>Report</strong>s.2010\Rep2564v2.Doc
<strong>Wollongong</strong> <strong>City</strong> <strong>Council</strong> Coastal Zone Study<br />
Prepared for <strong>Wollongong</strong> <strong>City</strong> <strong>Council</strong><br />
Nearshore Processes<br />
Waves propagating into shallow water may undergo changes caused by refraction,<br />
shoaling, bed friction, wave breaking and, to some extent, diffraction.<br />
Wave refraction is caused by differential wave propagation speeds. That part of a<br />
shoreward propagating wave which is in the more shallow water has a lower speed than<br />
those parts in deeper water. When waves approach a coastline obliquely, these<br />
differences cause the wave fronts to turn and become more coast parallel. Associated with<br />
this directional change there are changes in wave heights. On irregular seabeds, wave<br />
refraction becomes a very complex process.<br />
Waves propagating shoreward develop reduced speeds in shallow water. In order to<br />
maintain constancy of wave energy flux (ignoring energy dissipation processes) their<br />
heights must increase. This phenomenon is termed shoaling and leads to a significant<br />
increase in wave height near the shoreline.<br />
A turbulent boundary layer forms at the seabed with associated wave energy losses that<br />
are manifested as a continual reduction in wave height in the direction of wave propagation<br />
- leaving aside further wind input, refraction, shoaling and wave breaking. The rate of<br />
energy dissipation increases with greater wave height.<br />
Wave breaking occurs in shallow water when the wave crest speed becomes greater than<br />
the wave phase speed. For irregular waves this breaking occurs in different depths so that<br />
there is a breaker zone rather than a breaker line. Seabed slope, wave period and water<br />
depth are important parameters affecting the wave breaking phenomenon. As a<br />
consequence of this energy dissipation, wave set-up (a rise in still water level caused by<br />
wave breaking), develops shoreward from the breaker zone in order to maintain<br />
conservation of momentum flux. This rise in water level increases non-linearly in the<br />
shoreward direction and allows larger waves to propagate shoreward before breaking.<br />
Field measurements have shown that the slope of the water surface is normally concave<br />
upward. Wave set-up at the shoreline can be in the order of 15% of the equivalent deepwater<br />
significant wave height. Lower set-up occurs in estuarine entrances, but the<br />
momentum flux remains the same. Wave set-up is smaller where waves approach a beach<br />
obliquely, but then a longshore current can be developed. Wave grouping and the<br />
consequent surf beats also cause fluctuations in the still water level.<br />
Wave diffraction will not be particularly important for this study, other than where waves<br />
propagate around headland features. It was included in the SWAN wave propagation<br />
model applied to this study.<br />
Wave Spectrum<br />
In a random wave field each wave may be considered to have a period different from its<br />
predecessors and successors, and the distribution of wave energy is often described by a<br />
wave energy spectrum. In fact, the whole wave train structure changes continuously and<br />
individual waves appear and disappear until quite shallow water is reached and dispersive<br />
processes are reduced. In developed sea states, that is swell, the Bretschneider modified<br />
Pierson-Moskowitz spectral form has generally been found to provide a realistic wave<br />
energy description. For developing sea states the JO<strong>NSW</strong>AP spectral form (Hasselmann<br />
30 June 2010 Cardno Lawson Treloar Pty Ltd Page 8<br />
H:\Doc\2010\<strong>Report</strong>s.2010\Rep2564v2.Doc
<strong>Wollongong</strong> <strong>City</strong> <strong>Council</strong> Coastal Zone Study<br />
Prepared for <strong>Wollongong</strong> <strong>City</strong> <strong>Council</strong><br />
et. al., 1973), which is generally more ‘peaky’, has been found to provide a better spectral<br />
description and was applied in this study.<br />
Maximum Wave Height<br />
For structural design in the marine environment it may be necessary to define the H max<br />
parameter related to storms having average recurrence intervals (ARI) of R years.<br />
However, the expected H max , relative to H s in statistically stationary wave conditions,<br />
increases as storm/sea state duration increases. Based on the Rayleigh Distribution the<br />
usual relationship is defined by Equation 1.<br />
Equation 1: Maximum Wave Height Relationship<br />
H max = H s ( 0 .5 l nNz )<br />
Where<br />
Nz is the number of waves occurring during the time period being<br />
considered, where individual waves are defined by Tz .<br />
ln is the natural logarithm<br />
This relationship has been found to overestimate H max by about 10% in severe ocean<br />
storms. In shallow water the relationship is not fulfilled. In very shallow water, H max is<br />
replaced by the breaking wave height, H b . That is, in shallow water, wave height becomes<br />
limited by the depth of water. The breaking wave height can be ‘estimated’ using the<br />
breaking criteria defined by Equation 2.<br />
Equation 2: Breaking Wave Criteria<br />
H b /d b = 0.85<br />
Where<br />
d b is the breaking wave depth<br />
Hydrodynamic Effects<br />
Waves propagating through an area affected by a current field are caused to turn in the<br />
direction of the current. The extent of this directional change depends on wave celerity (the<br />
wave propagation speed), current speed and relative directions. Wave height is also<br />
changed. Opposing currents cause wave lengths to shorten and wave heights to increase<br />
and may lead to wave breaking. When the current speed is greater than one quarter of the<br />
phase speed, the waves are blocked. Conversely, a following current reduces wave<br />
heights and extends wave lengths.<br />
3.1.1 Wave Climate in the Illawarra Region<br />
The offshore wave climate in the Illawarra region is dominated by south to south-east swell<br />
conditions. Mean offshore wave conditions are typically a wave height (H s ) of<br />
approximately 1.5m and wave period (mean, T z ) of 6 seconds (refer to Section 4.2.5).<br />
During summer, the occurrence of easterly and east-north-easterly wave conditions is<br />
much higher than in other seasons. During winter, southerly and south-easterly wave<br />
conditions prevail.<br />
The south-east to south sector is the dominant direction for the largest storm waves. Two<br />
general types of weather systems produce the most frequent and largest storm waves<br />
along the mid-<strong>NSW</strong> coastline. Intense low pressure systems located in the southern<br />
30 June 2010 Cardno Lawson Treloar Pty Ltd Page 9<br />
H:\Doc\2010\<strong>Report</strong>s.2010\Rep2564v2.Doc
<strong>Wollongong</strong> <strong>City</strong> <strong>Council</strong> Coastal Zone Study<br />
Prepared for <strong>Wollongong</strong> <strong>City</strong> <strong>Council</strong><br />
Tasman Sea that generally form from systems which have moved north from the Southern<br />
Ocean are the most common coastal storm system. These systems occur relatively<br />
frequently with at least several strong events occurring every year on average, and due to<br />
the southerly location of the storm centre, generate onshore propagating waves from the<br />
south-east to south sector at the study site. As these waves propagate across the<br />
continental shelf into the nearshore region, the process of refraction reduces the wave<br />
energy (height) that reaches the shoreline.<br />
A second weather system is referred to as an East Coast Low (ECL) storm. These<br />
complex weather systems often originate from a tropical low pressure region and generally<br />
move southwards down the <strong>NSW</strong> coast, but have been known to move in a northerly<br />
direction. These systems can be particularly damaging to the mid-<strong>NSW</strong> coast because<br />
they can form relatively close to the coastline and often generate powerful offshore waves<br />
from the east to south-east sector. As a result, these waves experience less refraction<br />
compared to more southerly weather systems and larger waves can propagate to the<br />
shoreline. They also generate a range of offshore wave directions as they move along the<br />
coastline. ECL events can also generate a storm surge, which can further increase the<br />
impact of the storm on shoreline areas. It has been observed that ECL can occur<br />
frequently when conditions are favourable; that is, they tend to be episodic. This was<br />
observed in 1974 when two ECL storms damaged the mid-<strong>NSW</strong> coast a few weeks apart.<br />
More recently, the June 2007 period featured several intense ECL events, including the<br />
storm which caused extensive damage in the Newcastle region.<br />
Large offshore waves from the north-east to east sector occur very occasionally on the<br />
southern central <strong>NSW</strong> coast. These waves often have long periods (T p = 12 to 16s) and<br />
are normally generated from distant tropical cyclones. These events affect the <strong>NSW</strong><br />
coastline only a few times each decade.<br />
3.2 Water Levels<br />
Water level variations along the <strong>Wollongong</strong> coastline result from one or more of the<br />
following natural causes:<br />
• Eustatic and tectonic changes;<br />
• Tides;<br />
• Wind set-up and the inverse barometer effect;<br />
• Wave set-up;<br />
• Wave run-up;<br />
• Fresh water flow;<br />
• Climate change; and<br />
• Global variations in meteorological conditions.<br />
Eustatic and Tectonic Changes<br />
Eustatic sea level changes are long term world-wide changes in sea level relative to the<br />
land mass and are generally caused by isothermic expansion and melting of polar ice caps.<br />
No rapid changes are believed to be occurring at present, although predictions of future<br />
climate change indicate a potential for such an outcome to occur. Climate change is further<br />
addressed in Section 3.7. Nevertheless, a minimum sea level rise of 1mm per annum is<br />
now generally accepted. Tectonic changes are caused by movement of the Earth’s crust;<br />
30 June 2010 Cardno Lawson Treloar Pty Ltd Page 10<br />
H:\Doc\2010\<strong>Report</strong>s.2010\Rep2564v2.Doc
<strong>Wollongong</strong> <strong>City</strong> <strong>Council</strong> Coastal Zone Study<br />
Prepared for <strong>Wollongong</strong> <strong>City</strong> <strong>Council</strong><br />
they may be vertical and/or horizontal and affect relative sea level changes, that is, relative<br />
to land.<br />
Tides<br />
Tides are caused by the relative motions of the Earth, Moon and Sun and their gravitational<br />
attractions. While the vertical tidal fluctuations are generated as a result of these forces,<br />
the distribution of land masses, bathymetric variation and the Coriolis force (the deflection<br />
of currents due to the rotation of the earth) determine the local tidal characteristics. The<br />
local tides for the <strong>Wollongong</strong> coastline are summarised in Section 3.2.1.<br />
Wind Set-up and the Inverse Barometer Effect<br />
Wind set-up and the inverse barometer effect are caused by regional meteorological<br />
conditions. When the wind blows over an open body of water, drag forces develop<br />
between the air and the water surface. These drag forces are proportional to the square of<br />
the wind speed. The result is that a wind drift current is generated. This current may<br />
transport water towards the coast, against which the water piles up causing wind set-up.<br />
Wind set-up is inversely proportional to depth.<br />
In addition, the drop in atmospheric pressure, which accompanies severe meteorological<br />
events, causes water to flow from high pressure areas on the periphery of the<br />
meteorological formation to the low pressure area. This is called the ‘inverse barometer<br />
effect’ and results in water level increases up to 1cm for each hecta-Pascal (hPa) drop in<br />
central pressure below the average sea level atmospheric pressure in the area for the<br />
particular time of year, typically about 1,010 hPa. The actual increase depends on the<br />
speed of the meteorological system and 1cm is only achieved if it is moving slowly. The<br />
phenomenon causes daily variations from predicted tide levels up to 0.05m. The combined<br />
result of wind set-up and the inverse barometer effect is called storm surge.<br />
Wave Run-up<br />
Wave run-up is the vertical distance between the maximum height that a wave runs up the<br />
beach or a coastal structure and the still water level, comprising tide and storm surge.<br />
Wave set-up, as discussed in Section 3.1, is included implicitly in wave run-up<br />
calculations. Additionally, run-up level varies with surf-beat, which arises from the variation<br />
in mean water level as a result wave grouping effects.<br />
Global Changes in Meteorological Conditions<br />
Global meteorological and oceanographic changes, such as the El Nino Southern<br />
Oscillation (ENSO) phenomenon in the eastern Southern Pacific Ocean and continental<br />
shelf waves, cause medium term (inter-annual) variations in mean sea level. ENSO<br />
conditions may persist for a year or more. The causes are not properly understood, but<br />
analyses of long term data from Australian tide gauges indicate that annual mean sea level<br />
may vary up to 0.1m from the long term trend, whilst mean sea level may vary by more<br />
than 0.2m over the time scale of weeks as a result of coastal trapped wave activity (a<br />
continental shelf process), for example.<br />
30 June 2010 Cardno Lawson Treloar Pty Ltd Page 11<br />
H:\Doc\2010\<strong>Report</strong>s.2010\Rep2564v2.Doc
<strong>Wollongong</strong> <strong>City</strong> <strong>Council</strong> Coastal Zone Study<br />
Prepared for <strong>Wollongong</strong> <strong>City</strong> <strong>Council</strong><br />
3.2.1 Water Levels in the Illawarra Region<br />
Water levels in the Illawarra region are dominated by semi-diurnal astronomical tides with a<br />
spring tidal range up to approximately 1.8m. Table 3.1 presents the tidal planes for Port<br />
Kembla (within the Study Area). Australian Height Datum (AHD) is approximately 0.87m<br />
above Lowest Astronomical Tide (LAT) at Port Kembla.<br />
Table 3.1: Tidal Planes for Port Kembla (after National Tide Tables, 2010)<br />
Water Level<br />
Tidal Plane<br />
m LAT<br />
m AHD<br />
Highest Astronomical Tide (HAT) 2.00 1.13<br />
Mean High Water Springs (MHWS) 1.50 0.63<br />
Mean High Water Neaps (MHWN) 1.30 0.43<br />
Mean Sea Level (MSL) 0.90 0.03<br />
Mean Low Water Neaps (MLWN) 0.60 -0.27<br />
Mean Low Water Springs (MLWS) 0.30 -0.57<br />
Lowest Astronomical Tide (LAT) 0.00 -0.87<br />
In addition to the astronomical tides, water levels are also influenced by daily, seasonal and<br />
inter-annual oceanographic processes. As discussed above, these processes can cause<br />
variations to the predicted tide (astronomical) of up to +/- 0.2m.<br />
The mid-coast regions of the <strong>NSW</strong> coastline are subject to storm surge during intense<br />
storm systems, as discussed with reference to ECLs in Section 3.1.1. These storms can<br />
form from strong frontal systems passing through the southern Tasman Sea or from<br />
remnant tropical weather systems. The most intense ECL in the last 50 years for the midcoast<br />
region of <strong>NSW</strong> was the May 1974 event. This intense storm produced a storm surge<br />
in the order of 0.5m along the mid-<strong>NSW</strong> coast caused by wind setup and inverse barometer<br />
effects.<br />
3.3 Coastal Inundation<br />
Coastal inundation is the flooding of coastal lands by ocean waters. The types of low lying<br />
coastal areas that are subject to coastal inundation include wetlands, the fringing areas of<br />
coastal lagoons and rivers, and the areas behind beach and dune systems (<strong>NSW</strong><br />
<strong>Government</strong>, 1990). Inundation of these areas can be caused by the large waves and<br />
elevated water levels associated with severe storm events. Severe coastal inundation<br />
occurs infrequently and over a very short period of time (usually several hours) (<strong>NSW</strong><br />
<strong>Government</strong>, 1990). However, it can cause a significant amount of damage to public and<br />
private property, including clean-up costs. Wave set-up caused by wave breaking has a<br />
significant impact on water levels (and therefore coastal inundation) along the <strong>Wollongong</strong><br />
coastline.<br />
Coastal inundation occurs due to the combination of elevated water levels (storm surge)<br />
and wave action. Wave processes can cause inundation through two related mechanisms:<br />
• Wave set-up; and<br />
• Wave run-up and overtopping.<br />
Wave run-up and wave set-up are normally not included in the same design specification.<br />
That is, both processes can be estimated relative to the still water level and the inundation<br />
30 June 2010 Cardno Lawson Treloar Pty Ltd Page 12<br />
H:\Doc\2010\<strong>Report</strong>s.2010\Rep2564v2.Doc
<strong>Wollongong</strong> <strong>City</strong> <strong>Council</strong> Coastal Zone Study<br />
Prepared for <strong>Wollongong</strong> <strong>City</strong> <strong>Council</strong><br />
level is determined from either the run-up level (which implicitly includes wave set-up) or<br />
wave set-up height combined with storm tide (astronomical tide plus storm surge);<br />
depending upon the design/shoreline circumstances. Note, however, that high water levels<br />
can also occur at times when there is no local storm (e.g. during a King tide or passing<br />
coastal trapped wave).<br />
Coastal inundation along the study area is typically a combination of the storm tide and<br />
wave set-up or run-up (whichever is the greater – normally run-up) at the shoreline of<br />
interest.<br />
3.4 Tsunami<br />
Tsunamis are caused by sudden crustal movements of the Earth’s crust and are<br />
commonly, but incorrectly, called ‘tidal waves’. They are infrequent and unlikely to occur<br />
during a storm. They are known to occur on the eastern coast of Australia, but their<br />
impacts in terms of loss of life and damage to property has not been significant. Their<br />
incidence and effects are being investigated by the <strong>NSW</strong> <strong>Government</strong> and are not a focus<br />
of this study.<br />
3.5 Sediment Transport, Storm Erosion and Recession<br />
Sand is moved by waterborne sediment transport, which occurs due to the action of waves<br />
and currents. Sediment is transported onshore, offshore and alongshore, causing the<br />
beach to undergo a series of erosion and accretion cycles covering periods of time ranging<br />
from weeks to decades (<strong>NSW</strong> <strong>Government</strong>, 1990). This process has implications for the<br />
management of coastal areas. Structures may be put at risk by erosion and while accretion<br />
may be beneficial, it can also have negative impacts, such as blocking of storm-water<br />
outlets.<br />
The nearshore and shoreline regions of the <strong>Wollongong</strong> coastal zone are formed from<br />
marine sands and rocky headlands.<br />
Sediment transport is caused by the water particle motions of waves and currents that lead<br />
to a shear stress on the seabed sediment particles. In some parts of the study area, such<br />
as estuarine entrances, waves and currents cause combined shear stresses. Generally,<br />
sediment motion commences when the seabed shear stress exceeds a threshold value,<br />
which depends on particle size and density. Sediment may be transported as bed load or<br />
suspended load. Bed load transport is effected as a series of saltations or hops.<br />
Suspended sediment transport occurs when the turbulent mixing of the flow counteracts the<br />
fall velocity of the finer sediment particles that disperse upward from the seabed.<br />
At shoreline locations, sediment transport may be alongshore and/or onshore/offshore.<br />
Longshore transport refers to the movement of sand along the coastline caused by a<br />
current parallel to the beach. These currents are generally caused by waves breaking at<br />
some angle to the beach alignment, thereby generating a current acting parallel to the<br />
shoreline. Cross-shore sediment transport refers to transport normal to the beach face.<br />
During storm conditions cross-shore transport generally removes sand from the upper<br />
beach profile and deposits this material in deeper water further offshore. During more<br />
moderate wave conditions, swell waves can promote the transport of sand from deeper<br />
water onto the beach face to re-build the beach following storm erosion. This process is<br />
30 June 2010 Cardno Lawson Treloar Pty Ltd Page 13<br />
H:\Doc\2010\<strong>Report</strong>s.2010\Rep2564v2.Doc
<strong>Wollongong</strong> <strong>City</strong> <strong>Council</strong> Coastal Zone Study<br />
Prepared for <strong>Wollongong</strong> <strong>City</strong> <strong>Council</strong><br />
much slower than the storm erosion phase and would typically occur over a period of<br />
months.<br />
The large waves, elevated water levels and strong wind conditions, generated by a storm<br />
can cause severe erosion of sandy beaches. Storm wave attack, coupled with rip<br />
formations, can move large amounts of sand offshore (up to 250m 3 /m run of beach) (<strong>NSW</strong><br />
<strong>Government</strong>, 1990). This is also a natural beach protection process because it causes<br />
smaller breaking waves at the shoreline. Storm waves undercut the beach berm and<br />
frontal dune to form an erosion escarpment. The erosion and offshore transport of sand<br />
during a storm event is a natural process and the eroded sand is generally returned to the<br />
shore during calmer periods of swell waves, as described above (<strong>NSW</strong> <strong>Government</strong>, 1990).<br />
However, where buildings and facilities are located within the ‘active’ beach zone or area<br />
subject to erosion, there is a danger they will be undermined and may collapse.<br />
A number of lagoon entrances occur along the study area shorelines. When rainfall events<br />
occur, stormwater runoff flows into the lagoons raising water levels. If the water levels rise<br />
high enough relative to the berm height, the water will overtop the berm and initiate a<br />
process of entrance scouring that continues until the entrance is fully open. During this<br />
process of gradual scouring out of the entrance, significant volumes of water will flow out of<br />
the lagoon resulting in an erosion hazard to the shoreline in the vicinity of the entrance.<br />
This entrance breakout process typically occurs over a period of hours. Re-building of the<br />
berm occurs as a result of long-shore and cross-shore transport. However, the berm will<br />
only continue to re-build as long as there are no catchment flood events occur to drive up<br />
water levels and break open the entrance. Therefore, the entrance condition reflects a<br />
balance between these two forces: catchment inflows and coastal processes.<br />
The frequency with which the entrance breaks out is therefore determined by rainfall<br />
patterns in the catchment and the volume or capacity of the estuary. Specific assessment<br />
of this catchment driven process do not form part of these investigations but rather are<br />
being addressed within local catchment flood studies. The influence of this process on the<br />
definition of coastal hazards as addressed in this report is small, however, is considered<br />
where appropriate.<br />
Several storm-water drain outlets are located along the beaches of the study area. It is<br />
understood that no <strong>Council</strong> policy exists regarding the management of sand surrounding<br />
the outlets. Following rainfall events each of the drains would cause some scouring of the<br />
surrounding beach, as was observed during the site visits. However, based on inspections<br />
of the beach areas, the impact of these drains on the morphology of the whole beach is<br />
expected to be localised near each individual outlet and as such does not influence the<br />
definition of erosion hazards.<br />
Potential future sea level rise, described in Section 3.7.1, could also affect the morphology<br />
of the beach compartments.<br />
3.6 Sand Drift<br />
Sand drift describes the movement of sediment by aeolian processes and can cause<br />
significant hazard within the coastal zone. Resulting hazards may include the abrasion of<br />
motor vehicles, buildings, vegetation and park and garden fittings; the burial of roadways,<br />
rail lines, agricultural land and coastal ecosystems; the blockage of street gutters and<br />
30 June 2010 Cardno Lawson Treloar Pty Ltd Page 14<br />
H:\Doc\2010\<strong>Report</strong>s.2010\Rep2564v2.Doc
<strong>Wollongong</strong> <strong>City</strong> <strong>Council</strong> Coastal Zone Study<br />
Prepared for <strong>Wollongong</strong> <strong>City</strong> <strong>Council</strong><br />
stormwater drains; and structural damage to buildings caused by forces imposed by the<br />
sand (<strong>NSW</strong> <strong>Government</strong>, 1990). Areas at Windang and Port Kembla have been subject to<br />
this form of hazard in the past; however, extensive dune rehabilitation works mediated<br />
these problems. Such works have also been undertaken at other sites within the<br />
<strong>Wollongong</strong> coastal zone and form an effective solution to the hazard of sand drift. It is<br />
noted that dune restoration works continue within the study area and no sand drift problems<br />
currently exist. To this end no specific investigation of sand drift were considered within<br />
this study.<br />
3.7 Climate Change<br />
Research into the implications of climate change for Australia has been conducted by a<br />
broad spectrum of individuals and organisations that includes universities, research<br />
institutes, consultancies, government bodies and community groups. The Commonwealth<br />
Scientific and Industrial Research Organisation (CSIRO) has been a major contributor in<br />
providing ongoing research and knowledge concerning the status, risk exposure and<br />
opportunities from climate change in Australia. The CSIRO has published numerous<br />
reports examining the potential impact of climate change on a national, regional and local<br />
scale which have guided the private and public spheres on how to respond to climate<br />
change.<br />
For the purposes of this study, the regional coastal projections of climate change are<br />
discussed under the following subheadings:<br />
• Sea level rise (SLR);<br />
• Rainfall;<br />
• Wind;<br />
• Frequency of extreme events; and<br />
• Adopted climate change scenarios.<br />
3.7.1 Sea Level Rise<br />
At the regional scale, sea levels can be influenced by variations in ocean currents and in<br />
the atmosphere due to different wind regimes (McInnes et al., 1998). Coastal responses to<br />
SLR can be highly variable and often unpredictable, and are greatly influenced by the local<br />
geomorphology. Temporary flooding/inundation associated with storm systems is generally<br />
of short duration, due to the infrequent and large-magnitude nature of these events, as well<br />
as the dependence of these processes on tide level, which varies from high to low water<br />
over 6 hours. On the other hand, the cumulative erosion and inundation, of presently<br />
affected sites, that would be associated with global SLR or land subsidence processes<br />
would be of longer duration, and may be associated with low-magnitude events. Although<br />
the magnitude of future SLR may be relatively small in isolation, where severe storms<br />
coincide with elevated sea levels, wave attack and storm surge will result in significant<br />
impacts on presently and newly vulnerable coastal areas.<br />
Research into the long term SLR estimates for Australia indicates that the rate of SLR is<br />
slightly less than the global average. Church et al. (2006) analysed two of Australia’s<br />
longest tide gauge records: Fort Denison, Sydney, and Fremantle, in Western Australia.<br />
That study determined that the local SLR from 1950 to 2000 was 1.3 (± 0.5) mm/year,<br />
compared with a global average of 1.8mm/year. The difference is primarily thought to be<br />
30 June 2010 Cardno Lawson Treloar Pty Ltd Page 15<br />
H:\Doc\2010\<strong>Report</strong>s.2010\Rep2564v2.Doc
<strong>Wollongong</strong> <strong>City</strong> <strong>Council</strong> Coastal Zone Study<br />
Prepared for <strong>Wollongong</strong> <strong>City</strong> <strong>Council</strong><br />
due to the more frequent and intense El Niño events that have occurred since the mid-<br />
1970’s, which caused lower sea-levels around Australia (Holper et al., 2005).<br />
DECCW, in planning for climate change, have produced a Sea Level Rise Policy Statement<br />
(DECCW, 2009a) that sets SLR planning benchmarks of 40cm by 2050 and 90cm by 2100<br />
(relative to 1990 mean sea levels). These benchmarks are derived from both IPCC<br />
projections and CSIRO research. The manner in which they were calculated incorporates<br />
a range of variables, as shown in Table 3.2. The SLR component is derived from the IPCC<br />
SRES A1F1 climate change scenario due to the fact that, in the last decade, the observed<br />
global average of sea level from satellite data is tracking along the upper bound of the<br />
IPCC projections.<br />
Table 3.2: Water Level Components of SLR Planning Benchmarks (after DECCW, 2009a and b)<br />
Component 2050 2100<br />
SLR 30 cm 59 cm<br />
Accelerated ice melt (included above) 20 cm<br />
Regional SLR variation 10 cm 14 cm<br />
Rounding* - -3 cm<br />
Total 40 cm 90 cm<br />
DECCW’s SLR Policy will be given statutory effect through SEPP71 – Coastal Protection<br />
and through a Ministerial Direction to local councils under Section 117 of the Environmental<br />
Planning and Assessment Act 1979. The Sea Level Rise Policy Statement (DECCW,<br />
2009a) supersedes the 1988 <strong>NSW</strong> Coastline Hazard Policy. Most objectives from that<br />
policy have been included in the <strong>NSW</strong> Coastal Policy 1997, which remains current. Other<br />
objectives from the 1988 <strong>NSW</strong> Coastline Hazard Policy are updated by the Sea Level Rise<br />
Policy Statement.<br />
3.7.2 Rainfall<br />
DECC (2008) quotes CSIRO research that predicts the Illawarra region will experience<br />
substantial increase in summer rainfall. However, overall, there will more likely than not be<br />
a significant net change in average annual runoff. It surmises that there will be some<br />
redistribution of runoff across the seasons, with likely increases in summer and autumn and<br />
decreases in winter and spring.<br />
Seasonal changes in average runoff depth are likely to be:<br />
• Summer: -1% to +22%;<br />
• Autumn: -6% to +14%;<br />
• Winter: -12% to +3%; and<br />
• Spring: -19% to +1%.<br />
3.7.3 Wind<br />
At present, the prevailing winds in the <strong>Wollongong</strong> area are from the south-east during the<br />
winter months and from the north-east and east during the summer months. During the<br />
day, sea breezes dominate (Hazelwood, 2007).<br />
30 June 2010 Cardno Lawson Treloar Pty Ltd Page 16<br />
H:\Doc\2010\<strong>Report</strong>s.2010\Rep2564v2.Doc
<strong>Wollongong</strong> <strong>City</strong> <strong>Council</strong> Coastal Zone Study<br />
Prepared for <strong>Wollongong</strong> <strong>City</strong> <strong>Council</strong><br />
CSIRO (2007) undertook a climate change study for <strong>NSW</strong> and concluded that predictions<br />
relating to wind changes for the state contained large uncertainty in most seasons. In<br />
general, mean wind-speed projections showed a tendency for increases across much of<br />
the state in summer, with decreases in wind from the north-east. In autumn, there was a<br />
tendency towards weaker winds from the south and east, and stronger winds from the<br />
north-west. In winter, increases in winds were from the north-west and south, with wind<br />
speeds decreasing elsewhere. Lastly, there was a general tendency for stronger winds to<br />
occur in spring across the state.<br />
Extreme winds have similar patterns to mean wind speed changes in summer and autumn,<br />
although the magnitudes of the changes are larger; particularly over the continent due to<br />
frictional effects. In winter, the ocean in the south of <strong>NSW</strong> showed a tendency for<br />
increasing extreme winds with only the north-east of <strong>NSW</strong> indicating decreasing winds<br />
(Hennessy et al., 2004).<br />
3.7.4 Frequency of Extreme Events<br />
There is no current consensus on the impact of climate change on coastal storms in the<br />
Illawarra region of <strong>NSW</strong>. While the IPCC (2007) warns of a potential increase in the<br />
frequency and intensity of coastal storms and cyclonic events, recent studies (for example<br />
CSIRO, 2007, and McInnes et al., 2007) present climate change predictions that indicate<br />
both increased and decreased wind speeds along the <strong>NSW</strong> coast, depending on the model<br />
and/or climate change scenario applied.<br />
<strong>Wollongong</strong> is not located in an active tropical cyclone region and even studies which<br />
predict the largest increase in the southern extent of the east Australia cyclone region due<br />
to climate change processes do not predict cyclones off the Illawarra region within the next<br />
50 to 100 years (CSIRO, 2007).<br />
Of more importance for the <strong>Wollongong</strong> area is the potential change in ECL event<br />
frequency and/or intensity due to climate change. Current understanding on ECL events is<br />
limited, although it is widely believed that the ENSO cycle has a significant influence on the<br />
frequency of ECL events. A study of ECLs along the Queensland coast identified that<br />
ECLs have doubled in frequency over the 30 years to 2000 (AGSO, 2000), most notably<br />
due to the 1970-1980 period of high frequency events, and while it identifies that this is<br />
significant, it also makes the point that this “appears linked to broader climatic variations”<br />
such as the Southern Oscillation Index, rather than to climate change.<br />
Climate change models developed to date have not been able to investigate changes to<br />
wind conditions generated by small scale systems such as ECL events. CSIRO (2007)<br />
concludes that for ECL events “model studies do not as yet indicate how the occurrence of<br />
east coast low pressure systems may change”.<br />
Due to the lack of consensus related to climate change impacts on the frequency and/or<br />
intensity of these events it is considered appropriate to adopt coastal storm conditions<br />
based on the current climatology and historical records. For the purposes of this study, the<br />
offshore design wave climate is based on measured offshore data from the Port Botany<br />
WRB during the 1970’s and 1980’s which is a significantly more severe dataset compared<br />
to the present Long Reef or Port Kembla datasets.<br />
30 June 2010 Cardno Lawson Treloar Pty Ltd Page 17<br />
H:\Doc\2010\<strong>Report</strong>s.2010\Rep2564v2.Doc
<strong>Wollongong</strong> <strong>City</strong> <strong>Council</strong> Coastal Zone Study<br />
Prepared for <strong>Wollongong</strong> <strong>City</strong> <strong>Council</strong><br />
3.7.5 Adopted Climate Change Scenarios<br />
For the purposes of this assessment, a SLR parameter value in accordance with the <strong>NSW</strong><br />
Sea Level Rise Policy Statement (DECCW, 2009a) has been adopted, being a 0.90m sea<br />
level rise by 2100 from 1990 levels. It is considered that sea levels have risen 0.06m since<br />
1990, however, no adjustment to the year 2010 has been made due to the nature of the<br />
analyses within this study. That is, much of the data on which this study is based ranges in<br />
period and was derived pre-2010. Furthermore, the minor level of conservatism that is<br />
applied by adopting the 0.9m from 2010 is consistent with planning objectives in the coastal<br />
zone, given that 0.06m is relatively small when compared to 0.9m.<br />
In line with potential seasonal increases in rainfall runoff, a 10% increase in rainfall<br />
intensities to 2050 and 20% increase from the present to 2100 is considered appropriate for<br />
consideration within this study. Rainfall information was provided for inclusion in the<br />
geotechnical and slope stability assessments and is further discussed in Section 6.<br />
Furthermore, for the purposes of this study it was assumed that current tidal planes<br />
(relative to the rising mean sea level), wind prominence and storm intensity and frequency<br />
will remain unchanged into the future. Due to the uncertainty in the various climate change<br />
projections for these features it is considered appropriate to adopt conditions based on the<br />
current climatology and historical records.<br />
30 June 2010 Cardno Lawson Treloar Pty Ltd Page 18<br />
H:\Doc\2010\<strong>Report</strong>s.2010\Rep2564v2.Doc
<strong>Wollongong</strong> <strong>City</strong> <strong>Council</strong> Coastal Zone Study<br />
Prepared for <strong>Wollongong</strong> <strong>City</strong> <strong>Council</strong><br />
4 Study Methodology and Data<br />
As described in the Section 3, a range of coastal hazards can occur in the study area,<br />
including storm erosion, shoreline recession, oceanic inundation (including wave<br />
overtopping) and hazards related to the interactions of the ocean and beach with stormwater<br />
drainage and creek flows. Potential climate change impacts including SLR could<br />
further exacerbate coastal hazards at the site.<br />
The primary goals of this coastal hazard study were to quantify, in some level of detail,<br />
coastal processes and hazards along the <strong>Wollongong</strong> LGA coastline. In line with the<br />
relevant policy document (DoP, 2009), these analyses have been undertaken in terms of<br />
the 100-years ARI design storm parameters, noting that there is some risk that these<br />
conditions can be exceeded during a selected planning period.<br />
The stages in defining the coastal hazards were:<br />
• Examine existing hazard and coastal processes information;<br />
• Determine the major processes influencing the coastal region;<br />
• Review geotechnical investigations undertaken in the LGA;<br />
• Undertake quantitative investigations of relevant coastal processes including<br />
numerical modelling and analysis of photogrammetric data; and<br />
• Determine coastal parameters for the 100-years ARI design condition (wave<br />
parameters, design water levels and storm erosion, wave overtopping details).<br />
4.1 Model Systems<br />
There is little or no data quantifying wave and water level parameters at the study site for<br />
the purpose of investigating hazard magnitudes, or for the preparation of design<br />
parameters for coastal works. Hence, a numerical wave model system (SWAN) was<br />
applied with available offshore wave data in order to develop this information for the<br />
purposes of this study. The SBEACH modelling system was used also to investigate storm<br />
erosion at individual beaches within the study area and the Delft3D FLOW model was<br />
adopted for wave inundation investigations. The model systems are described briefly in<br />
this section of the report.<br />
4.1.1 SWAN<br />
The SWAN wave model was developed at the Delft University of Technology and includes<br />
a full spectral solution for wave propagation, wind input, refraction, diffraction, shoaling,<br />
model boundary wave input, directional spread, bed friction, white-capping, wave breaking<br />
and non-linear wave-wave interaction. There is a nested modelling capability that allows<br />
for large areas to be modelled whilst providing fine resolution in areas where seabed<br />
depths have high spatial variability.<br />
The SWAN model utilised in this study extended offshore beyond the 100m depth contour,<br />
approximately 12km offshore. A 100m resolution grid extended over the <strong>Wollongong</strong><br />
coastline and eleven 10m resolution grids (covering the beaches and headlands of the<br />
<strong>Wollongong</strong> region) out to a depth beyond 20m AHD were nested inside the overall model.<br />
Figure 4.1 describes the extent of the SWAN model applied in this study. Cardno Lawson<br />
Treloar has achieved good calibration when transferring offshore Port Kembla wave data<br />
30 June 2010 Cardno Lawson Treloar Pty Ltd Page 19<br />
H:\Doc\2010\<strong>Report</strong>s.2010\Rep2564v2.Doc
<strong>Wollongong</strong> <strong>City</strong> <strong>Council</strong> Coastal Zone Study<br />
Prepared for <strong>Wollongong</strong> <strong>City</strong> <strong>Council</strong><br />
(including Sydney (Long Reef) directional wave data) to the Shellcove region using the<br />
SWAN wave model. Figure 4.2 presents a time series plot of measured and modelled<br />
wave conditions at Shellcove (south of <strong>Wollongong</strong>) at a depth of approximately 22m. The<br />
SWAN model has the same parameters as the <strong>Wollongong</strong> region SWAN model applied in<br />
that study. Boundary conditions of the Shellcove model also used measured Port Kembla<br />
wave height and period, and measured direction from Long Reef. The model output agrees<br />
well with the measured data. No other inshore wave data was available for model<br />
calibration within this study.<br />
4.1.2 SBEACH<br />
SBEACH was developed by the U.S. Army Corps of Engineers (USACE) to investigate<br />
storm induced profile response on fine to medium grain sand beaches. It is an empirically<br />
based model that includes wave shoaling, refraction, breaking, set-up and run-up. The<br />
model can simulate a temporally varying wave breaking-point, which produces offshore bar<br />
migration. The model has been widely applied at sites all over the world and has<br />
demonstrated reasonable levels of calibration. A feature of SBEACH is that underlying<br />
rock layers can be specified in the model. SBEACH has been used to describe the beachby-beach<br />
variation in storm bite relative to the design 100-years erosion volume adopted in<br />
this study for the beach most exposed to wave energy/storm bite in the study area.<br />
4.1.3 Delft3D FLOW<br />
Investigations of water levels, currents, transport-dispersion and turbulent processes<br />
require the application of a high level model capable of simulating a range of processes<br />
(including ocean wave and tidal forcing) with some confidence. Such simulations can be<br />
successfully undertaken using the Delft3D hydrodynamic modelling system.<br />
The Delft3D modelling system includes wind, pressure, tide and wave forcing, threedimensional<br />
currents, stratification, sediment transport and water quality descriptions and is<br />
capable of using irregular rectilinear or curvilinear coordinates.<br />
Delft3D allows the application of a specialised advection scheme that can be implemented<br />
for problems that include rapidly varying flows, for instance in hydraulic jumps, bores and<br />
wave inundation (Stelling and Duinmeijer, 2003). The scheme is denoted as the Flooding<br />
Scheme and was developed for 2D simulations with a rectilinear grid of the inundation of<br />
dry land with obstacles such as road banks and dikes. It is particularly robust when applied<br />
to rapidly varying depth-averaged flows, for instance the inundation of dry land or flow<br />
transitions due to large gradients of the bathymetry (obstacles).<br />
A series of model grids were developed for this study for the various beach compartments.<br />
Typically, model grids extended landward from the erosion hazard line and beyond the 10m<br />
AHD contour. Grid resolutions in the order of 1m were adopted. An example of a model<br />
grid layout applied in this study is provided in Figure 4.3 for Sandon Point.<br />
4.2 Data Inputs<br />
A range of data was required to establish and run the numerical model systems, and also<br />
to undertake analyses of the historical magnitudes of the processes and hazards in<br />
question. They are described in Sections 4.2.1 to 4.2.6.<br />
30 June 2010 Cardno Lawson Treloar Pty Ltd Page 20<br />
H:\Doc\2010\<strong>Report</strong>s.2010\Rep2564v2.Doc
<strong>Wollongong</strong> <strong>City</strong> <strong>Council</strong> Coastal Zone Study<br />
Prepared for <strong>Wollongong</strong> <strong>City</strong> <strong>Council</strong><br />
4.2.1 Geospatial Data<br />
A Digital Elevation Model (DEM) was developed for the <strong>Wollongong</strong> coastline from south of<br />
Bass Point to north of Stanwell Park and out to the 100 mAHD depth (approximately 12km<br />
offshore). The DEM was developed from a variety of sources including:<br />
• LiDAR data provided by WCC;<br />
• Data from hydrographic charts available from the Australian Hydrographic Office<br />
(AUS195 and AUS808); and<br />
• A hydrographic survey conducted of <strong>Wollongong</strong> Harbour.<br />
In order to best represent the presence of (unsurveyed) shelf reef sections, the DEM was<br />
augmented qualitatively with additional elevation data based on visual interpretation of<br />
aerial photographs. The region north of Bellambi Point through to Stanwell Park has a very<br />
coarse description in the hydrographic charts. The process of wave refraction from<br />
offshore to near shore is dependent on the bed slope. Due to the sparseness of the<br />
available data within this region, the bed-slope is not well described, resulting in<br />
interpolation over long distances (that is, from one headland to another). In order to<br />
improve the accuracy of the DEM, 0m and -2m AHD contour lines were estimated<br />
qualitatively from aerial photography and site observation with the view to reducing the<br />
extent of unrealistic interpolation. Whilst these modifications improved the DEM in the<br />
nearshore region, there is still a degree of uncertainty in the nearshore bathymetry<br />
throughout the northern region of the study area.<br />
4.2.2 Geotechnical Data<br />
The site inspections and anecdotal/observational evidence (pers. comm., Tobin, WCC –<br />
Garber/Treloar, Cardno) suggested the presence of underlying rock layers that are<br />
exposed during major ocean storm erosion events. The presence of such underlying rock<br />
layers (or hard clay) acts as a limiting factor in storm induced erosion. Hence, in order to<br />
ensure the accuracy of any storm bite analysis, it was necessary to determine the location<br />
and extent of any underlying rock layers within the beach compartments. Geotechnical<br />
surveys were conducted by WCC at most beaches, with the resulting rock layer upper level<br />
and sediment size data being incorporated into the SBEACH modelling for site specific<br />
storm bite analyses.<br />
The outcomes of these investigations are presented in Appendix A. A total of 23 test pits<br />
were assessed, typically with two test pits dug on each beach. Test pit locations were<br />
chosen to provide information about the longshore (on long beach compartments) and<br />
cross shore (on small pocket beaches) variation in the underlying rock/clay layers, in order<br />
to limit the number of test pit locations.<br />
Sediment grain size analyses provided sediment grading curves and the D 50 (50% passing<br />
grain size) was inferred from the results and applied to the storm bite modelling. These<br />
results are summarised in Table 4.1.<br />
30 June 2010 Cardno Lawson Treloar Pty Ltd Page 21<br />
H:\Doc\2010\<strong>Report</strong>s.2010\Rep2564v2.Doc
<strong>Wollongong</strong> <strong>City</strong> <strong>Council</strong> Coastal Zone Study<br />
Prepared for <strong>Wollongong</strong> <strong>City</strong> <strong>Council</strong><br />
Table 4.1: Median Sediment Diameter (D 50 ) Values at Profile Modelling Sites<br />
Beach<br />
D50 (mm)<br />
4.2.3 Photogrammetric Data<br />
Stanwell Park 0.47<br />
Coalcliff 0.39<br />
Wombarra 0.39<br />
Coledale 0.36<br />
Sharkies 0.34<br />
Austinmer North 0.36<br />
Austinmer 0.36<br />
Thirroul 0.26<br />
McCauley’s 0.26<br />
Sandon Pt Beach 0.35<br />
Bulli 0.36<br />
Woonona 0.33<br />
Bellambi 0.32<br />
Bellambi Pt 0.31<br />
Corrimal 0.35<br />
Towradgi 0.38<br />
North <strong>Wollongong</strong> 0.26<br />
Coniston 0.36<br />
Perkins 0.27<br />
Photogrammetric data was provided by DECCW for eight beaches along the <strong>Wollongong</strong><br />
coastline, they being:<br />
• Austinmer,<br />
• Bulli (including Sandon Point Beach),<br />
• Coledale,<br />
• Coniston,<br />
• Corrimal (including Bellambi Lagoon Entrance),<br />
• North <strong>Wollongong</strong> (including Fairy Creek Entrance),<br />
• Thirroul,<br />
• Perkins, and<br />
• Woonona<br />
The data sets provided covered a range of years from 1936 to 2007 and contained<br />
between four and twelve surveys during this period of time for most beaches. The extent of<br />
available photogrammetric data is presented in Appendix B and summarised in Table 4.2.<br />
30 June 2010 Cardno Lawson Treloar Pty Ltd Page 22<br />
H:\Doc\2010\<strong>Report</strong>s.2010\Rep2564v2.Doc
<strong>Wollongong</strong> <strong>City</strong> <strong>Council</strong> Coastal Zone Study<br />
Prepared for <strong>Wollongong</strong> <strong>City</strong> <strong>Council</strong><br />
Table 4.2: Available Photogrammetric Data<br />
Dates<br />
Coledale<br />
Austinmer<br />
Thirroul<br />
Bulli<br />
(inc Sandon Pt)<br />
Bellambi Lagoon<br />
Entrance<br />
Woonona<br />
Corrimal<br />
Fairy Creek<br />
Entrance<br />
North <strong>Wollongong</strong><br />
Beach<br />
Coniston<br />
Perkins<br />
1936 x<br />
1937 x X x<br />
1938 x<br />
1948 x x<br />
1951 x x<br />
1955 x x x x X x<br />
1961 x x x x x x x x<br />
1966 x x x x<br />
1967 x<br />
1972 x x x x<br />
1974 x x x x x x x X x x<br />
1976 x<br />
1977 x<br />
1981 x<br />
1984 x x x x<br />
1987 x x x x x<br />
1988 x<br />
1990 x x<br />
1993 x x x x x x x x X x<br />
1999 x x x x x x x<br />
2001 x x x x<br />
2005 x x<br />
2007 x x x x x x x<br />
4.2.4 Tides and Water Levels<br />
Tidal planes derived from analyses of water level records at Port Kembla are shown in<br />
Table 3.1 (National Tide Tables, 2010). These tidal planes can be considered appropriate<br />
for the <strong>Wollongong</strong> coastline. Tides in this location are semi-diurnal; that is, there are<br />
normally two high and two low tides each day. On rare occasions there may be only one<br />
high or low tide because the lunar tidal constituents have a period of about 25 hours.<br />
There may also be a significant diurnal difference; that is, a significant difference between<br />
successive high tides and successive low tides.<br />
Table 4.3 presents extreme water levels for typical ARIs, derived from the Fort Denison<br />
water level records (Manly Hydraulics Laboratory, 1992). These levels exclude wave setup<br />
and relate to locations seaward of the breaker zone. The adoption of extreme water<br />
levels from analysis of the Fort Denison tide gauge is appropriate for this study as there is<br />
no appreciable difference between offshore locations and this site (that is, it is not affected<br />
by local wave set-up) and it provides a long-term record on which to derive reliable extreme<br />
30 June 2010 Cardno Lawson Treloar Pty Ltd Page 23<br />
H:\Doc\2010\<strong>Report</strong>s.2010\Rep2564v2.Doc
<strong>Wollongong</strong> <strong>City</strong> <strong>Council</strong> Coastal Zone Study<br />
Prepared for <strong>Wollongong</strong> <strong>City</strong> <strong>Council</strong><br />
water level statistics. DECCW policy documents (for example, DECCW 2009c) also<br />
recommend the application of these statistics along the <strong>NSW</strong> coast where “full open coast<br />
tidal range conditions occur” DECCW (2010), as is the case along the <strong>Wollongong</strong> coastal<br />
zone.<br />
4.2.5 Waves<br />
Table 4.3: Extreme Water Levels at Fort Denison (Source: DECCW, 2010)<br />
ARI (years)<br />
Water Level<br />
m LAT<br />
m AHD<br />
10 2.27 1.35<br />
20 2.30 1.38<br />
50 2.34 1.41<br />
100 2.36 1.44<br />
As discussed in Section 3.1.1, the offshore wave climate in the <strong>Wollongong</strong> region is<br />
dominated by south to south-east sector swell conditions. Mean wave offshore conditions<br />
are typically wave height (H s ) of approximately 1.5m and wave period (mean, T z ) of 6s.<br />
Figure 4.4 presents the annual offshore wave rose developed from data recorded between<br />
1992 and 2005. Figure 4.5 presents similar wave roses for the summer, autumn, spring<br />
and winter periods. The highest offshore wave conditions are generally from the south to<br />
south-east sector. During summer, the occurrence of easterly and east-north-easterly<br />
wave conditions is much higher than for other seasons. During winter, southerly and southeasterly<br />
wave conditions prevail.<br />
The wave height data used to prepare Figures 4.4 and 4.5 are from the Port Kembla<br />
offshore wave rider buoy (WRB) with directions from the directional WRB at Long Reef<br />
(Sydney). Previous studies have shown that offshore wave conditions at Sydney and Port<br />
Kembla are strongly correlated, with a correlation coefficient (R 2 ) of approximately 0.90.<br />
Figure 4.6 presents a time series comparison between Long Reef and Port Kembla wave<br />
heights for a three months period in 2004.<br />
Figure 4.7 presents a plot of peak storm wave heights for a range of ARIs. This plot is<br />
based on an extremal analysis of 18 years of offshore wave data from the Port Kembla<br />
WRB between 1987 and 2005. The climatology of storms along the <strong>NSW</strong> coast indicates<br />
that there are significant inter-decadal cycles that influence the frequency and intensity of<br />
ECL events. Figure 4.8 presents a plot of peak storm wave heights versus ARI based on<br />
14 years of offshore wave data from the Botany Bay WRB (operated by Sydney Ports)<br />
between 1971 and 1985. This time period featured a greater frequency of intense storms<br />
compared to the data in Figure 4.7. Given the close correlation between offshore wave<br />
conditions at Sydney and <strong>Wollongong</strong>, Figure 4.8 presents a more realistic description of<br />
peak offshore storm wave heights for return periods greater than 25 years ARI.<br />
Figure 4.4 indicates that south-east is the dominant offshore wave directional sector and<br />
that the largest storm waves also most frequently originate from this direction.<br />
Table 4.4 presents the peak offshore storm significant wave height based on the Botany<br />
Bay wave record for ARIs ranging from 5 through 100 years. Table 4.4 also includes the<br />
offshore storm wave period based on the Botany Bay wave record. Each design wave<br />
scenario was applied with the corresponding peak storm tide water level. Table 4.3<br />
30 June 2010 Cardno Lawson Treloar Pty Ltd Page 24<br />
H:\Doc\2010\<strong>Report</strong>s.2010\Rep2564v2.Doc
<strong>Wollongong</strong> <strong>City</strong> <strong>Council</strong> Coastal Zone Study<br />
Prepared for <strong>Wollongong</strong> <strong>City</strong> <strong>Council</strong><br />
presents the concurrent ocean storm tide for the mid-<strong>NSW</strong> coast, which has been adopted<br />
in this study (Lord and Kulmar, 2000).<br />
Table 4.4: Peak Offshore Storm Wave Conditions Based on the Botany Bay WRB 1971-1985<br />
ARI<br />
(Years)<br />
Wave<br />
Height<br />
(H s , m)<br />
T z (s)<br />
T p (s)<br />
5 7.8 9 12.6<br />
10 8.5 9.4 13.2<br />
25 9.3 9.9 13.8<br />
50 10 10.4 14.6<br />
100 10.6 10.8 15.1<br />
Design wave conditions can be expected to originate from the east-south-east to south<br />
sector in deep water (greater than 100m depth contour) and can be expected to have peak<br />
periods (T p ) in the order of 14 to 16s.<br />
4.2.6 Meteorological Data<br />
Rainfall was utilised in the geotechnical and slope stability assessments as it influences the<br />
potential for land slip. When considering such events, longer term, 90-days rainfall has<br />
been found to correlate to the occurrence of this phenomenon. Furthermore, the potential<br />
changes in rainfall intensity due to climate change may affect this likelihood.<br />
A frequency analysis was therefore undertaken on three Bureau of Meteorology (BoM)<br />
rainfall gauge sites to define the 90-days rainfall intensities, they being:<br />
• Woonona (Popes Rd);<br />
• Wombarra (Reef Ave); and<br />
• Port Kembla (BHP Central Lab).<br />
A 90-days running sum of rainfall was created from the historical data, ranked and then all<br />
non-independent data removed; that is, any data within 90 days of a maximum value was<br />
excluded from the next stage of the analysis. The maximum rainfall was then obtained for<br />
each calendar year since records were taken and then analysed using a Log-Pearson III<br />
Frequency Analysis.<br />
Climate change scenarios were then considered by factoring the rainfall intensities by<br />
+10% (2050) and +20% (2100), in line with rainfall projections discussed in Section 3.7.2.<br />
The resulting IFD (Intensity-Frequency-Duration) 90-days rainfall curves are presented in<br />
Figure 4.9.<br />
30 June 2010 Cardno Lawson Treloar Pty Ltd Page 25<br />
H:\Doc\2010\<strong>Report</strong>s.2010\Rep2564v2.Doc
<strong>Wollongong</strong> <strong>City</strong> <strong>Council</strong> Coastal Zone Study<br />
Prepared for <strong>Wollongong</strong> <strong>City</strong> <strong>Council</strong><br />
5 Coastal Processes and Hazard Definition<br />
The following section describes the outcomes of investigations of the coastal processes<br />
and hazards undertaken along the <strong>Wollongong</strong> coastline.<br />
5.1 Nearshore Wave Climate<br />
Design wave conditions at the site are dominated by waves breaking in nearshore depths<br />
that may be as shallow as 4 to 6m. Due to the dominance of breaking wave conditions, the<br />
SWAN model has been used to determine peak storm wave conditions at selected<br />
locations within the study site for return periods between 5 and 100-years ARI. Nearshore<br />
wave conditions have been obtained at sites for cliff locations and offshore of the beach<br />
compartment areas located in Figures 5.1 to 5.6, and the storm tide level for each selected<br />
return period has been applied (see Table 4.3). At the study site, wave heights and<br />
breaking wave depths are strongly influenced by the offshore wave directions. The<br />
beaches at the study site are most exposed to waves from the east to south-east sector.<br />
The critical offshore wave direction for the <strong>Wollongong</strong> beaches is generally east-southeast<br />
(ESE). The critical offshore wave direction can be defined as the offshore wave<br />
direction that leads to the largest near-shore wave height for a specified offshore wave<br />
height. The critical wave direction for cliff and headland regions is strongly dependent on<br />
the aspect (or exposure) of the cliff to the offshore wave direction. For this reason, the<br />
design offshore wave conditions for each ARI were applied for wave directions from the<br />
north-east through to the south at 22.5 o intervals. For each cliff location, the maximum near<br />
shore wave conditions across all offshore directions were adopted for the calculation of<br />
wave run-up.<br />
Appendix C presents the design wave conditions from the above analysis. Table C.1<br />
provides the nearshore wave conditions at the 6m depth contour offshore of the various<br />
beach compartments within the study area as shown in Figures 5.1 to 5.6. This<br />
information was used in the subsequent storm demand and wave inundation assessments.<br />
Table C.2 summarises wave conditions at selected locations along the cliff sections of<br />
coastlines. This information was provided to GHD for utilisation within the geotechnical<br />
assessment (see Section 6).<br />
5.1.1 Lake Illawarra<br />
Within the confines of Lake Illawarra, the wave climate is exclusively comprised of locally<br />
generated wind waves; there being no penetration of offshore swell energy into the lake<br />
basin. The formation of waves over a water surface is brought about by the transfer of<br />
energy from the wind to the waves. However, within Lake Illawarra, the formation of waves<br />
is limited by fetch length, width and lake depth.<br />
The fetch refers to the length of water over which the wind may act, with fetch width<br />
affecting total energy and directional spread. Wind duration or fetch length may reduce the<br />
time over which energy can be transferred from the wind to the waves, and limit wave<br />
growth. As a result, the waves within Lake Illawarra are typically of short period, steep and<br />
episodic, with long periods of time with low wave energy.<br />
30 June 2010 Cardno Lawson Treloar Pty Ltd Page 26<br />
H:\Doc\2010\<strong>Report</strong>s.2010\Rep2564v2.Doc
<strong>Wollongong</strong> <strong>City</strong> <strong>Council</strong> Coastal Zone Study<br />
Prepared for <strong>Wollongong</strong> <strong>City</strong> <strong>Council</strong><br />
5.2 Wave Set-up<br />
Wave set-up is an important component in the quasi-still water level observed at the<br />
shoreline of the study area. Considering an open beach, when wave breaking occurs,<br />
there is an increase in water level in the direction of the shoreline. This process is referred<br />
to as wave set-up. Wave set-up, which develops between the breaking point and the<br />
shoreline, is highly non-linear with the largest increase in water level occurring near the<br />
intersection of the initial still water line with the beach face. Along an open beach, the<br />
maximum increase in water level at the shoreline due to wave breaking is generally<br />
between 10% and 20% of the breaking wave height, depending on wave period, seabed<br />
slope and offshore wave direction. Using empirical formulae to calculate wave set-up at<br />
the shoreline, the SWAN model has been used to calculate regional wave set-up within<br />
embayments and on reef ledges. SWAN applies a two-dimensional momentum flux<br />
approach to calculate wave set-up. The SWAN model was run both with and without the<br />
set-up calculation in order to quantify the contribution of regional wave set-up to shoreline<br />
water levels.<br />
A key parameter in the determination of wave set-up is the breaking wave height coefficient<br />
that is specified in the SWAN model setup. There is no one number for this parameter and<br />
it can vary between approximately 0.6 (wave height/depth) for generally sloping sandy<br />
beaches up to above 0.85 for more steeply sloping shorelines. Along the <strong>Wollongong</strong><br />
coastline, the breaking wave index is likely to vary between 0.7 and 0.85. For conservative<br />
design and planning studies it is common to adopt a breaking wave index of 0.85 and this<br />
has been adopted in this study. As a result of this assumption, for some embayed<br />
beaches, the wave set-up and total water levels presented in this study are conservative.<br />
Appendix D presents total shoreline water levels (that is, at the elevated water line)<br />
including wave set-up at selected locations.<br />
5.3 Wave Run-up on Cliffs<br />
Wave run-up is an important process for the consideration of wave overtopping rates for<br />
cliffs and structures as well as cliff stability. Hughes (USACE, 2005) presents a formula for<br />
the estimation of irregular wave run-up on rough impermeable slopes (see Equation 3).<br />
The wave run-up parameter (R u2% ) is defined as the vertical distance between the still water<br />
level and the elevation exceeded by 2 percent of the run-up distribution (that is, for every<br />
100 incident waves, two waves would have a run-up elevation exceeding the level<br />
estimated by R u2% ). Wave run-up implicitly includes wave set-up.<br />
Equation 3: Non-dimensional formula for the estimation of wave run-up - R u2%<br />
R<br />
h<br />
u 2%<br />
30 June 2010 Cardno Lawson Treloar Pty Ltd Page 27<br />
H:\Doc\2010\<strong>Report</strong>s.2010\Rep2564v2.Doc<br />
= 4.4(tanα<br />
)<br />
0.7<br />
⎛ M<br />
⎜<br />
⎝ ρgh<br />
F<br />
2<br />
Where: h – water depth<br />
α – structure slope<br />
ρ – density of sea water<br />
g – gravity<br />
M F – wave momentum flux<br />
0.65 – roughness factor<br />
⎞<br />
⎟<br />
⎠<br />
1/ 2<br />
(0.65)
<strong>Wollongong</strong> <strong>City</strong> <strong>Council</strong> Coastal Zone Study<br />
Prepared for <strong>Wollongong</strong> <strong>City</strong> <strong>Council</strong><br />
Hughes (2005) established an empirical equation for estimating the wave momentum flux<br />
using a Fourier approximation (see Equation 4).<br />
Equation 4: Non-dimensional formula for the estimation of wave momentum flux – M F<br />
⎛ M<br />
⎜<br />
⎝ ρgh<br />
F<br />
2<br />
⎞ ⎛ h<br />
⎟ = A0<br />
⎜<br />
⎠ ⎝ gT<br />
2<br />
⎞<br />
⎟<br />
⎠<br />
− A1<br />
Where:<br />
2.026<br />
⎛ H ⎞<br />
A<br />
0<br />
= 0.<br />
639⎜<br />
⎟<br />
⎝ h ⎠<br />
−0.391<br />
⎛ H ⎞<br />
A<br />
1<br />
= 0. 180⎜<br />
⎟<br />
⎝ h ⎠<br />
h – water depth<br />
H – significant wave height H m0<br />
T – peak wave period<br />
ρ – density of sea water<br />
g – gravity<br />
M F – wave momentum flux<br />
Based on Dutch experience presented in USACE (2002) - de Waal and van der Meer - the<br />
roughness factor for rock and riprap structures varies between 0.5 and 0.6. A roughness<br />
factor of 0.65 was adopted in this study to represent the heterogeneity and impermeable<br />
nature present on natural cliff slopes. Whilst using a single constant for the reduction in<br />
run-up due to slope roughness seems simplistic, this approach is justified by the success of<br />
past run-up estimation formulae (Hughes, 2005).<br />
The slope of the cliff face was estimated from LiDAR data along transects perpendicular to<br />
the shore line. Wave parameters were obtained from SWAN model output and the wave<br />
direction producing the greatest wave momentum flux for each ARI. The maximum<br />
momentum flux at each location was then used to estimate the wave run-up at various<br />
points along the <strong>Wollongong</strong> coast.<br />
Table D.2 (Appendix D) presents the estimates of the 2% run-up levels in metres AHD at<br />
various representative cliffs along the <strong>Wollongong</strong> coastline for recurrence intervals of 5,<br />
10, 25, 50 and 100-years. Table D.2 (Appendix D) also presents the estimates of the 2%<br />
run-up levels in metres AHD, incorporating climate change projections to the year 2100, at<br />
various representative cliffs along the <strong>Wollongong</strong> coast for recurrence intervals of 5, 10,<br />
25, 50 and 100-years. These parameters enabled the geotechnical investigations to<br />
assess the change in wave run-up affected areas predicted to occur over the next 100-<br />
years.<br />
5.4 Coastal Inundation of Back-Beach Areas<br />
Under very severe ocean storms, potential wave run-up may be sufficiently high to overtop<br />
much of the back-beach area. Once the back-beach crest is reached and overtopping<br />
occurs, standard wave run-up algorithms (as applied at cliff locations) are no longer<br />
appropriate. Also, such algorithms may not be applicable for eroded beach faces where<br />
scour slopes and levels, design water levels and nearshore breaking wave conditions may<br />
render standard beach face run-up calculations unrealistic.<br />
30 June 2010 Cardno Lawson Treloar Pty Ltd Page 28<br />
H:\Doc\2010\<strong>Report</strong>s.2010\Rep2564v2.Doc
<strong>Wollongong</strong> <strong>City</strong> <strong>Council</strong> Coastal Zone Study<br />
Prepared for <strong>Wollongong</strong> <strong>City</strong> <strong>Council</strong><br />
In order to accurately assess wave inundation of the back-beach areas, the eroded beach<br />
shapes, as well as the likely storm wave characteristics, are needed to be spatially defined<br />
along the beach area, as has been done in the sub-sections above.<br />
Under fully eroded conditions, the slope of the eroded back-beach scarp can be adopted as<br />
1V:2.5H, based on the angle of repose for sand. The extent of scour at the back-beach line<br />
is generally taken to be -1m AHD, depending upon storm ARI. These assumptions were<br />
adopted in developing the erosion hazard lines and have been applied at other sites also.<br />
5.4.1 Wave Parameters<br />
Inshore wave conditions at the eroded back-beach scarp were determined using the wave<br />
modelling results and the breaking wave criteria. Using a breaking wave parameter of 0.85<br />
(SPM, 1984) on a seabed slope of 1V:10H (adopted for storm eroding beach-faces)<br />
immediately seaward of the back-beach scarp, a limiting breaking wave height could be<br />
determined for assessment of the overtopping wave height.<br />
Wave periods were based on Waverider buoy observations made in May 1974, where a<br />
relationship was developed by Cardno Lawson Treloar from correlation analyses of<br />
offshore <strong>NSW</strong> WRB data, Equation 5.<br />
Equation 5: Wave Height – Wave Period Relationship<br />
T = 4 .0 + 0. 64×<br />
z<br />
H s<br />
Where: T z – zero crossing wave period offshore (seconds)<br />
H s – offshore storm significant wave height (metres)<br />
The nature of wave overtopping would be episodic. That is, the irregular nature of storm<br />
waves would result in only the larger waves overtopping the back-beach near the peak of<br />
the storm tide. An overtopping episode can then be assumed on the basis of a realistic<br />
wave group, taken to be seven consecutive overtopping waves. This is typical of the higher<br />
number of large waves within a wave-group that may contribute to wave overtopping. It<br />
would be followed some minutes later by other wave groups, until the tide fell and<br />
overtopping ceased.<br />
5.4.2 Wave Overtopping<br />
Wave overtopping rates were estimated using available published wave overtopping<br />
computational methods and PIANC (1992) provides an overtopping flow in terms of m 3 /m/s.<br />
This is defined by the relationship in Equation 6.<br />
Where<br />
Equation 6: Wave Overtopping Rate (PIANC, 1992)<br />
Q∗<br />
3<br />
Q = gH s<br />
s<br />
2π<br />
Q – is the mean overtopping discharge<br />
Q<br />
∗<br />
– is a dimensionless discharge derived from a freeboard<br />
H s – is the wave height<br />
s – is the wave steepness<br />
sea-wall slope coefficients (PIANC,1992 – Section 4.2.4.3).<br />
30 June 2010 Cardno Lawson Treloar Pty Ltd Page 29<br />
H:\Doc\2010\<strong>Report</strong>s.2010\Rep2564v2.Doc
<strong>Wollongong</strong> <strong>City</strong> <strong>Council</strong> Coastal Zone Study<br />
Prepared for <strong>Wollongong</strong> <strong>City</strong> <strong>Council</strong><br />
By adopting overtopping flow conditions to be ‘critical’, wave overtopping rates can be<br />
converted to a peak wave height at the eroded back-beach scarp. Such critical flow<br />
conditions have been observed during physical model testing of wave overtopping of the<br />
Manly Pier walkway (pers. comm., Dr Doug Treloar).<br />
5.4.3 Inland Wave Propagation<br />
The propagation of the group of seven waves landward from the overtopping point (at the<br />
erosion hazard line) was described in 2D FLOW models set-up using the Delft3D<br />
hydrodynamic modelling system, with the specialised flooding scheme for overland flow,<br />
and the available survey and photogrammetric data of the beaches. This was achieved by<br />
developing a 2D model grid that extended landward from the erosion hazard line beyond<br />
the 10m AHD contour and extending north and south to describe the whole beach<br />
compartment.<br />
Obvious wave characteristics attenuated within less than 50m (approximately), depending<br />
upon the back-beach level, but a landward flow was identified beyond that distance in some<br />
cases. No data was available to calibrate the overtopping modelling, however, observed<br />
outcomes of the modelling are consistent with descriptions of wave overtopping at<br />
Austinmer Beach, for example.<br />
5.4.4 Inundation Hazard<br />
Simulations of wave overtopping were undertaken for existing conditions and the 2050 and<br />
2100 planning periods, including MSL rises of 0.4m and 0.9m, respectively, which reduces<br />
the freeboard for wave overtopping. These climate change scenarios considered<br />
overtopping of the receded back-beach erosion scarps. The outcomes of this modelling<br />
are described in Section 8.2.<br />
5.4.5 Lake Illawarra<br />
Inundation of the shoreline areas around Lake Illawarra may result from catchment flows,<br />
storm surge, wave overtopping or a combination of these phenomena.<br />
Recent investigations undertaken as part of the Lake Illawarra Floodplain Risk<br />
Management Study and Plan (Cardno, 2010) have defined peak flood levels within the<br />
Lake. That study utilised a full-process Delft3D model of Lake Illawarra. The model<br />
includes catchment flows as well as realistic ocean boundary conditions, for example, tides,<br />
waves and storm surge. The model included sediment transport calculations and<br />
morphological change so that the opening of the entrance (within the training walls) during<br />
a flood is realistically simulated, together with lake water levels.<br />
A range of scenarios were modelled and relevant results were utilised for inundation<br />
mapping within this study. For the full range of flood level results, the reader is referred to<br />
the draft Lake Illawarra Floodplain Risk Management Study and Plan (Cardno, 2010).<br />
Levels utilised for the inundation definition within this coastal zone study are summarised in<br />
Table 5.1.<br />
Storm surge penetration through the entrance of Lake Illawarra may also affect foreshore<br />
areas around the Lake, albeit to a reduced extent. Therefore, the inundation resulting from<br />
the 100-years ARI ocean storm surge event, excluding rainfall or catchment inflows, was<br />
30 June 2010 Cardno Lawson Treloar Pty Ltd Page 30<br />
H:\Doc\2010\<strong>Report</strong>s.2010\Rep2564v2.Doc
<strong>Wollongong</strong> <strong>City</strong> <strong>Council</strong> Coastal Zone Study<br />
Prepared for <strong>Wollongong</strong> <strong>City</strong> <strong>Council</strong><br />
investigated for this study. The same model system as described above was utilised for<br />
this task and the resulting Lake water levels are also provided in Table 5.1.<br />
Table 5.1: 100-years ARI Flood Levels (mAHD) in Lake Illawarra from Storm Surge and Catchment<br />
Events<br />
Foreshore<br />
2010 2050 (+0.4mSLR) 2100 (+0.9mSLR)<br />
Location Ocean Catchment Ocean Catchment Ocean Catchment<br />
Griffins Bay 0.71 2.24 1.16 2.49 1.71 3.04<br />
Tallawarra Power<br />
Station<br />
0.71 2.24 1.16 2.49 1.71 3.04<br />
Horsley Inlet 0.71 2.24 1.16 2.49 1.71 3.04<br />
Cudgeree Island<br />
Channel<br />
0.71 2.24 1.16 2.49 1.71 3.04<br />
Windang Bridge 0.84 2.15 1.22 2.44 1.76 3.01<br />
Entrance Channel 1.22 1.71 1.48 1.97 1.89 2.32<br />
Wave run-up and overtopping may also cause inundation of the lake foreshore areas,<br />
however, this process has not been assessed within this study because the short period<br />
wind waves will be attenuated on the very flat slopes of the nearshore lake bed.<br />
Where a block slopes steeply back from the shoreline edge structure, wave run-up may<br />
affect the very edge of a block. However, where a block is relatively flat, wave run-up may<br />
penetrate some distance inland, but is attenuated by percolation and friction. This<br />
landward reduction of wave inundation can not be estimated with great confidence for local<br />
sea conditions that are present within Lake Illawarra, and has been based on observational<br />
experience. It is assumed that wave run-up diminishes to zero at a point 10m inland from<br />
the edge structure – local sea has less overland penetration capacity than swell. This wave<br />
propagation parameter is based on observations made at Gosford during severe storms in<br />
June 2007, in which local wind sea was observed overtopping a seawall, with only spray<br />
propagating further than 5m inland.<br />
5.5 Sediment Transport and Historical Beach Change<br />
Photogrammetric data for the sandy beach areas of the study site have been provided by<br />
DECCW. The dates of the historical aerial photographs for each beach are given in Table<br />
5.2. Photogrammetric data was analysed in several different ways to gain an<br />
understanding of historical beach changes within the study area.<br />
The photogrammetric data was processed to describe the 2mAHD contour line from all<br />
available dates and plotted and compared in plan to allow an assessment of shoreline<br />
movement over the available data history. Beach volumes, in m 3 /m above 0mAHD, were<br />
assessed using the profile interrogation software BMAP. This allowed for an evaluation of<br />
the beach volume history and to extrapolate longer term beach volume trends for each<br />
beach compartment. Finally, beach widths were determined by measuring the horizontal<br />
distance from the base point of a given photogrammetric profile out to it’s +2mAHD<br />
contour. The outcomes of these analyses are presented in Appendix B.<br />
To aid in the verification of the storm demand modelling (Section 5.6.2), the<br />
photogrammetric data was analysed to determine the largest volume loss occurrences<br />
30 June 2010 Cardno Lawson Treloar Pty Ltd Page 31<br />
H:\Doc\2010\<strong>Report</strong>s.2010\Rep2564v2.Doc
<strong>Wollongong</strong> <strong>City</strong> <strong>Council</strong> Coastal Zone Study<br />
Prepared for <strong>Wollongong</strong> <strong>City</strong> <strong>Council</strong><br />
along each beach compartment, thereby providing the relative exposure of each beach<br />
compartment. This enables an indirect estimate of the impacts of large storm events (such<br />
as the 1974 storms) where consecutive photogrammetric dates are suitably close. Volume<br />
losses between consecutive photogrammetric dates were averaged over all available open<br />
coast profiles at a given site in order to provide a single averaged value at each beach<br />
compartment. Note that the dates of consecutive aerial photographs on some beaches are<br />
too great to provide storm bite estimates. The resulting maximum beach volume losses are<br />
presented in Table 5.2.<br />
Table 5.2: Maximum Beach Volume Losses (above 0mAHD)<br />
Maximum<br />
Beach<br />
Volume Loss<br />
(m 3 /m)<br />
Period<br />
Coledale 154 1955-1961<br />
Austinmer 91 1966-1974<br />
Thirroul 188 1972-1974*<br />
Sandon Point 127 1972-1974*<br />
Bulli 225 1972-1974*<br />
Woonona 206 1966-1972<br />
Corrimal 126 1972-1974*<br />
Nth <strong>Wollongong</strong> 90 1955-1974<br />
Coniston 121 1955-1974<br />
Perkins 123 1961-1974<br />
* Consecutive photogrammetry dates close enough to estimate storm demand from large storm<br />
events<br />
Coledale Beach<br />
Significantly less affected by the 1974 storms than most other beaches, Coledale<br />
experienced its heaviest beach erosion in between 1955 and 1961, where areas of the<br />
beach lost around 150m 3 /m of sand. Only small erosion was observed as a result of the<br />
1974 storms and after this period sand volumes fluctuated little, but overall remained<br />
steady to the year 2000. After this point, small amounts of erosion were observed until the<br />
end of the available data in 2007. Overall, Coledale shows significant accretion trends of<br />
beach volume and width, showing that the beach is relatively well sheltered from major<br />
storm events. This could possibly be attributed to the existence of large rocky outcrops to<br />
its north and south.<br />
Austinmer Beach<br />
After a steady period of accretion between 1961 and 1966, Austinmer Beach endured its<br />
heaviest recorded erosion between 1966 and 1974. During this period the beach lost<br />
around 91m 3 /m on average. In between 1974 and 2003 the beach experienced an overall<br />
trend of accretion in terms of both beach volume and beach width. From this time until the<br />
end of available data in 2007, Austinmer Beach experienced slow and steady erosion.<br />
Austinmer shows no evidence of beach rotation, with both the northern and southern<br />
extents exhibiting the same historical behaviour.<br />
30 June 2010 Cardno Lawson Treloar Pty Ltd Page 32<br />
H:\Doc\2010\<strong>Report</strong>s.2010\Rep2564v2.Doc
<strong>Wollongong</strong> <strong>City</strong> <strong>Council</strong> Coastal Zone Study<br />
Prepared for <strong>Wollongong</strong> <strong>City</strong> <strong>Council</strong><br />
Thirroul Beach<br />
At Thirroul, the beach experienced heavy erosion losses during the 1974 storms, also<br />
losing up to 190m 3 /m of the sand volume in some areas. The severity of the storm impact<br />
on this beach is most likely the result of the aspect of this beach to the Tasman Sea. The<br />
beachfront faces an east-south-easterly direction, and is highly exposed with minimal<br />
protection from headlands or other obstructions, leaving the beach vulnerable to attack<br />
from storm propagated waves. From 1974 to 1993, there was a significant accumulation of<br />
sand above the mean water level. However, between 1993 and 1999, up to 100m 3 /m of<br />
sand volume was lost again on the beach due to certain storm events. Since 1999, the<br />
beach has undergone natural restoration at a slow but steady rate.<br />
Bulli Beach<br />
The southern beachfront at Bulli also experienced heavy erosion as a result of the 1974<br />
storms, losing over 200m 3 /m of sand volume in some areas of the beach front. The<br />
northern beachfront also experienced some erosion, but the extent of this was significantly<br />
less than the southern beachfront due to the wave protection offered by rocky outcrops that<br />
surround the headlands. Between 1974 and 1993, there was a considerable accumulation<br />
of sand above the mean water level. More recently, between 1990 and 2005, there has<br />
been no significant variation in beach volumes.<br />
Woonona/Bellambi Beach<br />
Beach volumes at Woonona Beach increased at a steady rate during the late 1960’s and<br />
early 1970’s. As a result of the 1974 storms some areas in the centre of Woonona Beach<br />
suffered erosion of over 200m 3 /m, while the northern and southern extents were<br />
significantly less affected. From that time, beach volumes plateaued until the late 1980’s,<br />
whereby beach volumes at the northern end experienced a steady accretion of sand above<br />
the mean water level. The southern end of Woonona Beach has in this time shown an<br />
overall trend of accretion, but has behaved somewhat more sporadically.<br />
Corrimal Beach<br />
At Corrimal, beach volumes remained steady from the initial data collection date in 1961<br />
until the 1974 storms when considerable erosion took place. Most areas of the beachfront<br />
lost around 125m 3 /m, however towards the southern end of the beach, some areas<br />
experienced losses of around 250m 3 /m. This is attributed to the proximity of the sections to<br />
the entrance to Towradgi Creek. Lagoon breakouts, resulting from catchment run-off<br />
events, would significantly influence shoreline volumes in the vicinity of the lagoon<br />
entrance. After 1974, sand volumes remained steady until 1990 when another storm<br />
caused erosion losses of up to 150m 3 /m, leaving the beach at its most depleted in its 40<br />
years recorded history. This history shows that Corrimal is highly vulnerable to storm<br />
induced beach erosion, most likely due to the east-south-easterly orientation of its plan<br />
alignment. In between 1990 and 1993, Corrimal benefited from a rapid accretion of sand<br />
volume, since which time there has been no significant change in beach volume.<br />
North <strong>Wollongong</strong> / Fairy Creek Entrance<br />
Due to the sparse nature of the photogrammetric data available for Fairy Creek Entrance<br />
and North <strong>Wollongong</strong> Beach, a detailed history of beach volume cannot be determined.<br />
30 June 2010 Cardno Lawson Treloar Pty Ltd Page 33<br />
H:\Doc\2010\<strong>Report</strong>s.2010\Rep2564v2.Doc
<strong>Wollongong</strong> <strong>City</strong> <strong>Council</strong> Coastal Zone Study<br />
Prepared for <strong>Wollongong</strong> <strong>City</strong> <strong>Council</strong><br />
However, the limited data shows that the beach volume remained steady until the 1974<br />
storm events, where the sand volumes reached their minima. Records show that sand<br />
volumes of up to 100m 3 /m (around 20%) were lost as a result of these storms. Considering<br />
that this is much less than for other beaches, it is reasonable to assume that the rocky<br />
outcrops and reefs to the north and south of the main beachfront leave the beach<br />
reasonably well protected from these storm events. From 1974 until the most recent data<br />
collection in 1993, the beach went through a process of slow and steady accumulation of<br />
sand.<br />
<strong>Wollongong</strong> <strong>City</strong> / Coniston Beach<br />
The southern end of Coniston Beach was left at its most depleted after a storm event in<br />
1951, where most areas of the beach lost around 120m 3 /m sand. However, since that time<br />
the southern end of the beach has undergone a process of steady accretion to leave sand<br />
volumes at their largest recorded levels in 1993, the most recent year of available data.<br />
Sand volumes for the rest of the beachfront have remained steady since data collection<br />
began back in 1938, with no significant changes in beach volume. The only exception to<br />
this is at the very northern tip of the beach where a process of rapid sand accumulation<br />
took place between 1951 and 1955, possibly as the result of the process known as beach<br />
rotation. Surprisingly, the storm events of 1974 had no significant effects on <strong>Wollongong</strong><br />
<strong>City</strong>/Coniston Beach, as the beach seems to be well protected against these types of storm<br />
events. This protection can be attributed to the presence of large rocky headlands to the<br />
north and south of the beach.<br />
Perkins Beach<br />
Due to the length of Perkins Beach, extending over some 6km, the profiles at the northern<br />
and southern ends have exhibited different behaviour responses over time. While the<br />
southern extent and centre of the beach were affected heavily by the 1974 storms, losing<br />
up to 120m 3 /m, the northern extent suffered only minor erosion losses, remaining almost<br />
steady during this period. From 1974 onwards, the northern end of the beach has<br />
experienced a steady accretion of beach volume, with a rapid increase in beach width<br />
taking place from the period 1999 to present. The southern end of Perkins Beach<br />
remained steady until 1988 before suffering up to 60m 3 /m of erosion in some places. Since<br />
1999, the southern regions of Perkins Beach have experienced a strong accretion of both<br />
beach volume and width. The discrepancy between the northern and southern regions of<br />
Perkins Beach suggests that a small amount of beach rotation has occurred in the past – a<br />
characteristic of longer beaches.<br />
Summary<br />
For almost all locations, the 1974 profiles have the smallest sand volume above 0mAHD.<br />
The data for these profiles was collected approximately 5 months after the May and June<br />
1974 storms that caused extensive erosion along the <strong>NSW</strong> coast. The storm erosion which<br />
was observed along the mid-<strong>NSW</strong> coast during 1974 was the most severe in recent history<br />
and has commonly been adopted as the ‘design’ erosion event for this section of coast.<br />
However, since then, almost all the profiles have shown a steady increase in beach width<br />
and beach volume. To this end, no long-term shoreline recession could be indentified and<br />
was therefore adopted to be zero (for present MSL) for the determination of erosion hazard<br />
30 June 2010 Cardno Lawson Treloar Pty Ltd Page 34<br />
H:\Doc\2010\<strong>Report</strong>s.2010\Rep2564v2.Doc
<strong>Wollongong</strong> <strong>City</strong> <strong>Council</strong> Coastal Zone Study<br />
Prepared for <strong>Wollongong</strong> <strong>City</strong> <strong>Council</strong><br />
lines (refer to Section 8.1). This outcome is consistent with other studies undertaken for<br />
the <strong>Wollongong</strong> coast.<br />
5.5.1 Beach Rotation<br />
Shorelines in compartmental beach systems can be influenced by medium-term processes<br />
that may change the plan (longshore) alignment of the beach. Annual and inter-decadal<br />
oscillations of the plan alignment of the shoreline can be driven by seasonal or interseasonal<br />
processes, for example, the ENSO. Changes in storminess and offshore wave<br />
direction due to the ENSO phenomenon can lead to changes in the sediment transport<br />
patterns. In a compartmental beach, this can mean that under certain conditions there is<br />
an accumulation of sand at one end of the beach (compared to the ‘average’), while other<br />
conditions cause a reduction in sand – sand is moved from one end of the beach to the<br />
other. Investigations into beach oscillation in the Illawarra region have reported some<br />
evidence of this phenomenon occurring, for example, at Corrimal Beach (WBM, 2005) the<br />
magnitude has not been quantified.<br />
As part of the photogrammetric analyses undertaken for this study, potential beach rotation<br />
was identified at a limited number of more exposed beaches. Figure B.15 (Appendix B)<br />
provides an example at Bulli Beach. Over the more recent years (1984, 1993 and 2005),<br />
the +2m AHD contour can be seen to oscillate from record to record, implying that beach<br />
rotation may occur at this site. The change in beach width at the northern and southern<br />
compartment ends is in the order of 10m. However, due to the time period between<br />
records, this cannot be conclusively attributed to beach rotation. Definition of such a<br />
phenomenon would require a dataset of greater temporal resolution. Therefore, in the<br />
development of the erosion hazard extents, beach rotation has not been specifically<br />
included. Nevertheless, beach rotation is considered to be somewhat accounted for in the<br />
calculation of the mean photogrammetric profiles used for the storm demand modelling and<br />
as the base line position for future shoreline recession. That is, the mean profile position is<br />
affected by beach profile variations resulting from beach rotation where it occurs.<br />
5.6 Shoreline Recession<br />
As described above in Section 5.5, no long term recession of the beaches was identified<br />
from the available photogrammetric data. However, shoreline recession is generally<br />
expected as a result of projected SLR. In line with the recently published draft <strong>NSW</strong><br />
Coastal Risk Management Guide (DECCW, 2009c), the Bruun Rule was utilised to<br />
undertake this assessment.<br />
It is widely discussed that the traditional Bruun Rule approach, which is based on the<br />
equilibrium beach profile concept, is not valid where particular shoreline features are<br />
present (e.g. Cooper and Pilkey, 2004) and there are limitations in the application of the<br />
Rule throughout the coastal zone (Ranasinghe et. al., 2007). These include nearshore rock<br />
shelves and underlying rock/clay strata, amongst others. Nevertheless, there is presently<br />
no other practical coastal planning alternative for the estimation of beach profile response<br />
to SLR. To this end, site specific features were considered in defining the beach profile for<br />
practical application of the Bruun Rule.<br />
The Bruun Rule is applied to what is termed the active beach slope, being the slope<br />
between the berm level and the closure depth. Closure depth is defined as the seasonal<br />
30 June 2010 Cardno Lawson Treloar Pty Ltd Page 35<br />
H:\Doc\2010\<strong>Report</strong>s.2010\Rep2564v2.Doc
<strong>Wollongong</strong> <strong>City</strong> <strong>Council</strong> Coastal Zone Study<br />
Prepared for <strong>Wollongong</strong> <strong>City</strong> <strong>Council</strong><br />
limit of effective seasonal profile fluctuations (Dean, 2002). In other words, the seaward<br />
extent of observed long-term profile variations, past which no profile change would be<br />
normally expected. It is important to note that there is a range of definitions of closure<br />
depth, some referring to inner closure depths, beyond which there is no ‘effective’ sediment<br />
transport and other definitions refer to ‘outer’ closure depths which are the absolute<br />
seaward limit (depth) of wave driven net sediment transport. For the application of the<br />
Bruun Rule, Dean (2002) and others generally agree that the equilibrium beach profile<br />
should be based on the ‘inner’ (shallower) closure depth. The closure depth is related to<br />
the offshore wave climate and the wave transformation processes in the nearshore area at<br />
a particular site. Along the open <strong>NSW</strong> coast, the inner closure depth is generally<br />
considered to be in the order of 9 to 12m below MSL. The presence of rock shelves,<br />
however, would limit this closure depth, thereby steepening the active beach profile.<br />
While photogrammetric information is available for some beaches to describe the sub-aerial<br />
shoreline, very limited seabed information is available in the nearshore areas of the<br />
<strong>Wollongong</strong> LGA. Therefore, the closure depth was defined at a given site through review<br />
of available seabed levels and inspection of aerial photography for significant shoreline<br />
features. Where no significant features were identified, a closure depth of 12m was<br />
adopted. However, where rock platforms were present, the closure depth was limited to<br />
those depths. Following this assessment, an equilibrium beach profile was fitted to these<br />
profile points and the Bruun Rule applied. The adopted closure depths and shoreline<br />
recession results for the study beaches are provided in Appendix E.<br />
5.6.1 Other Climate Change Considerations<br />
The potential impact of climate change on the storm erosion demand along <strong>NSW</strong> beaches<br />
is an area of ongoing research. The CSIRO predicts that storm intensity and frequency<br />
could increase in response to climate change. However, the storm erosion processes<br />
along the <strong>NSW</strong> coast are highly influenced by long period climate processes such as the El<br />
Niño/La Nina southern oscillation phenomenon. However, the variation in ECL storm<br />
frequency due to the El Niño/La Nina cycle is not well understood. The available data<br />
indicates that ECLs are also more frequent during La Nina conditions and less frequent<br />
during strong El Niño conditions. From a planning perspective, there is no current method<br />
available to reliably consider the potential change in storm erosion due to climate change<br />
and hence this aspect has not been explicitly included in this study; however, a<br />
conservative offshore wave climate which includes data from severe storms in the 1970’s<br />
has been included in this study.<br />
5.6.2 Storm Induced Beach Erosion<br />
To quantify the storm demand for the 100-years ARI design parameters, numerical<br />
modelling of a series of beach profiles was undertaken using SBEACH. This process was<br />
adopted to determine the relative site exposure of each beach with respect to a most<br />
exposed open coast beach resulting from extreme offshore design conditions, see below.<br />
At the commencement of the study, an overall DEM was developed from all available<br />
topographic and bathymetric data. This included high resolution airborne laser survey<br />
(ALS) data over the beach areas. For the beach areas where photogrammetric data was<br />
unavailable, profiles were extracted from the DEM for the purposes of erosion hazard<br />
30 June 2010 Cardno Lawson Treloar Pty Ltd Page 36<br />
H:\Doc\2010\<strong>Report</strong>s.2010\Rep2564v2.Doc
<strong>Wollongong</strong> <strong>City</strong> <strong>Council</strong> Coastal Zone Study<br />
Prepared for <strong>Wollongong</strong> <strong>City</strong> <strong>Council</strong><br />
mapping. The relative position of the ALS data against the photogrammetric data set was<br />
undertaken where concurrent data was available and the ALS profiles adjusted accordingly<br />
to maintain consistency across the beach compartments.<br />
SBEACH was used to model the storm erosion resulting from 100-years ARI storm<br />
parameters, adopting a 7-days storm event (Carley and Cox, 2003) at a number of profiles<br />
within each beach compartment in order to describe the variation in storm demand along<br />
the <strong>Wollongong</strong> coast. These storm ‘hydrographs’ include varying wave parameters and<br />
tide level as shown in Figure 5.7. Average profiles developed from the photogrammetric<br />
data record for each beach were utilised for the modelling task. Smaller, closed beaches<br />
were usually represented by two profiles, while larger, more open coast beaches required<br />
consideration of more profiles, usually three or four. The resulting storm demand values<br />
varied significantly amongst beaches, as erosion is dependent upon wave conditions<br />
(relative exposure), profile shape and the presence of rock layers. The relative exposures<br />
indicated by the simulated storm demands are in keeping with the findings from the<br />
analysis of the photogrammetry, as presented in Section 5.5.<br />
Gordon (1987) undertook an assessment of beach fluctuations and shoreline change along<br />
the <strong>NSW</strong> coast. That study provides storm demand values at a range of recurrence<br />
intervals for both high and low demand open coast beaches. Based on this information and<br />
the assessment of eroded beach profiles (e.g. Nielsen et al, 1992) it is typically considered<br />
that the 100-years ARI high storm demand for open coast beaches along the <strong>NSW</strong> coast is<br />
250m 3 /m above 0m AHD (Gordon, 1987). Similarly, low storm demand is defined at<br />
160m 3 /m above 0m AHD for open coast beaches. The definition of storm demand to<br />
0mAHD is required in order to apply the methods of Nielsen et al (1992) in defining the<br />
foreshore position of the erosion hazard line (see Section 8.1). In light of the fact that<br />
there was no appropriate data to validate the storm demand modelling, the outcomes were<br />
normalised to these commonly adopted storm demand values. That is, in the southern<br />
region of the study area there are beaches that fulfil the description of an open coast, fullyexposed<br />
sandy beach. Two examples within the <strong>Wollongong</strong> study area are Bulli Beach<br />
and the southern end of Perkins (Windang) Beach; Bulli being high demand and Windang a<br />
low storm demand site. The predominant difference between these two beaches is their<br />
profile shape; the design storm conditions being very similar.<br />
The largest SBEACH storm demand results were observed at Bulli Beach, being 212m 3 /m<br />
above 0mAHD. Therefore, this storm bite result was scaled up to the 250m 3 /m value.<br />
Storm demand requirements on other beaches were scaled accordingly. In this way the<br />
SBEACH modelling provided the relative exposure of each beach in terms of storm bite.<br />
Table 5.3 presents the outcomes at Bulli and Windang Beaches and shows that the<br />
methodology adopted to define storm demand provides realistic outcomes.<br />
Location<br />
Table 5.3: Storm Demand Results (above 0mAHD)<br />
SBEACH Result<br />
(m 3 /m)<br />
Adopted Storm<br />
Demand (m 3 /m)<br />
100-years ARI<br />
Storm Demand (m 3 /m)<br />
(Gordon, 1987)<br />
Bulli (High Demand) 212 250 250<br />
Windang (Low Demand) 141 166 160<br />
30 June 2010 Cardno Lawson Treloar Pty Ltd Page 37<br />
H:\Doc\2010\<strong>Report</strong>s.2010\Rep2564v2.Doc
<strong>Wollongong</strong> <strong>City</strong> <strong>Council</strong> Coastal Zone Study<br />
Prepared for <strong>Wollongong</strong> <strong>City</strong> <strong>Council</strong><br />
The complete list of storm demand results is provided in Appendix E. Storm demand<br />
results have been utilised to define erosion hazard lines, described in Section 8.<br />
5.6.3 Lake Illawarra<br />
As discussed previously in Section 5.1.1, waves within Lake Illawarra are typically of short<br />
period, steep and episodic, with long periods of time of low wave energy. This episodic<br />
wave energy can cause removal of the shoreline sediments which then become stranded<br />
as offshore deposits. Therefore, morphologies sculptured during storms often persist<br />
through subsequent calm periods as relict features (NRC, 2007).<br />
Landward shoreline movement will also occur for the case of a fixed shoreline profile on<br />
which there is a long-term rise in sea level relative to the land. Waterline movement<br />
associated with sea level rise is considered to be an erosion problem, even though it does<br />
not necessarily involve the removal and transport of sediment (NRC, 2007; Riggs and<br />
Ames, 2003).<br />
The adopted approach along the open coast to assess shoreline recession as a result of<br />
sea level rise (the Bruun Rule) is thought inappropriate for use within an estuarine system<br />
such as Lake Illawarra, because of two main points. Firstly the Bruun Rule was developed<br />
using the Equilibrium Beach Profile theory which was developed for open-coast sandy<br />
shorelines with large dune systems of ‘infinite’ available volume; a characteristic which is<br />
not fulfilled along estuarine shoreline areas. Secondly, the Bruun Rule inherently assumes<br />
the beach profile is eroded under storm conditions and subsequently restored under normal<br />
conditions, thereby coming to equilibrium with the prevailing wave climate. Again, within<br />
estuarine systems, shoreline areas are not restored due to the short period and episodic<br />
nature of the incident wave climate, and hence the Bruun Rule cannot be applied.<br />
Shoreline recession due to sea level rise will predominantly occur due to the geometric<br />
translation of the waterline and the subsequent erosion by episodic storm waves. Some<br />
readjustment of the sub-aqueous profile may occur although this is likely to be small. To<br />
this end, the definition of an erosion hazard line has not been undertaken for the Lake<br />
Illawarra shoreline.<br />
Where no edge treatment or bank protection exists there is likely to be a gradual recession<br />
of the shoreline over time. The rate of this recession is difficult to quantify and is<br />
dependent on a number of site specific features such as:<br />
• Wave Exposure and Nearshore Depth<br />
• Vegetation - both nearshore and foreshore<br />
• Sediment Type<br />
• Sediment Sources and Sinks<br />
Furthermore, the rate of shoreline recession as a result of episodic erosion events is likely<br />
to be surpassed by shoreline recession due to sea level rise.<br />
30 June 2010 Cardno Lawson Treloar Pty Ltd Page 38<br />
H:\Doc\2010\<strong>Report</strong>s.2010\Rep2564v2.Doc
<strong>Wollongong</strong> <strong>City</strong> <strong>Council</strong> Coastal Zone Study<br />
Prepared for <strong>Wollongong</strong> <strong>City</strong> <strong>Council</strong><br />
6 Geotechnical and Slope Instability Investigations<br />
The <strong>Wollongong</strong> LGA is known to be an area of many geotechnical hazards with numerous<br />
slope and cliff instability issues being documented in recent years. As a result <strong>Council</strong> has<br />
well established planning requirements for individual development applications that require<br />
the completion of site specific geotechnical assessments. As part of the coastal processes<br />
and hazard investigations, Cardno Lawson Treloar engaged GHD Geotechnics to<br />
undertaken a slope and cliff stability assessment of the <strong>Wollongong</strong> LGA as it relates to<br />
coastal processes.<br />
The main objective of this assessment was to establish a framework or set of criteria within<br />
which current, or potential future, geotechnical hazards are deemed to be influenced by<br />
coastal processes for planning purposes. This resulted in the definition of a Coastal-<br />
Influenced Geotechnical Hazard Zone, defined as follows:<br />
“The Coastal-Influenced Geotechnical Hazard Zone includes areas where coastal<br />
processes (including climate change) will directly influence geotechnical hazards for the<br />
defined study time period to 2100. Geotechnical assessments of proposed or future<br />
development in accordance with <strong>Wollongong</strong> <strong>City</strong> <strong>Council</strong>’s Development Control Plan<br />
requirements should include specific assessment of coastal processes if located within this<br />
Zone.” – GHD (2010), Appendix F.<br />
To undertake this assessment, Cardno Lawson Treloar provided GHD with a range of<br />
coastal processes, hazard and climate change information (as described in this report)<br />
including:<br />
• Sea Level Rise Predictions (Section 3.7.1)<br />
• Rainfall Predictions (Section 4.2.6)<br />
• Erosion Hazard Extents (Section 8.1)<br />
• Cliff Wave Run-up Levels (Section 5.3)<br />
• Wave Inundation Extents (Section 8.2)<br />
GHD’s full report is provided in Appendix F. Interactions between the determination of<br />
coastal hazards and the Coastal-Influenced Geotechnical Hazard Zone are discussed in<br />
the relevant sections of that report.<br />
30 June 2010 Cardno Lawson Treloar Pty Ltd Page 39<br />
H:\Doc\2010\<strong>Report</strong>s.2010\Rep2564v2.Doc
<strong>Wollongong</strong> <strong>City</strong> <strong>Council</strong> Coastal Zone Study<br />
Prepared for <strong>Wollongong</strong> <strong>City</strong> <strong>Council</strong><br />
7 Coastal Features – Values and Significance<br />
7.1 Overview<br />
This section of the report provides some information on the values and significance of the<br />
coastal zone of the <strong>Wollongong</strong> LGA in terms of:<br />
• Ecological attributes (Section 7.3),<br />
• Estuary character (Section 7.4),<br />
• Land use and land tenure (Section 7.5),<br />
• Recreational amenity (Section 7.6.1),<br />
• Cultural heritage features (Sections 7.6.2 and 7.6.3), and<br />
• Economic value (Section 7.7).<br />
Some targeted consultation was also undertaken with community representatives to inform<br />
this discussion (Section 7.2).<br />
The information provided in this section of the report has been used to generate a<br />
preliminary list of management issues for the study zone (Section 7.9) and to inform the<br />
coastal risk assessment (Section 8).<br />
7.2 Consultation<br />
Direct stakeholder consultation was undertaken with a range of different stakeholders in<br />
order to:<br />
• Gain an appreciation as to how the coastal zone is valued by the community and<br />
other stakeholders;<br />
• To obtain any data or other information that might inform the study; and<br />
• To identify any existing management issues.<br />
Information was also obtained through a review of the available data from a range of<br />
stakeholder surveys undertaken by <strong>Council</strong> in recent years.<br />
The following organisations and individuals were contacted in relation to the project:<br />
• The eight neighbourhood’s established by <strong>Council</strong> for consultation purposes;<br />
• Representatives from <strong>Council</strong>’s various departments including –<br />
− Professional lifeguards,<br />
− Geotechnical services,<br />
− Heritage,<br />
− Capital works,<br />
− Flood management,<br />
− Urban design,<br />
− Landscape architecture,<br />
− Strategic planning, and<br />
− Operations and maintenance crew;<br />
• Illawarra Business Chamber*;<br />
• Tourism <strong>Wollongong</strong>;<br />
• Illawarra Local Aboriginal Land <strong>Council</strong> (LALC);<br />
• Land and Property Management Authority (LPMA); and<br />
30 June 2010 Cardno Lawson Treloar Pty Ltd Page 40<br />
H:\Doc\2010\<strong>Report</strong>s.2010\Rep2564v2.Doc
<strong>Wollongong</strong> <strong>City</strong> <strong>Council</strong> Coastal Zone Study<br />
Prepared for <strong>Wollongong</strong> <strong>City</strong> <strong>Council</strong><br />
• A number of Surf Life Saving Clubs along the coastline including:<br />
− Austinmer*,<br />
− Bellambi*,<br />
− Bulli,<br />
− Coalcliff*,<br />
− Coledale*,<br />
− Corrimal*,<br />
− Fairy Meadow*,<br />
− Helensburgh/Stanwell Park*,<br />
− North <strong>Wollongong</strong>*,<br />
− Port Kembla*,<br />
− Sandon Point*,<br />
− Scarborough/Wombarra*,<br />
− Thirroul*,<br />
− Towradgi*,<br />
− Windang*,<br />
− <strong>Wollongong</strong> <strong>City</strong>, and<br />
− Woonona*.<br />
A series of meetings were held over the 3 to 4 December 2009 with those stakeholders<br />
who responded to CLT’s request for consultation. An effort was made to accommodate<br />
consultation via telephone where organisations were unable to provide representation on<br />
the days scheduled for meetings. Those stakeholders with whom the study team was<br />
unable to schedule an interview are identified with an asterisk (*) in the list above (for<br />
example, 17 SLSCs were contacted for consultation, but only 2 participated in the<br />
consultation).<br />
The information on management issues provided by each of the respondents has been<br />
tabulated in Appendix G. In addition, reference has been made in the report text where<br />
relevant.<br />
7.3 Ecological Features<br />
7.3.1 Flora and Fauna<br />
The coastal zone covers a variety of different environment types, including the marine,<br />
intertidal, estuarine and terrestrial environments. This results in a very high diversity of<br />
plant and animal life. This section provides an overview of the ecological features of the<br />
study area, focussing on those features or species that are afforded some level of<br />
protection under the various planning instruments.<br />
The key ecological attributes of the study area for which mapping was available have been<br />
presented in Figures 7.1A, 7.1B and 7.1C.<br />
The <strong>NSW</strong> Threatened Species Conservation (TSC) Act 1995, <strong>NSW</strong> Fisheries Management<br />
(FM) Act 1994 and Commonwealth Environment Protection and Biodiversity Conservation<br />
(EPBC) Act 1999 provide protection for species, populations, habitat and communities that<br />
are identified as being threatened.<br />
30 June 2010 Cardno Lawson Treloar Pty Ltd Page 41<br />
H:\Doc\2010\<strong>Report</strong>s.2010\Rep2564v2.Doc
<strong>Wollongong</strong> <strong>City</strong> <strong>Council</strong> Coastal Zone Study<br />
Prepared for <strong>Wollongong</strong> <strong>City</strong> <strong>Council</strong><br />
A review of mapping prepared by NPWS (2003) and information obtained from the NPWS<br />
Wildlife Atlas (searched October 2009) indicate that there are a number of Endangered<br />
Ecological Communities (EECs) located within the study area, including:<br />
• Coastal Saltmarsh,<br />
• Freshwater Wetlands in the Sydney Basin Bioregion,<br />
• Freshwater Wetlands on Coastal Floodplains,<br />
• Swamp Oak Floodplain Forest,<br />
• Swamp Schlerophyll Forest on Coastal Floodplains,<br />
• Littoral Rainforest,<br />
• Illawarra Subtropical Rainforest,<br />
• Bangalay Sand Forest,<br />
• Illawarra Coastal Grassy Woodlands,<br />
• Southern Sydney Sheltered Forest, and<br />
• Themeda Grasslands.<br />
These EECs have been mapped in Figures 7.1A, 7.1B and 7.1C. Littoral Rainforest is<br />
also listed under the EPBC Act as an EEC, with the name Littoral Rainforest and Coastal<br />
Vine Thicket of Eastern Australia.<br />
It is understood that the NPWS (2003) mapping was prepared through interpretation of<br />
aerial photography with some limited ground-truthing. The mapping has a lower level of<br />
accuracy for coastal areas and smaller vegetation patches may not have been mapped.<br />
However, it is considered useful for showing the extent of EECs within the study area.<br />
Vegetation may also be protected under State Environment Planning Policies (SEPP),<br />
including:<br />
• SEPP 14 Coastal Wetlands – There are some located within the study area, as<br />
shown in Figures 7.1A, 7.1B and 7.1C;<br />
• SEPP 26 Littoral Rainforest – None mapped for the study area, and<br />
• SEPP 44 Koala Habitat Protection - SEPP 44 provides for the protection of koala<br />
feed tree species. <strong>Wollongong</strong> LGA is listed under Schedule 1 of the SEPP.<br />
There are a number of species recorded in the LGA that are threatened species as listed<br />
under the TSC Act, FM Act and/or EPBC Act. A list of the threatened fauna species is<br />
provided in Table 7.1 and a list of threatened flora species is provided in Table 7.2.<br />
It is noted that the species records listed in Table 7.1 and Table 7.2 are for the entire LGA<br />
and therefore some may not occur in the specific study area, which comprises only a<br />
portion of the <strong>Wollongong</strong> LGA. In addition, only those species identified under the EPBC<br />
Act reporting tool as ‘likely’ or ‘known’ to occur in the search area have been included.<br />
Those identified as ‘may occur’ have not been listed herein.<br />
30 June 2010 Cardno Lawson Treloar Pty Ltd Page 42<br />
H:\Doc\2010\<strong>Report</strong>s.2010\Rep2564v2.Doc
<strong>Wollongong</strong> <strong>City</strong> <strong>Council</strong> Coastal Zone Study<br />
Prepared for <strong>Wollongong</strong> <strong>City</strong> <strong>Council</strong><br />
Table 7.1: Threatened Fauna Species<br />
Species Name<br />
30 June 2010 Cardno Lawson Treloar Pty Ltd Page 43<br />
H:\Doc\2010\<strong>Report</strong>s.2010\Rep2564v2.Doc<br />
Common Name<br />
TSC<br />
Act<br />
Listing<br />
FM Act<br />
Listing<br />
EPBC<br />
Act<br />
Listing<br />
Amphibians<br />
Litoria aurea Green & Golden Bell Frog E1 V<br />
Litoria littlejohni Littlejohn’s Tree Frog V V<br />
Heleioporus australiacus Giant Burrowing Frog V V<br />
Pseudophryne australis Red-crowned Toadlet V<br />
Avifauna<br />
Hieraaetus morphnoides Little Eagle V<br />
Lophoictinia isura Square-tailed Kite V<br />
Pandion haliaetus Osprey V<br />
Oxyura australis Blue-billed Duck V<br />
Sticonetta naevosa Freckled Duck V<br />
Botaurus poiciloptilus Australasian Bittern V<br />
Ixobrychus flavicollis Black Bittern V<br />
Esacus neglectus Beach Stone-curlew E4A<br />
Callocephalon fimbriatum Gang-gang Cockatoo V<br />
Calyptorhynchus lathami Glossy Black-cockatoo V<br />
Coracina lineate Barred Cuckoo-shrike V<br />
Charadrius leschenaultia Greater Sand-plover V<br />
Charadrius mongolus Lesser Sand-plover V<br />
Thinornis rubricollis Hooded Plover E4A<br />
Ephippiorhynchus asiaticus Black-necked Stork E1<br />
Ptilinopus magnificus Wompoo Fruit-dove V<br />
Ptilinopus regina Rose-crowned Fruit-dove V<br />
Ptilinopus suberbus Superb Fruit-dove V<br />
Dasyornis brackypterus Eastern Bristlebird E1<br />
Diomedea exulans Wandering Albatross E1<br />
Phoebetria fusca Sooty Albatross V<br />
Thalassarche melophris Black-browed Albatross V<br />
Haematopus fuliginosus Sooty Osytercatcher V<br />
Haematopus longirostris Pied Oystercatcher E1<br />
Sterna albifrons Little Tern E1<br />
Sterna fuscata Sooty Tern V<br />
Graniella picta Painted Honeyeater V<br />
Xanthomyza phrygia Regent Honeyeater E1 E<br />
Daphoenositta chrysoptera Varied Sittella V<br />
Pachycephala olivacea Olive Whistler V<br />
Petroica boodang Scarlet Robin V<br />
Petroica phoenicea Flame Robin V<br />
Petroica rodinogaster Pink Robin V<br />
Macronectes giganteus Southern Giant Petrel E1 E<br />
Pterodroma leucoptera Gould’s Petrel<br />
V<br />
leucoptera<br />
Puffinus assimilis Little Shearwater V<br />
Puffinus carneipes Flesh-footed Shearwater V<br />
Glossopsitta pusilla Little Lorikeet V<br />
Lathamus discolor Swift Parrot E1 E<br />
Pezoporus wallicus wallicus Eastern Ground Parrot V<br />
Polytelis anthopeplus<br />
Regent Parrot (eastern E1<br />
monarchoides<br />
subspecies)<br />
Polytelis swainsonii Superb Parrot V<br />
Calidris alba Sanderling V<br />
Calidris tenuirostris Great Knot V
<strong>Wollongong</strong> <strong>City</strong> <strong>Council</strong> Coastal Zone Study<br />
Prepared for <strong>Wollongong</strong> <strong>City</strong> <strong>Council</strong><br />
Species Name<br />
Common Name<br />
TSC<br />
Act<br />
Listing<br />
FM Act<br />
Listing<br />
EPBC<br />
Act<br />
Listing<br />
Limicola falcinellus Broad-billed Sandpiper V<br />
Limosa limosa Black-tailed Godwit V<br />
Xenus cinereus Terek Sandpiper V<br />
Ninox connivens Barking Owl V<br />
Ninox strenua Powerful Owl V<br />
Tyto novaehollandiae Masked Owl V<br />
Tyto tenebricosa Sooty Owl V<br />
Mammals<br />
Megaptera novaeangliae Humpback Whale V V<br />
Eubalaena australis Southern Right Whale E<br />
Cercartetus nanus Eastern Pygmy-possum V<br />
Dasyurus maculatus Spotted-tailed Quoll V E (SE<br />
mainland<br />
population)<br />
Dasyurus viverrinus Eastern Quoll E1<br />
Saccolaimus flaviventris Yellow-bellied Sheathtailbat<br />
V<br />
Petrogale penicillata Brush-tailed Rock-wallaby E1 V<br />
Mormopterus norfolkensis Eastern Freetail-bat V<br />
Arctocephalus pusillus<br />
Australian Fur-seal<br />
V<br />
doriferus<br />
Isoodon obesulus obesulus Southern Brown Bandicoot E1<br />
E<br />
(eastern)<br />
Petaurus norlcensis Squirrel Glider V<br />
Phascolarctos cinereus Koala V<br />
Physeter macrocephalus Sperm Whale V<br />
Pteropus poliocephalus Grey-headed Flying-fox V V<br />
Chalinolobus dwyeri Large-eared Pied Bat V V<br />
Falsistrellus tasmaniensis Eastern False Pipistrelle V<br />
Miniopterus schreibersii Eastern Bentwing-bat<br />
V<br />
oceanensis<br />
Myotis macropus Southern Myotis V<br />
Soteanax ruepellii Greater Broad-nosed Bat V<br />
Reptiles<br />
Hoplocephalus bungaroides Broad-headed Snake E1 V<br />
Varanus rosenbergi Rosenberg’s Goanna V<br />
Caretta caretta Loggerhead Turtle E<br />
Chelonia mydas Green Turtle V<br />
Matator depressus Flatback Turtle V<br />
Fish<br />
Phyllopteryx taeniolatus Weedy Sea Dragon FP<br />
Maccullochella macquariensis Trout cod FE E<br />
Macquaria australasica Macquarie Perch FV E<br />
Paraplesiops bleekeri Bleeker’s Devil Fish FP<br />
Epinephelus lanceolatus Queensland Groper FP<br />
Prototroctes marena Australian Grayling V<br />
*V = Vulnerable, E/E1 = Endangered, CE/E4A = Critically Endangered, FP = Fish Protected, FV = Fish<br />
Vulnerable, FE = Fish Endangered<br />
30 June 2010 Cardno Lawson Treloar Pty Ltd Page 44<br />
H:\Doc\2010\<strong>Report</strong>s.2010\Rep2564v2.Doc
<strong>Wollongong</strong> <strong>City</strong> <strong>Council</strong> Coastal Zone Study<br />
Prepared for <strong>Wollongong</strong> <strong>City</strong> <strong>Council</strong><br />
Table 7.2: Threatened Flora Species<br />
Species Name<br />
Common Name<br />
TSC Act<br />
Listing<br />
EPBC<br />
Act<br />
Listing<br />
Cynanchum elegans White-flowered Wax Plant E1 E<br />
Astrotricha crassifolia Thick-leaf Star-hair V V<br />
Irenepharsus trypherus Illawarra Irene E1 E<br />
Callitris endlicheri 1<br />
Black Cypress Pine, Woronora E2<br />
Plateau population<br />
Arthropteris palisotii Lesser Creeping Fern E1<br />
Epacris purpurascens var.<br />
V<br />
purpurascens<br />
Leucopogon exolasius Woronora Beard-heath V V<br />
Senna acclinis Rainforest Cassia E1<br />
Chorizema parviflorum 1<br />
Chorizema parviflorum Benth. in<br />
the <strong>Wollongong</strong> and<br />
Shellharbour LGAs<br />
E2<br />
Lespedeza juncea subsp. Sericea 1<br />
Lespedeza juncea subsp.<br />
E2<br />
sericea in the <strong>Wollongong</strong> LGA<br />
Pultenaea aristata Prickly Bush-pea V V<br />
Acacia baueri subsp. Aspera<br />
V<br />
Acacia bynoeana<br />
Bynoe's Wattle<br />
Haloragis exalata subsp. exalata<br />
V<br />
var. laevis<br />
Haloragis exalata subsp. exalata<br />
V<br />
var. exalata<br />
Prostanthera marifolia Seaforth Mintbush E4A<br />
Prostanthera densa Villous Mintbush V<br />
Daphnandra sp. C Illawarra Illawarra Socketwood E1 E<br />
Callistemon linearifolius Netted Bottle Brush V<br />
Melaleuca deanei Deane's Paperbark V V<br />
Syzygium paniculatum Magenta Lilly Pilly E1<br />
Genoplesium baueri Bauer's Midge Orchid V<br />
Pterostylis gibbosa Illawarra Greenhood E1<br />
Grevillea parviflora Small-flower Grevillea V V<br />
Persoonia acerosa Needle Geebung V<br />
Pomaderris adnata Sublime Point Pomaderris E1<br />
Pomaderris brunnea Brown Pomaderris V V<br />
Zieria granulata Illawarra Zieria E1 E<br />
Solanum celatum<br />
E1<br />
Caladenia tessellate Thick-lipped Spider-Orchid V<br />
Eucalyptus camfieldii Camfield’s Stringybark V<br />
Pterostylis gibbosa Illawarra Greenhood E<br />
Thelymitra sp. Kangaloon Kangaloon Sun-orchid CE<br />
Thesium australe Austral Toadflax V<br />
1 Endangered population under the TSC Act.<br />
In addition to threatened species, there is also a number of migratory marine species that<br />
pass through the <strong>Wollongong</strong> LGA that are afforded some degree of protection under the<br />
EPBC Act, including:<br />
• six species of whales and dolphins,<br />
• four marine turtles,<br />
• two seals,<br />
• two sharks, and<br />
• fifty-three birds.<br />
30 June 2010 Cardno Lawson Treloar Pty Ltd Page 45<br />
H:\Doc\2010\<strong>Report</strong>s.2010\Rep2564v2.Doc
<strong>Wollongong</strong> <strong>City</strong> <strong>Council</strong> Coastal Zone Study<br />
Prepared for <strong>Wollongong</strong> <strong>City</strong> <strong>Council</strong><br />
7.3.2 Coastal Vegetation Condition Assessment<br />
A series of aerial photographs provided by WCC and DECCW from 1977, 1987, 1999 and<br />
2006 were compared to investigate observable changes in vegetation in the coastal areas<br />
of the <strong>Wollongong</strong> LGA over a time period of thirty years. Both dune vegetation and<br />
estuarine vegetation were examined.<br />
Areas of vegetation for 1977, 1987, 1999 and 2006, respectively, were digitised from the<br />
aerial photographs and input into a GIS database. For each digitised area of vegetation,<br />
the vegetated cover as a proportion of the land area was calculated to give a value for<br />
percentage cover. These results are presented in graphical format in Figure 7.2. They<br />
have also been tabulated below in Table 7.3. Note that “total area” refers to the total<br />
digitised area of vegetation for each year and “equivalent area of 100% cover” refers to the<br />
total area of vegetation that would exist if all vegetation was at 100% cover (calculated by<br />
multiplying each discrete area of vegetation by its percent cover and summing the results<br />
for each year). A value of average percent cover has also been included in Table 7.3.<br />
The areas in Table 7.3 represent a net change in vegetation. In addition, the quality of<br />
aerial photographs was variable from year to year and the data has not been groundtruthed.<br />
The accuracy of the numbers below is therefore somewhat limited.<br />
Table 7.3: Changes in Area & Percent Cover of Dune & Estuarine Vegetation 1977-2006<br />
Year of Aerial Photograph 1977 1987 1999 2006<br />
Dune Vegetation<br />
Total Area (ha) 146.1 109.5 236.4 76.7<br />
Equivalent Area of 100% Cover (ha) 38.6 30.5 82.1 27.9<br />
Average Percent Cover (%) 22.8 38.0 26.4 38.5<br />
Estuarine Vegetation<br />
Total Area (ha) 290.2 68.2 290.2 68.2<br />
Equivalent Area of 100% Cover (ha) 134.7 24.2 134.7 24.2<br />
Average Percent Cover (%) 47.5 38.1 47.5 38.1<br />
It was found that over the 30 years period, the total observed area of dune vegetation has<br />
increased whilst the total observed area of estuarine vegetation has slightly decreased.<br />
The area of dune vegetation has most likely increased as a result of dune revegetation<br />
works, for example, along Perkins Beach between Port Kembla Surf Life Saving Club in the<br />
north and the entrance of Lake Illawarra in the south. In contrast, the main areas of<br />
decreased estuarine vegetation were noted around the facilities at Port Kembla, and this<br />
decline is evidently due to continuing port and industrial expansion over the 30 years time<br />
frame. Figures 7.3A to C, 7.4A to C, 7.5A to C and 7.6A to C show graphically the<br />
changes in spatial distribution and percent cover of dune and estuarine vegetation across<br />
the 30 years time frame.<br />
The presence of threatening processes such as weed species (e.g. Bitou Bush) in areas of<br />
dune vegetation presents an issue for management. A number of management issues<br />
relating to vegetation within the coastal zone are detailed in Section 7.8.<br />
In an effort to maintain and enhance vegetation in the coastal zone, restoration of both<br />
estuarine and dune vegetation has been carried out by or in partnership with <strong>Wollongong</strong><br />
<strong>City</strong> <strong>Council</strong>. Figures 7.7A to C show the spatial extent of vegetation restoration works<br />
30 June 2010 Cardno Lawson Treloar Pty Ltd Page 46<br />
H:\Doc\2010\<strong>Report</strong>s.2010\Rep2564v2.Doc
<strong>Wollongong</strong> <strong>City</strong> <strong>Council</strong> Coastal Zone Study<br />
Prepared for <strong>Wollongong</strong> <strong>City</strong> <strong>Council</strong><br />
that were undertaken between 2005 and 2009. The majority of these restoration works<br />
(approximately 80%) have taken place within the coastal zone.<br />
7.4 Estuary Condition Assessment<br />
There are a number of estuaries located within the study, many of which are small coastal<br />
creeks. The location of all the estuaries in the study area is shown in Figures 7.1A to C.<br />
With the exception of Tom Thumb Lagoon and Lake Illawarra (which has a trained<br />
entrance), all the creeks within the study area are classified as Intermittently Closed and<br />
Open Lakes and Lagoons, or ICOLLs.<br />
ICOLLs are coastal lagoons that occur in micro-tidal, wave dominated coastal<br />
environments where strong seasonal changes of littoral transport and/or rainfall are<br />
experienced. They are closed to the ocean due to the formation of a sand bar at the inlet<br />
entrance (that is, the entrance berm) when the stream flows are low and/or longshore<br />
transport of sand is high. ICOLLs undergo only periodic exchange with the ocean, usually<br />
following catchment flood events when the marine sands that accumulate in and block the<br />
entrance to the sea are flushed out. Over time the sand re-accumulates in the entrance to<br />
reform the entrance berm.<br />
ICOLLs may spend long durations isolated from the ocean, during which time they are<br />
subjected to freshwater catchment inflows and mixing through wind forcing. ICOLLs have<br />
unique ecological characteristics that are strongly dictated by the behaviour of the entrance<br />
berm (that is, the frequency with which the entrance berm breaks-out). In some cases the<br />
entrance berm is mechanically breached (as in the cases of the four lagoons considered in<br />
this study) to avoid flooding of low lying areas when the estuarine water levels rise due to<br />
catchment flooding.<br />
In broader terms, estuaries in <strong>NSW</strong> can be classified into three general categories based<br />
on their entrance conditions (after Roy et al., 2001, and Roy, 1984):<br />
• Drowned river valley estuaries,<br />
• Barrier estuaries, and<br />
• Saline coastal lakes.<br />
ICOLLs fall into the ‘saline coastal lakes’ category, whereas Lake Illawarra would be a<br />
barrier estuary.<br />
Shallow mud basins and muddy fluvial deposits are the dominant sedimentary<br />
environments in ICOLLs. Fluvial input is characteristically very small. Under most<br />
conditions, lake waters are saline to brackish, but non-tidal. Winds may cause mixing and<br />
some transport in larger ICOLLs.<br />
The dominant water level forcing phenomenon within an ICOLL is highly dependant on the<br />
state of the lagoon entrance. In general, there are three hydrodynamic ‘states’ that could<br />
operate within an ICOLL at any one time:<br />
• The closed state: Lagoon water levels are influenced primarily by catchment<br />
inflows and groundwater flows during these periods. Being isolated from the ocean<br />
tides, the water level within the lagoon is controlled by the berm height and the<br />
30 June 2010 Cardno Lawson Treloar Pty Ltd Page 47<br />
H:\Doc\2010\<strong>Report</strong>s.2010\Rep2564v2.Doc
<strong>Wollongong</strong> <strong>City</strong> <strong>Council</strong> Coastal Zone Study<br />
Prepared for <strong>Wollongong</strong> <strong>City</strong> <strong>Council</strong><br />
water balance between catchment inflows, occasional wave overtopping from the<br />
ocean and evaporative losses. Salinities in the lagoon may vary, depending upon<br />
the dominant forcing process within this water balance, and often vary throughout<br />
the lagoon at any one time. Salinities may range from fresh (for example, near<br />
creek upstream ends), to saline (for example, where wave overtopping of the berm<br />
occurs), or even hypersaline (for example, when evaporative losses are very high).<br />
• The open state (freshwater regime): Lagoon flooding may occur during periods<br />
of heavy rainfall and this causes the lagoon water level to rise. The rate of rise of<br />
lagoon water level will depend upon the volume and rate of catchment inflows into<br />
the lagoon, and the volume of the lagoon. While in this state, high volumes of<br />
catchment runoff flow into the lagoon, flooding the lagoon basin before breaching<br />
the entrance berm and draining to the sea. During this time, the rate of rise of<br />
lagoon water levels during the flood event will also depend upon dimensions of the<br />
entrance channel. There is no seawater penetration due to the high velocity flows<br />
discharging through the entrance.<br />
• The open state (seawater regime): Ocean waters may penetrate the estuary<br />
following abatement of flooding due to the tidal flows. When this is the case, the<br />
tidal levels will dominate the water levels within the lagoon basin. The extent of<br />
penetration of ocean waters at these times depends on the condition of the<br />
entrance channel, with the tidal signal being attenuated through narrow entrance<br />
channels.<br />
A brief overview of the key features and general condition (or estuarine ‘health’) of each of<br />
the larger estuaries is provided in Table 7.4.<br />
An assessment of the potential impacts of climate change on estuarine biodiversity has<br />
been undertaken for all fourteen of <strong>Wollongong</strong>’s estuaries by Cardno (2009). That study<br />
considered the potential impacts on entrance behaviour, average estuarine water levels,<br />
water-balance and water quality based on a desktop assessment of available information.<br />
This assessment of physical processes was then used to provide an overview as to how<br />
estuarine ecology might be affected, focussing on estuarine vegetation.<br />
30 June 2010 Cardno Lawson Treloar Pty Ltd Page 48<br />
H:\Doc\2010\<strong>Report</strong>s.2010\Rep2564v2.Doc
<strong>Wollongong</strong> <strong>City</strong> <strong>Council</strong> Coastal Zone Study<br />
Prepared for <strong>Wollongong</strong> <strong>City</strong> <strong>Council</strong><br />
Table 7.4: Estuary Condition Assessment<br />
Catchment<br />
Area (ha; after<br />
NLWRA)<br />
Estuary<br />
Character<br />
(after NLWRA)<br />
Catchment<br />
Land Use (after<br />
<strong>Wollongong</strong><br />
LEP)<br />
Waterway Use<br />
Water Quality<br />
(after WCC,<br />
2007) ±<br />
Acid Sulfate<br />
Soils (after<br />
Geoscience<br />
Australia)<br />
Tributaries<br />
(after <strong>Council</strong><br />
GIS)<br />
Entrance<br />
Management<br />
Vegetation<br />
Types<br />
General<br />
Estuarine<br />
Condition<br />
(after NLWRA)<br />
Hewitts Creek<br />
380* Wavedominated<br />
Residential<br />
Railway<br />
Roads<br />
Recreation and Open<br />
Space<br />
Environmental Protection<br />
Paddling<br />
Issues: Low Dissolved Oxygen (DO),<br />
nitrogenous nutrients, some minor heavy<br />
metal contamination, faecal contamination.<br />
Probability of<br />
occurrence: Low – High;<br />
Disturbed Terrain<br />
Hewitts Creek<br />
Unmanaged,<br />
often closed<br />
Floodplain Forest<br />
Wetlands<br />
Good<br />
Tramway Creek<br />
53* Wavedominated<br />
Residential<br />
Industrial and Extractive<br />
Industrial<br />
Railway<br />
Roads<br />
Recreation<br />
Environmental Protection<br />
Paddling<br />
Issues: Low DO, nutrients, some minor<br />
heavy metal contamination<br />
Probability of<br />
occurrence: Low;<br />
Disturbed Terrain<br />
Tramway Creek &<br />
Woodlands Creek<br />
Unmanaged,<br />
often closed<br />
Floodplain Forest<br />
Wetlands<br />
Good<br />
Bellambi Gully<br />
427 Wavedominated<br />
Residential<br />
Business<br />
Industrial and Extractive<br />
Industrial<br />
Recreation<br />
Environmental Protection<br />
- Issues: High pH, low DO, suspended<br />
solids, very high nutrients, very high heavy<br />
metal concentrations, faecal contamination<br />
Probability of<br />
occurrence: Low – High;<br />
Disturbed Terrain<br />
Bellambi Gully Creek &<br />
Farrahars Creek<br />
Unmanaged,<br />
often closed<br />
Coastal Dune<br />
Vegetation<br />
Floodplain Forest<br />
Wetlands<br />
Mangroves<br />
Extensively<br />
Modified<br />
Bellambi Lagoon<br />
246 Wavedominated<br />
Residential<br />
Commercial<br />
Industrial & Extractive<br />
Industrial<br />
Railway<br />
Roads<br />
Recreation<br />
Environmental Protection<br />
Paddling<br />
Issues: Occasionally elevated pH, low DO,<br />
some high concentrations of suspended<br />
solids, high nutrients, some minor heavy<br />
metal contamination, faecal contamination<br />
Probability of<br />
occurrence: Low – High;<br />
Disturbed Terrain<br />
Cabbage Tree Creek<br />
Unmanaged,<br />
often closed<br />
Coastal Dune<br />
Vegetation<br />
Wetlands<br />
Saltmarsh<br />
Mangroves<br />
Seagrasses<br />
Extensively<br />
Modified<br />
Towradgi Creek<br />
750* Wavedominated<br />
Residential<br />
Commercial<br />
Light Industrial<br />
Railway<br />
Roads<br />
Recreation and Open<br />
Space<br />
Environmental Protection<br />
National Park<br />
Paddling &<br />
Swimming<br />
Small Watercraft<br />
Issues: Low DO, nutrients, some minor<br />
heavy metal contamination<br />
Probability of<br />
occurrence: Low – High;<br />
Disturbed Terrain<br />
Towradgi Creek<br />
Managed for<br />
flood<br />
mitigation<br />
Floodplain Forest<br />
Wetlands<br />
Mangroves<br />
Extensively<br />
Modified<br />
Fairy Creek<br />
2076* Wavedominated<br />
Residential<br />
Commercial<br />
Paddling &<br />
Swimming<br />
Issues: Occasional high concentrations of<br />
suspended solids, high nutrient levels,<br />
Probability of<br />
occurrence: Low – High;<br />
Fairy Creek & Cabbage<br />
Tree Creek<br />
Managed for<br />
flood<br />
Floodplain Forest<br />
Wetlands<br />
Modified<br />
30 June 2010 Cardno Lawson Treloar Pty Ltd Page 49<br />
H:\Doc\2010\<strong>Report</strong>s.2010\Rep2564v2.Doc
<strong>Wollongong</strong> <strong>City</strong> <strong>Council</strong> Coastal Zone Study<br />
Prepared for <strong>Wollongong</strong> <strong>City</strong> <strong>Council</strong><br />
Catchment<br />
Area (ha; after<br />
NLWRA)<br />
Lake Illawarra<br />
Estuary<br />
Character<br />
(after NLWRA)<br />
27,000 Wavedominated<br />
Catchment<br />
Land Use (after<br />
<strong>Wollongong</strong><br />
LEP)<br />
Railway<br />
Roads<br />
Recreation<br />
Environmental Protection<br />
National Park<br />
Residential<br />
Business<br />
Industrial and Extractive<br />
Industrial<br />
Recreation<br />
Environmental Protection<br />
National Park<br />
Reservation<br />
Waterway Use<br />
Small Watercraft<br />
Paddling &<br />
Swimming<br />
Small Watercraft<br />
Boating &<br />
Waterskiing<br />
Commercial &<br />
Recreational Fishing<br />
Water Quality<br />
(after WCC,<br />
2007) ±<br />
some heavy metal contamination, faecal<br />
contamination<br />
Issues: High concentrations of suspended<br />
solids at times, high nutrient levels, heavy<br />
metal contamination (after NLWRA).<br />
Acid Sulfate<br />
Soils (after<br />
Geoscience<br />
Australia)<br />
Tributaries<br />
(after <strong>Council</strong><br />
GIS)<br />
Entrance<br />
Management<br />
Disturbed Terrain mitigation<br />
Probability of<br />
occurrence: Mostly<br />
High;<br />
Disturbed Terrain<br />
Kully Bay Creek<br />
Hospital Creek<br />
Minnegang Creek<br />
Budjong Creek<br />
Hooka Creek<br />
Mullet Creek<br />
Brooks Creek<br />
Barons Gully<br />
Boomberry Gully<br />
Pithungnar Gully<br />
Tallawarra Gully<br />
Yallah Gully<br />
Duck Creek<br />
(tributaries within<br />
<strong>Wollongong</strong> LGA only)<br />
Trained<br />
Vegetation<br />
Types<br />
Coastal Dune<br />
Vegetation<br />
Floodplain Forest<br />
Wetlands<br />
Saltmarsh<br />
Seagrass (extensive)<br />
NLWRA = National Land and Water Resources Audit (http://www.nlwra.gov.au/national-land-and-water-resources-audit/estuarine-coastal-marine) *After Cardno (2005).<br />
± It is noted that WCC (2007) typically reports results for each creek based on samples collected upstream and therefore these results are only indicative of the water quality of the estuarine portion of the creek.<br />
General<br />
Estuarine<br />
Condition<br />
(after NLWRA)<br />
Extensively<br />
Modified<br />
30 June 2010 Cardno Lawson Treloar Pty Ltd Page 50<br />
H:\Doc\2010\<strong>Report</strong>s.2010\Rep2564v2.Doc
<strong>Wollongong</strong> <strong>City</strong> <strong>Council</strong> Coastal Zone Study<br />
Prepared for <strong>Wollongong</strong> <strong>City</strong> <strong>Council</strong><br />
7.5 Land Use and Land Tenure<br />
7.5.1 Land Use<br />
Historical Aerial Photograph Analysis<br />
A series of aerial photographs provided by WCC and DECCW from 1977, 1987, 1999 and<br />
2006 were compared to investigate observable changes in land use in the <strong>Wollongong</strong> LGA<br />
over this time period. The 1977, 1987 and 1999 aerials are not available in a format that<br />
may be presented herein.<br />
Up to 1977<br />
Residential development was prevalent at this time, with the majority of the suburbs in the<br />
study area having already been developed by 1977. Additionally, commercial and<br />
industrial development was noticeable. Industrial development was primarily centred<br />
around the port of Port Kembla.<br />
1977-1987<br />
Industrial development continued with some parts of the Port expanding and the addition of<br />
some industrial buildings in Warrawong. Vegetation loss due to port expansion is also<br />
noticeable over this time frame. Industrial development is also noticeable in Unanderra<br />
during this time. Commercial development in Thirroul and <strong>Wollongong</strong>, for example, the<br />
<strong>Wollongong</strong> Mall (Crown Street Mall) had been built by this stage. Warrawong also<br />
experienced increases in commercial development with the Westfield shoppingtown being<br />
built.<br />
Sand extraction was observed to have taken place in the vicinity of the Korrungulla<br />
wetland.<br />
1987-1999<br />
Further increases in industrial development in Unanderra were noticeable during this<br />
period. Some buildings associated with the Coledale mine were demolished as the mine<br />
closed in 1991. Commercial land use changes took place in Kembla Grange with the<br />
development of equestrian facilities around Pharlap Avenue. Further commercial<br />
development in the vicinity of the Westfield shopping centre at Warrawong was also<br />
noticeable (the shopping centre opened in 1988). Some changes in residential land use<br />
are noticeable in Kanahooka, where an over-55s residential village was developed. The<br />
nearby leisure centre along Kanahooka Road opened during this time. Increases in<br />
residential development in Windang were noticeable during this period.<br />
1999-2006<br />
During this time period, fewer land use changes were observed within the study area.<br />
However, some notable changes include residential development at Sandon Point and the<br />
construction of the Sea Cliff Bridge.<br />
30 June 2010 Cardno Lawson Treloar Pty Ltd Page 51<br />
H:\Doc\2010\<strong>Report</strong>s.2010\Rep2564v2.Doc
<strong>Wollongong</strong> <strong>City</strong> <strong>Council</strong> Coastal Zone Study<br />
Prepared for <strong>Wollongong</strong> <strong>City</strong> <strong>Council</strong><br />
Local Environmental Plan<br />
The <strong>Wollongong</strong> Local Environmental Plan (LEP) 2009 is the principal local planning<br />
instrument for the <strong>Wollongong</strong> LGA. As required by the <strong>NSW</strong> Department of Planning, this<br />
document was prepared in accordance with the Standard Instrument (Local Environmental<br />
Plans) Order 2006. The document came into force on 26 February 2010 and replaces<br />
previous planning instruments including the <strong>Wollongong</strong> Local Environmental Plan 1990<br />
and <strong>Wollongong</strong> <strong>City</strong> Centre Local Environmental Plan 2007.<br />
In terms of land use, the new LEP has rezoned a number of areas in <strong>Wollongong</strong>, including<br />
Tallawarra, the Cavions site in Bulli and the Enterprise Corridor Precinct at Fairy Meadow,<br />
to provide for increased employment opportunities (WCC, 2010).<br />
7.5.2 Land Tenure<br />
This section of the report considers land tenure in the coastal zone and seeks to identify:<br />
• National Parks,<br />
• Community lands managed by <strong>Council</strong>,<br />
• Crown land – This includes Crown reserves, lands held under tenure (licence),<br />
roads and waterways, and<br />
• <strong>NSW</strong> Maritime lands.<br />
The extents of these land tenures have been mapped in Figures 7.8A to C. All other land<br />
types are assumed to be under private ownership.<br />
National Parks are declared under the National Parks and Wildlife (NPW) Act 1974.<br />
<strong>Council</strong> owned public lands are classified as either community or operational lands. Under<br />
the Local <strong>Government</strong> (LG) Act 1993, community lands are those kept for general use by<br />
the community (that is, public open space).<br />
Crown land is land vested in the Crown and managed by the <strong>NSW</strong> LPMA under the Crown<br />
Lands (CL) Act 1989. Crown lands are managed by the LPMA for public recreation and<br />
enjoyment, environmental conservation and heritage conservation purposes. In many parts<br />
of the State, coastal lands commonly include Crown lands. In addition, any land below the<br />
MHWM is also classed as Crown land. As a result, the LPMA is one of the major<br />
landholders in the coastal zone.<br />
The bed of Port Kembla itself is owned by <strong>NSW</strong> Maritime under the Maritime Services Act<br />
1935 and Regulation.<br />
7.6 Human Usage of the Coastal Zone<br />
There are approximately 200,000 people currently living in the <strong>Wollongong</strong> LGA.<br />
According to the Australian Bureau of Statistic’s 2006 census, the 0 to 17 age group<br />
comprises the highest percentage of the population (at 23.5%), whilst 21.1% of the<br />
population is aged between 35 and 49 years of age. Approximately 20% of the population<br />
is aged 60 years and over. The population has steadily increased in recent years due to<br />
new housing becoming available and it is expected to continue to grow with the release of<br />
additional land in the LGA.<br />
30 June 2010 Cardno Lawson Treloar Pty Ltd Page 52<br />
H:\Doc\2010\<strong>Report</strong>s.2010\Rep2564v2.Doc
<strong>Wollongong</strong> <strong>City</strong> <strong>Council</strong> Coastal Zone Study<br />
Prepared for <strong>Wollongong</strong> <strong>City</strong> <strong>Council</strong><br />
Of the 82,776 people in the labour force, 92.4% were employed and 7.6% were<br />
unemployed. Manufacturing (12% of the labour force), Health Care and Social Assistance<br />
(11.7%) and the Retail Trade (10.9%) are the three primary industrial sectors in which the<br />
residents of <strong>Wollongong</strong> work. 67.7% of the labour force works in the LGA, with 24%<br />
working outside of the area.<br />
7.6.1 Residential Usage<br />
Residential areas within the <strong>Wollongong</strong> LGA extend from the coast to approximately 15km<br />
inland. A number of suburbs within the coastal zone consist primarily of residential land<br />
and open space, including Austinmer, Thirroul, Bulli, Woonona, Bellambi, East Corrimal<br />
Towradgi, Lake Heights, Berkeley, Kanahooka and Koonawarra. Some of the southeastern<br />
suburbs have more commercial uses (<strong>Wollongong</strong> and Warrawong) and industrial<br />
uses (Port Kembla, Spring Hill and Unanderra). Commercial use of the coastal zone is<br />
discussed in Section 7.7.<br />
New residential developments in the coastal zone include those at Kanahooka and Sandon<br />
Point.<br />
7.6.2 Infrastructure<br />
A number of infrastructure and asset types are located within the coastal zone, including:<br />
• Roads;<br />
• Railway lines and stations;<br />
• Bus stops;<br />
• Utilities:<br />
o Electricity;<br />
o Gas;<br />
o Water, stormwater and sewerage systems;<br />
• Public facilities:<br />
o Car parks;<br />
o Public toilets;<br />
o Recreational amenities e.g. barbeques, playground equipment etc.<br />
This infrastructure is utilised by both residents and visitors to the coastal zone.<br />
Infrastructure linkages are important in maintaining consistency of services (e.g. electricity<br />
is available to all residents) and providing access (e.g. <strong>Wollongong</strong> railway station has<br />
several car parks nearby), and these linkages are present within the coastal zone.<br />
7.6.3 Recreational Usage<br />
Recreational activities are important in maintaining social interaction within a community<br />
and also have benefits relating to physical and mental health. Coastal areas in particular<br />
have high recreational value and offer many aesthetic advantages for city dwellers (DCC,<br />
2009).<br />
The <strong>Wollongong</strong> coastal zone provides opportunities for a range of land based recreational<br />
activities including those in Table 7.5.<br />
30 June 2010 Cardno Lawson Treloar Pty Ltd Page 53<br />
H:\Doc\2010\<strong>Report</strong>s.2010\Rep2564v2.Doc
<strong>Wollongong</strong> <strong>City</strong> <strong>Council</strong> Coastal Zone Study<br />
Prepared for <strong>Wollongong</strong> <strong>City</strong> <strong>Council</strong><br />
Table 7.5: Recreational Opportunities in the <strong>Wollongong</strong> Coastal Zone<br />
Land-based Water-based Air-based<br />
Walking<br />
Running<br />
Cycling<br />
Bird-watching<br />
Exercising pets<br />
Picnicking<br />
Abseiling<br />
Rock-climbing<br />
Skirmish<br />
Swimming<br />
Surfing<br />
Fishing and prawning<br />
Scuba diving<br />
Snorkelling<br />
Sailing<br />
Canoeing<br />
Kayaking<br />
Waterskiing<br />
Windsurfing<br />
Parasailing<br />
Model boats<br />
Skydiving<br />
Hang gliding<br />
On the day of the site inspection (22 January 2010), which was during the school holidays,<br />
people were observed engaging in a range of activities, including:<br />
• Swimming;<br />
• Paddling;<br />
• Surfing;<br />
• Dog exercising;<br />
• Picnicking;<br />
• Beach fishing;<br />
• Spear fishing;<br />
• Cycling;<br />
• Walking;<br />
• Board paddling/kayaking;<br />
• Kite surfing; and<br />
• Paragliding.<br />
The busiest beaches on that day were Austinmer, Bulli and North <strong>Wollongong</strong>. The tidal<br />
rock pools were also popular, particularly with families.<br />
It is understood that there are occasional conflicts between different user groups. One<br />
particular issue that was highlighted was conflict between off-leash dog walkers and other<br />
beach users.<br />
A shared cycleway spans much of the <strong>Wollongong</strong> foreshore areas including around Lake<br />
Illawarra and many coastal beaches. Walking tracks are also prevalent and are located<br />
along many of the foreshores and in bushland areas. These tracks and trails allow the<br />
community to access and experience the coastal zone. Boat ramps and picnic spots are<br />
positioned in a number of locations, particularly along the coastal and estuarine foreshores.<br />
Some of the recreational features of the <strong>Wollongong</strong> coastal zone, the coastal cycleway,<br />
boat ramps and parks/reserves are mapped in Figures 7.9A to C.<br />
There are also a number of other assets that provide recreational amenity located along the<br />
coastal zone. An audit of these features was undertaken during the site inspection. They<br />
included:<br />
30 June 2010 Cardno Lawson Treloar Pty Ltd Page 54<br />
H:\Doc\2010\<strong>Report</strong>s.2010\Rep2564v2.Doc
<strong>Wollongong</strong> <strong>City</strong> <strong>Council</strong> Coastal Zone Study<br />
Prepared for <strong>Wollongong</strong> <strong>City</strong> <strong>Council</strong><br />
• Seating;<br />
• Undercover seating;<br />
• Picnic tables;<br />
• BBQs;<br />
• Rubbish bins;<br />
• Public toilets;<br />
• Beach showers; and<br />
• Children’s playgrounds.<br />
Popular recreational locations such as Stanwell Park, Austinmer, North <strong>Wollongong</strong> Beach<br />
and <strong>Wollongong</strong> <strong>City</strong> Beach are well provided for in terms of recreational amenity.<br />
Commercial operators such as kiosks and cafes are also common in these locations.<br />
<strong>Council</strong> has been implementing the Blue Mile project, which aims at enhancing access and<br />
amenity of the foreshore between Stuart Park and the <strong>Wollongong</strong> Golf Club. This project<br />
has involved a range of works, including improvements to Cliff Road, Brighton Lawn<br />
Reserve and <strong>Wollongong</strong> <strong>City</strong> Beach. The project is still in the implementation phase.<br />
There are a number of recreational clubs associated with many of the above activities,<br />
including sailing and surf clubs, for example, Illawarra Yacht Club, Koonawarra Bay Sailing<br />
Club, and a number of SLSCs (as listed in Section 7.2). Other recreational facilities<br />
include Beaton Park Leisure Centre and Athletics Track and a number of golf ranges,<br />
including those at <strong>Wollongong</strong>, Primbee and Kembla Grange. Team-based sports are also<br />
popular and have local teams, such as rugby league, soccer, basketball and baseball.<br />
As indicated with reference to tourism (Section 7.7.2), one of the key attractants to<br />
<strong>Wollongong</strong>’s coastal zone is the fact that it has seventeen patrolled beaches. Patrols are<br />
provided by <strong>Council</strong> as well as by the SLSCs, which are run as volunteer organisations and<br />
are therefore heavily supported by the community. Several SLSCs have been required to<br />
establish elevated monitoring towers in recent years due to an increase in dune heights.<br />
This has had the effect of limiting their vision of the beach and, as a result, affects on public<br />
safety. Sand drift has also been identified as an issue in relation to the maintenance of<br />
beach access points.<br />
7.6.4 Aboriginal Cultural Heritage<br />
Historical Resources<br />
An excellent overview of the local Aboriginal people and their culture is provided in DEC<br />
(2005), with a more limited overview provided by Organ and Speechley (1997).<br />
The Aboriginal custodians of the Illawarra, stretching from Stanwell Park in the north to<br />
Bass Point in the south, are the Wodi Wodi (Wadi Wadi), who spoke a variation of the<br />
Dharawal language (DEC, 2005). These people are also known as the Dharawal,<br />
Tharawal or Thurrawal (Organ and Speechley, 1997). It is thought that Aboriginal people<br />
have inhabited the Illawarra region for around 20,000 to 30,000 years. The landscape, or<br />
Country, is central to the Illawarra peoples’ culture (DEC, 2005) and there are a number of<br />
stories about different landscape features along the coastal zone of the <strong>Wollongong</strong> LGA.<br />
The main stories relating to coastal features are:<br />
30 June 2010 Cardno Lawson Treloar Pty Ltd Page 55<br />
H:\Doc\2010\<strong>Report</strong>s.2010\Rep2564v2.Doc
<strong>Wollongong</strong> <strong>City</strong> <strong>Council</strong> Coastal Zone Study<br />
Prepared for <strong>Wollongong</strong> <strong>City</strong> <strong>Council</strong><br />
• The Whale and Starfish Story, which tells of the arrival of the Thurrawal people at<br />
the mouth of Lake Illawarra and the formation of Gang-man-gang (otherwise known<br />
as Windang Island); and<br />
• The Story of the Five Islands, located off Port Kembla, which were formed when<br />
Oola-boola-woo, the West Wind, punished his naughty daughters by blowing the<br />
rocks upon which they sat into the sea.<br />
The first contact with Europeans was in 1770 when Captain Cook and his crew sailed<br />
northwards along the coastline, with the first land grants issued for lands in the Illawarra in<br />
1817 (DEC, 2005). Organ and Speechley (1997) and DEC (2005) both provide a<br />
discussion of the impacts of European occupation on the Aboriginal people of the Illawarra,<br />
including impacts on the environment, politics and tribal relations, disease outbreaks and<br />
resistance to displacement by Europeans. However, DEC (2005) provide a more detailed<br />
discussion of the local land rights struggle up until the 1960’s.<br />
The occupation of coastal areas and use of coastal resources are discussed in both Organ<br />
and Speechley (1997) and DEC (2005). However, the key reference is Wesson (2005),<br />
which provides an excellent compendium of the marine, intertidal and estuarine resources<br />
used by local Aboriginal people, including specific species of kelp and seaweed, fish,<br />
whales and dolphins, shellfish, birds, trees and shrubs.<br />
Sites of Significance and Listed Sites<br />
Aboriginal objects and sites may be afforded protection under the <strong>NSW</strong> National Parks and<br />
Wildlife (NPW) Act 1974 and the Commonwealth EPBC Act.<br />
There is currently one Aboriginal place declared under S.84 of the NPW Act located within<br />
the study area, being Sandon Point near Bulli. It is understood that an application<br />
declaration is currently pending in relation to a second Aboriginal place within the study<br />
area located at Bellambi.<br />
There are also a number of Indigenous Australian Heritage Places listed on the Register of<br />
the National Estate and afforded protection under the EPBC Act, including:<br />
• Breakfast Creek Area, Thirroul;<br />
• Bulli Area:<br />
• East Woronora Area, Helensburgh; and<br />
• Flat Rock Swamp Area, Stanwell Tops.<br />
The exact location of these areas was not available.<br />
A request for a search of the NPWS Aboriginal Heritage Information Management System<br />
(AHIMS) revealed that there were 766 recorded Aboriginal sites within the study area.<br />
Further information as to the location and nature of these sites was not available at the time<br />
of publication and authorisation from the Illawarra LALC to obtain this information is<br />
currently pending. It is noted that, due to the sensitive nature of the information, the<br />
location of sites of significance to Aboriginal people as recorded in AHIMS may not be<br />
publicly disseminated.<br />
30 June 2010 Cardno Lawson Treloar Pty Ltd Page 56<br />
H:\Doc\2010\<strong>Report</strong>s.2010\Rep2564v2.Doc
<strong>Wollongong</strong> <strong>City</strong> <strong>Council</strong> Coastal Zone Study<br />
Prepared for <strong>Wollongong</strong> <strong>City</strong> <strong>Council</strong><br />
As identified in DEC (2005), the assessment and conservation of Aboriginal heritage places<br />
has historically been undertaken within National Parks, with those areas outside National<br />
Parks typically being subject to a more piece-meal approach through the conduct of<br />
Environmental Impact Assessments (EIAs) undertaken at highly localised sites. <strong>Council</strong><br />
holds copies of a number of archaeological reports that were prepared for this purpose.<br />
Records obtained from such activities are provided to DECCW, who maintain a register of<br />
known sites of cultural significance in the AHIMS and therefore AHIMS to a large extent<br />
reflects the distribution of survey effort. In addition, the exact location of site records<br />
submitted for entry into AHIMS is not always provided, and may instead reflect a general<br />
location, due to the sensitive nature of the site in question and a desire to keep its exact<br />
location confidential. Despite these facts, there is a tendency to assume that this AHIMS<br />
register represents an exhaustive list of the exact location of Aboriginal sites.<br />
This has been identified by the Illawarra LALC as a significant issue for management of<br />
Aboriginal cultural heritage, with an undue reliance on AHIMS records, coupled with a lack<br />
of consultation with local Aboriginal people, where development is proposed (S. Robinson,<br />
Illawarra LALC – T. Mackenzie, Cardno, 22/01/10). Another point of concern is the lack of<br />
resources for the management and ongoing conservation of Aboriginal sites in the<br />
<strong>Wollongong</strong> LGA, for which a desired outcome would be the employment of local Aboriginal<br />
people for this purpose. Current management of Aboriginal sites and cultural heritage is<br />
considered ad hoc and lacking a holistic approach.<br />
Potential Climate Change Impacts<br />
Organ and Speechley (1997) note that many of the historic camp sites, middens and other<br />
evidence of occupation in the coastal zone would have been lost through inundation at the<br />
end of the large ice age around 15,000 years ago, which suggests that there is potential for<br />
the occurrence of submerged items or sites of significance in the <strong>Wollongong</strong> coastal zone.<br />
There are a number of sites currently at risk from coastal processes and sea level rise<br />
impacts resulting from climate change will further exacerbate these issues. One example is<br />
the Sandon Point Tent Embassy and it is understood the Embassy has previously been<br />
affected by coastal storms and catchment flooding.<br />
7.6.5 Non-Indigenous Cultural Heritage<br />
Exploration of the Illawarra region by European settlers took place in the early 1800s and<br />
settlement of the area took place soon after. Historical uses of the coastal zone were<br />
particularly centred around <strong>Wollongong</strong> Harbour and Port Kembla. <strong>Wollongong</strong> Harbour<br />
was first used for shipping in the early 1800s and was utilised for shipping coal exports until<br />
the late 1800s. Port Kembla port was then developed and due to its larger size, became<br />
the primary facility for coal export after that time.<br />
In part due to the history of shipping in the area, there are a large number of non-<br />
Indigenous heritage items located within the <strong>Wollongong</strong> Coastal zone. The following<br />
sections describe heritage in the context of national, state and local significance. Figures<br />
7.10A to C show the heritage items that are located within the study area.<br />
30 June 2010 Cardno Lawson Treloar Pty Ltd Page 57<br />
H:\Doc\2010\<strong>Report</strong>s.2010\Rep2564v2.Doc
<strong>Wollongong</strong> <strong>City</strong> <strong>Council</strong> Coastal Zone Study<br />
Prepared for <strong>Wollongong</strong> <strong>City</strong> <strong>Council</strong><br />
National Heritage<br />
As shown in Table 7.6 a number of places within the study area are listed as “Registered”<br />
on the Register of the National Estate (RNE). Further to the items in Table 7.6, an<br />
additional eleven items are listed as an “Indicative Place” on the RNE. These items are<br />
shown in Figures 7.10A to C.<br />
Table 7.6: Places Registered on the Register of the National Estate<br />
Name of Place<br />
Burning Palms Settlement<br />
Era Beach Settlement<br />
Little Garie Cabin Community<br />
Five Islands Nature Reserve<br />
Berkeley Nature Reserve<br />
<strong>Wollongong</strong> Harbour (part)<br />
Red Point Geological Site<br />
Austinmer Beach Geological Site<br />
Courthouse (former)<br />
Little Milton<br />
Illawarra Historical Museum<br />
Osborne Memorial Anglican Church of St Luke<br />
<strong>Wollongong</strong> Courthouse<br />
Belmore Basin Lighthouse<br />
Hillcrest<br />
Location<br />
Sir Bertram Stevens Dr, Lilyvale<br />
Sir Bertram Stevens Dr, Lilyvale<br />
Garie Rd, Lilyvale<br />
Port Kembla<br />
Holborn St, Berkeley<br />
Endeavour Dr, <strong>Wollongong</strong><br />
Military Rd, Port Kembla<br />
Lawrence Hargrave Dr, Austinmer<br />
Cliff Rd, <strong>Wollongong</strong><br />
31-33 Smith St, <strong>Wollongong</strong><br />
11 Market St, <strong>Wollongong</strong><br />
Prince Edward Dr, Brownsville<br />
Market St, <strong>Wollongong</strong><br />
Endeavour Dr, <strong>Wollongong</strong><br />
Railway Cr, Stanwell Park<br />
State Heritage<br />
In terms of state-significant heritage, Table 7.7 outlines the items and places that are listed<br />
on the State Heritage Register, and these are also mapped in Figures 7.10A to C.<br />
Table 7.7: Places/Items Listed on the State Heritage Register.<br />
Name of Place<br />
Balgownie Migrant Workers Hostel: Huts 201, 204 and<br />
210<br />
Scarborough Railway Station group<br />
St Michael's Cathedral & Rectory<br />
North Beach Precinct<br />
<strong>Wollongong</strong> East Post Office<br />
Thirroul Railway Station group<br />
Austinmer Railway Station group<br />
Otford railway tunnel (disused)<br />
Bulli Railway Station group movable relics<br />
Shop<br />
Regent Theatre<br />
Hill 60/ Illowra Battery<br />
Location<br />
Fairy Meadow<br />
No data<br />
No data<br />
No data<br />
91 Crown Street, <strong>Wollongong</strong><br />
No data<br />
No data<br />
No data<br />
No data<br />
87 Crown Street, <strong>Wollongong</strong><br />
197 Keira Street, <strong>Wollongong</strong><br />
No data<br />
30 June 2010 Cardno Lawson Treloar Pty Ltd Page 58<br />
H:\Doc\2010\<strong>Report</strong>s.2010\Rep2564v2.Doc
<strong>Wollongong</strong> <strong>City</strong> <strong>Council</strong> Coastal Zone Study<br />
Prepared for <strong>Wollongong</strong> <strong>City</strong> <strong>Council</strong><br />
Name of Place<br />
Little Milton<br />
Stanwell Park rail viaduct over Stanwell Creek<br />
<strong>Wollongong</strong> Harbour Precinct<br />
Location<br />
31-33 Smith Street, <strong>Wollongong</strong><br />
No data<br />
Cliff Road and Endeavour Drive,<br />
<strong>Wollongong</strong><br />
Local Heritage<br />
A large number of heritage items and places are listed in the <strong>Wollongong</strong> LEP 2009, and<br />
these are mapped in Figures 7.10A to C.<br />
7.7 Economic Value of the Coastal Zone<br />
7.7.1 Commercial Uses<br />
Commercial activities operating in the area are important not only for local people requiring<br />
goods and services, but are also significant on a regional scale.<br />
<strong>Wollongong</strong> <strong>City</strong> represents an economic hub on a local, regional and state level,<br />
comprising nearly half (45.2%) of all business locations in the region and supporting over<br />
12,000 business locations (Iris Research, 2008). Workers commute to <strong>Wollongong</strong> to work<br />
at their places of business from various locations in the region.<br />
A major input to the local economy is the port of Port Kembla, which is an 800 hectare<br />
(approx.) facility that services the needs of regional industries through coal and steel<br />
exports and also provides a trade base for general and bulk cargoes, containers, motor<br />
vehicle imports and grain exports. Overall, Port Kembla Port contributes $418 million to the<br />
regional economy each year (PKPC, 2007).<br />
The economic value of the coastal zone is also characterised by other industrial and<br />
commercial activities including:<br />
• The Tallawarra natural gas power station located in Yallah which commenced<br />
operation in January 2009 and generates power to supply up to 200,000 homes<br />
(TruEnergy, 2009);<br />
• Unanderra industrial park (partially located within the study area), which<br />
incorporates a range of business locations that sell industrial and commercial<br />
materials and supplies;<br />
• Westfield Warrawong, a major shopping centre that comprises a large variety of<br />
retail stores.<br />
Tourism as a commercial activity is discussed below in Section 7.7.2.<br />
7.7.2 Tourism<br />
Tourism is a significant industry in the <strong>Wollongong</strong> LGA, with the approximate 2.8 million<br />
visitors injecting on average $400 million dollars per year into the local economy (Tourism<br />
Research Australia, 2008). At present, there are approximately 4,100 businesses (nonemploying<br />
and small to large operations) that make up <strong>Wollongong</strong>’s tourism industry<br />
(Tourism Research Australia, 2008). These businesses are either directly or indirectly<br />
30 June 2010 Cardno Lawson Treloar Pty Ltd Page 59<br />
H:\Doc\2010\<strong>Report</strong>s.2010\Rep2564v2.Doc
<strong>Wollongong</strong> <strong>City</strong> <strong>Council</strong> Coastal Zone Study<br />
Prepared for <strong>Wollongong</strong> <strong>City</strong> <strong>Council</strong><br />
related to tourism and employ thousands of local residents. The types of specialist<br />
services offered by businesses include:<br />
• Surf schools,<br />
• Sky diving,<br />
• Scuba diving,<br />
• Boat day trips (with many operators running out of the Harbour Precinct),<br />
• Both small and large hotels,<br />
• Tourist parks (caravan and camping grounds),<br />
• Food and beverage outlets, and<br />
• Activities centered around various events, such as:<br />
− Art in the Park at Belmore Basin,<br />
− New Years Eve fireworks,<br />
− Various Australia Day activities,<br />
− The Aquathon,<br />
− Kembla Joggers Fun Run,<br />
− Sydney to <strong>Wollongong</strong> Bike Ride,<br />
− Seaside Festival, and<br />
− Several sporting events including surf carnivals, canoe regattas, sailing club<br />
regattas and professional golfing competitions.<br />
<strong>Wollongong</strong>’s close proximity to Sydney has allowed the region to establish itself as a great<br />
weekend escape location with an abundance of beaches, restaurants, hotels and<br />
recreational activities on offer to visitors. Visiting friends and relatives is the number one<br />
reason why visitors, both international and domestic, travel to <strong>Wollongong</strong> (Tourism<br />
Research Australia, 2008).<br />
Amongst both international and domestic visitors, the most popular activity to take part in<br />
whilst in <strong>Wollongong</strong> is to eat out at restaurants and cafes (Tourism Research Australia,<br />
2008). There are many eateries in the area that are situated along the coastline and these<br />
are popular with visitors who wish to enjoy the view of the beaches.<br />
<strong>Wollongong</strong>’s coastal area is a vital, unique selling point for tourism in <strong>Wollongong</strong>. With<br />
seventeen patrolled beaches and fourteen coastal baths in the LGA, going to the beach<br />
was rated as the second most popular activity undertaken by both international and<br />
domestic tourists to the region (Tourism Research Australia, 2008). Other aquatic activities<br />
are also popular, including scuba diving, surfing, snorkeling, sky diving, water-skiing (Lake<br />
Illawarra), windsurfing, boating and fishing. For this reason, summer is the peak period for<br />
visits by tourists.<br />
The escarpment represents another key feature of the coastal zone, providing what is<br />
referred to as a “green curtain backdrop” for the beaches. The need for maintenance of<br />
these landscapes and the provision of suitable viewing points are identified as being<br />
significant for the local tourism industry (G. Binskin, Wollognong Tourism - T. Mackenzie,<br />
Cardno, 9/12/09). With Drive Tourism becoming increasingly popular, the Grand Pacific<br />
Drive captures this niche market due to the superb coastline and panoramic views from this<br />
spectacular roadway.<br />
30 June 2010 Cardno Lawson Treloar Pty Ltd Page 60<br />
H:\Doc\2010\<strong>Report</strong>s.2010\Rep2564v2.Doc
<strong>Wollongong</strong> <strong>City</strong> <strong>Council</strong> Coastal Zone Study<br />
Prepared for <strong>Wollongong</strong> <strong>City</strong> <strong>Council</strong><br />
There are a number of foreshore parks that offer BBQs, picnic facilities and playgrounds.<br />
The majority of the coastline is also covered by a cycle way, which is shown in Figures<br />
7.9A to C. These facilities are popular with both locals and visitors and significantly<br />
enhance the amenity of the coastline. Further details on recreational amenity are provided<br />
in Section 7.6.1.<br />
<strong>Wollongong</strong>’s tourist parks (that is, caravan and camping parks) are strategically located<br />
adjacent to one of the region’s beaches in order to benefit from visitor’s desire to be close<br />
to the coastline. Despite this attraction to staying on the coast, there is a considerable<br />
shortage of beachfront hotels in the region. There are tourist parks located at the following<br />
locations:<br />
• Coledale,<br />
• Corrimal,<br />
• Towradgi,<br />
• Figtree, and<br />
• Windang.<br />
Tourism will continue to play an important role in the economic growth of the <strong>Wollongong</strong><br />
region, although resources and natural assets need to be better managed in order to<br />
sustain such growth and attract a variety of tourist markets.<br />
The consultation undertaken for this project indicated that there were several unrealized<br />
opportunities for tourism within the study area that would provide the opportunity of<br />
diversifying the market and attracting additional visitors, including:<br />
• Whale watching and other eco-tourism activities,<br />
• Pet Tourism, whereby facilities are provided to accommodate companion animals<br />
(for example, in hotels),<br />
• Health Tourism, such as spas and retreats,<br />
• Cultural Tourism, specifically as it relates to Aboriginal cultural heritage (S.<br />
Robinson, Illawarra LALC – T. Mackenzie, Cardno, 22/01/10). This is currently<br />
limited to the Southern Gateway Centre, at which the Jumbulla Aboriginal Discovery<br />
Centre is located, and some walking tracks at various locations with interpretive<br />
signage.<br />
Except where otherwise articulated, those opportunities listed above were identified by<br />
Tourism <strong>Wollongong</strong>.<br />
7.8 Management Issues<br />
In the course of compiling the information for this study, particularly during the stakeholder<br />
consultation period, a number of management issues have been identified for the study<br />
area. They have been summarised in Appendix G. Management issues related to:<br />
• Planning and policy framework for coastal management;<br />
• Marine and aeolian sediment transport (erosion and accretion);<br />
• Introduced flora and fauna species particularly in dune areas;<br />
• The vulnerability of foreshore infrastructure to damage by coastal hazards;<br />
30 June 2010 Cardno Lawson Treloar Pty Ltd Page 61<br />
H:\Doc\2010\<strong>Report</strong>s.2010\Rep2564v2.Doc
<strong>Wollongong</strong> <strong>City</strong> <strong>Council</strong> Coastal Zone Study<br />
Prepared for <strong>Wollongong</strong> <strong>City</strong> <strong>Council</strong><br />
• The vulnerability of foreshore heritage and historic sites to damage by coastal<br />
hazards and sea level rise;<br />
• Culvert blockage and foreshore inundation;<br />
• Foreshore access and lack of recreational facilities;<br />
• Conflict between recreational users;<br />
• Rubbish dumping, vandalism and inappropriate use of recreational areas;<br />
• Visual amenity; and<br />
• Under-utilisation of educational and tourism opportunities.<br />
7.9 Values and Significance of the Coastal Zone<br />
The coastal zone is valued highly by the people who utilise and interact with it. A study<br />
carried out by CSIRO (2004) consulted with local residents, heritage and conservation<br />
groups, local businesses and investors/developers to determine the values associated with<br />
coastal areas in the <strong>Wollongong</strong> LGA. Three broad areas of value were identified;<br />
recreational value, aesthetic value and value of the natural environment (CSIRO, 2004).<br />
The report focused on Towradgi, Fairy and Hewitts/Tramway Creeks; however, the broad<br />
nature of the values seems applicable to parts of the whole study area.<br />
Table 7.8 provides examples of recreation values, natural environment values, social and<br />
aesthetic values and commercial values from the CSIRO (2004) report. A summary of the<br />
local, regional, national and international significance of the <strong>Wollongong</strong> coastal zone is<br />
also provided.<br />
Table 7.8: Values and Significance of the <strong>Wollongong</strong> Coastal Zone<br />
Values (from CSIRO,2004)<br />
Significance<br />
Recreation<br />
› Numerous recreational opportunities (e.g.<br />
swimming, boating, cycling) and recreational<br />
amenity, (e.g. parks and reserves, sporting<br />
facilities, picnic tables and boat ramps);<br />
› Proximity and access to the coastal and<br />
estuarine foreshores, the ocean and Lake<br />
Illawarra;<br />
› Good coastal and estuarine water quality for<br />
the purposes of recreation;<br />
› Air quality suitable for the purposes of<br />
recreation;<br />
› Sustainable use of fish for recreation into the<br />
future.<br />
Natural Environment<br />
› Biodiversity of native flora and fauna species;<br />
and<br />
› Good coastal and estuarine water quality for<br />
the purposes of maintaining aquatic and<br />
marine health.<br />
Social and Aesthetic<br />
› Visual character and aesthetics, such as views<br />
across the water;<br />
30 June 2010 Cardno Lawson Treloar Pty Ltd Page 62<br />
H:\Doc\2010\<strong>Report</strong>s.2010\Rep2564v2.Doc<br />
Local Scale<br />
› Significance for the Aboriginal custodians of<br />
the Illawarra, the Wodi Wodi (Wadi Wadi).<br />
Aboriginal heritage items are located in the<br />
study area;<br />
› Extensive usage of the coastal foreshore by<br />
local people on a regular basis, including<br />
beaches and coastal parks;<br />
› Place for activities for various water based<br />
clubs and organisations;<br />
› A range of non-Aboriginal heritage items which<br />
exist in the area; and<br />
› The dune and estuarine habitats represented<br />
within the study area and associated with high<br />
rates of diversity and abundance of fish, birds<br />
and invertebrate fauna.<br />
Regional/State Scale<br />
› <strong>Wollongong</strong> <strong>City</strong> represents a business and<br />
economic hub and workers in the region are<br />
known to commute to <strong>Wollongong</strong> on a daily<br />
basis;<br />
› The study area, including Lake Illawarra and<br />
the many coastal beaches are an attractive<br />
destination for tourists, e.g. from Sydney; and
<strong>Wollongong</strong> <strong>City</strong> <strong>Council</strong> Coastal Zone Study<br />
Prepared for <strong>Wollongong</strong> <strong>City</strong> <strong>Council</strong><br />
Values (from CSIRO,2004)<br />
› Aboriginal uses of the coastal zone (e.g.<br />
cultural practices);<br />
› Feeling of safety when visiting coastal areas;<br />
› Opportunities for education about the natural<br />
environment;<br />
› Opportunities for community participation<br />
through Landcare/ Bushcare volunteer groups;<br />
› Historical values and cultural heritage and<br />
associated opportunities for education; and<br />
› Spiritual value including appreciation of nature.<br />
Commercial<br />
› Major events that attract tourists from other<br />
regions and beyond; and<br />
› Opportunities to profit from recreational users.<br />
Significance<br />
› 27 flora species and 80 fauna species are<br />
listed as threatened under State legislation<br />
(TSC Act and FM Act).<br />
National Scale<br />
› 15 places are listed on the Register of the<br />
National Estate; and<br />
› 16 flora and 20 fauna species are listed under<br />
the Commonwealth EPBC Act.<br />
International Scale<br />
› Some endangered species are listed under<br />
bilateral and multilateral agreements (e.g.<br />
JAMBA and CAMBA).<br />
It is noted that <strong>Council</strong> Plans of Management for a range of parks and reserves within the<br />
coastal zone refer to specific values and significance associated with these locations.<br />
Relevant Plans of Management include the following:<br />
• Draft <strong>Wollongong</strong> <strong>City</strong> Foreshore Plan of Management;<br />
• Plan of Management – Stanwell Park and Bald Hill;<br />
• Beaton Park Plan of Management;<br />
• Plan of Management for Judbooley Parade, Windang; and<br />
• Coledale Beach Reserve Plan of Management.<br />
Some significant features within the <strong>Wollongong</strong> coastal zone may be affected by coastal<br />
hazards. This is discussed in Section 8.3, where a subset of significant features is overlaid<br />
with hazard extents for the purposes of risk assessment.<br />
30 June 2010 Cardno Lawson Treloar Pty Ltd Page 63<br />
H:\Doc\2010\<strong>Report</strong>s.2010\Rep2564v2.Doc
<strong>Wollongong</strong> <strong>City</strong> <strong>Council</strong> Coastal Zone Study<br />
Prepared for <strong>Wollongong</strong> <strong>City</strong> <strong>Council</strong><br />
8 Coastal Risk Assessment<br />
8.1 Erosion Hazard Extents<br />
The present day, 2050 and 2100-years hazard extents have been determined along all<br />
beaches within the study area at selected profile locations using site specific wave climate<br />
and beach profile information (see Sections 5.1 and 5.5). For each planning period, two<br />
hazard extents are specified:<br />
• Immediate Impact Zone – the landward extent of the eroded scarp following the<br />
100-years design event at the end of the specified planning period<br />
• Zone of Reduced Foundation Capacity – the zone in which any structure will<br />
require piles to a suitable depth to prevent failure following the design storm.<br />
The hazard zones have been calculated using the method described by Nielsen et al<br />
(1992). A diagram describing this method is provided in Appendix H. An average beach<br />
profile based on either available photogrammetric data or ALS data was used to calculate<br />
the baseline volume, and average ground level for each profile. The calibrated storm<br />
erosion volume was taken from the SBeach results for each beach profile and applied to<br />
this methodology (defined in Section 5.5). A set of hazard lines were then produced for<br />
the existing, 2050 and 2100 planning horizons that include beach response to sea level rise<br />
based on the <strong>NSW</strong> Sea level rise benchmarks. Figures 8.1 to 8.13 present plan views of<br />
hazard extents along the <strong>Wollongong</strong> LGA coastline.<br />
Erosion hazard definition at the ends of the beach compartments required some<br />
extrapolation of the storm demand/recession results and considered the presence of rock<br />
headland and cliff features. These areas of the mapping underwent review and<br />
incorporated the geotechnical advice (slope and cliff stability) that was undertaken by GHD<br />
as part of this overall study; see Section 6 and Appendix F. Furthermore, the reduction in<br />
erosion extent in these areas also considered the generally steeper slopes and reduced<br />
wave exposure (from the wave modelling) that the ends of the beach compartments are<br />
commonly subjected to as a result of protection from headland features.<br />
Lagoon entrances are formed by both catchment and ocean processes and hence the<br />
definition of the erosion hazard line required some consideration. Catchment flooding was<br />
beyond the scope of this study and therefore lagoon entrance breakout events were not<br />
investigated. The erosion hazard through the lagoon entrance areas was therefore defined<br />
at the design water levels (see Section 5.2). Should the entrance be open during an<br />
ocean storm event, waves may penetrate into the lagoon and attack the shorelines at the<br />
storm tide level. Future catchment studies should consider entrance breakout processes<br />
and would need to define a second erosion hazard line through these areas, which may be<br />
greater in extent. No erosion hazard line was defined for the Lake Illawarra foreshore as its<br />
definition is not appropriate for estuarine systems (see Section 5.6.3).<br />
Where appropriate, erosion hazard lines have accounted for the presence of shoreline<br />
protection features. However, this was only possible at the Pavillion and Continental Pool<br />
areas (Figure 8.11), using the outcomes of geotechnical field investigations at these sites.<br />
In all other cases, no definitive information was available on the foundations of the<br />
30 June 2010 Cardno Lawson Treloar Pty Ltd Page 64<br />
H:\Doc\2010\<strong>Report</strong>s.2010\Rep2564v2.Doc
<strong>Wollongong</strong> <strong>City</strong> <strong>Council</strong> Coastal Zone Study<br />
Prepared for <strong>Wollongong</strong> <strong>City</strong> <strong>Council</strong><br />
protection works and hence no judgement as to their effectiveness during design storm<br />
events could be made. In these instances, the presence of these structures was ignored.<br />
Redefinition of the erosion hazard line could be undertaken based on site/structure specific<br />
investigations. Where a site specific investigation of the protection structure is undertaken<br />
and the structure is observed to be founded on rock or deep foundations, then the structure<br />
would form the erosion hazard extent under all planning period horizons.<br />
8.2 Inundation Hazard Extents<br />
Ocean inundation extent is defined as the point to which wave overtopping and run-up<br />
occurs. Wave inundation modelling has been undertaken for the existing, 2050 and 2100<br />
climate change scenarios. These studies identify the area subject to wave inundation from<br />
the 100-years ARI ocean storm. No assessment was made of catchment flows that would<br />
influence flooding around low-lying lagoon areas from time to time. These investigations<br />
are subject to separate catchment flood studies, however, information for Lake Illawarra<br />
has been made available through the Lake Illawarra Floodplain Risk Management process<br />
(see Section 8.2.1).<br />
The inundation scenarios assume an eroded beach profile; therefore wave inundation<br />
extends from the relevant erosion hazard line. The inundation modelling was undertaken in<br />
2D over the entire back-beach area to a land level of 10mAHD. Topographical information<br />
of the back-beach area integrated into the modelling setup allows the spatial definition and<br />
mapping of these inundation lines.<br />
Figures 8.14 to 8.26 present plan views of inundation extents along the <strong>Wollongong</strong> LGA<br />
coastline. It is noted that structures (including buildings and stormwater infrastructure) are<br />
not described in the modelling and hence the inundation extents provided can be<br />
considered conservative. The duration of inundation would be much shorter than that of<br />
catchment flooding and would correspond to the peak of the high (storm) tide, being in the<br />
order of 1-2 hours, after which it is considered that the stormwater systems and natural<br />
drainage paths within the affected areas would be sufficient to allow the drainage of the<br />
ocean waters.<br />
The inundation hazard extents identify areas that would be potentially subject to inundation<br />
under the 100-years ARI ocean storm event and consider the eroded form of the beach as<br />
well as the likely wave characteristics that cause overtopping. While the areas defined<br />
consider overtopping of the back beach region, the outcomes are not appropriate for the<br />
definition of wave overtopping parameters of specific structures. A structure specific<br />
analysis of wave overtopping and hazard would be required to identify the hazard at these<br />
features.<br />
8.2.1 Lake Illawarra<br />
Inundation mapping of the Lake Illawarra foreshore area was undertaken for the 100-years<br />
ARI event (considering both catchment and ocean processes) under both existing and sea<br />
level rise scenarios, being the 2050 and 2100 planning horizons. The outcomes are<br />
presented in Figures 8.27 A to C for ocean storm inundation and Figures 8.28 A to C for<br />
catchment events. The inundation extents for catchment flooding have been provided<br />
through outcomes of the Floodplain Risk Management Study and Plan (Cardno, 2010).<br />
30 June 2010 Cardno Lawson Treloar Pty Ltd Page 65<br />
H:\Doc\2010\<strong>Report</strong>s.2010\Rep2564v2.Doc
<strong>Wollongong</strong> <strong>City</strong> <strong>Council</strong> Coastal Zone Study<br />
Prepared for <strong>Wollongong</strong> <strong>City</strong> <strong>Council</strong><br />
8.3 Risk Assessment<br />
A preliminary risk assessment was undertaken for the <strong>Wollongong</strong> coastal zone, whereby<br />
the spatial mapping gathered in relation to coastal features (Section 7) was overlaid with<br />
the erosion and inundation hazard extents (Section 8.1 and 8.2).<br />
The preliminary risk assessment seeks to identify built assets, heritage items and important<br />
ecological features that will be at risk due to storm erosion and foreshore inundation at<br />
each planning horizon (that is, 2010, 2050 and 2100).<br />
The findings are summarised in Tables 8.1 to 8.16. A tick has been provided where an<br />
asset is affected during that planning horizon. Where a particular asset is present, but is<br />
unaffected under any planning horizon, no boxes have been ticked. These tables should<br />
be reviewed in conjunction with Figures 8.1 to 8.28. Note that if any part of an asset or<br />
property was situated within an extent then that asset or property was considered to be<br />
“affected”. This means that some assets or properties may only have a small area that is<br />
affected.<br />
With respect to erosion hazard, the risk assessment was undertaken as follows. Roads,<br />
land (cadastral) parcels, other assets (for example, surf clubs) and heritage items were<br />
identified as being at risk if they were located within the zone of reduced foundation<br />
capacity. Stormwater infrastructure and ecological features (EECs) were identified as<br />
being at risk if they were located within the immediate hazard extent.<br />
Assets assessed for risk from inundation hazard included roads, land (cadastral) parcels<br />
and heritage items. Ecological features, in this case coastal vegetation communities (EECs<br />
only) are often reliant or tolerant of some degree of inundation and were therefore not<br />
assessed in this regard.<br />
The number of land parcels falling within the extent of the ‘red lines’ defining areas of<br />
coastal influenced geotechnical hazard were also assessed with the findings presented for<br />
each suburb in Table 8.16.<br />
The number of land parcels affected by erosion, inundation and geotechnical hazard were<br />
defined through an analysis undertaken by <strong>Council</strong>. A more detailed analysis would be<br />
required to identify how many of the affected land parcels comprise private properties and<br />
how many comprise public lands. The risk assessment provides an indication of the extent<br />
to which assets are at risk from coastal processes. Despite the preliminary nature of the<br />
assessment, it is apparent that there is significant potential for assets to be negatively<br />
affected by coastal processes and that this risk is likely to increase over time due to the<br />
effects of climate change (in this case, SLR and shoreline recession). Where reference is<br />
made to private properties or other buildings being at risk from erosion hazard, it is<br />
considered that a more detailed, site specific investigation of coastal processes would be<br />
recommended to confirm the findings of this study.<br />
Only those assets for which mapping was available were considered in this assessment. It<br />
is noted that the full extent of the assets affected by erosion hazard is likely to be<br />
significantly greater than those considered as part of this assessment, particularly where<br />
inundation hazard is taken into account. A more detailed assessment of built and natural<br />
assets at risk from coastal hazards was considered beyond the scope of the current study<br />
30 June 2010 Cardno Lawson Treloar Pty Ltd Page 66<br />
H:\Doc\2010\<strong>Report</strong>s.2010\Rep2564v2.Doc
<strong>Wollongong</strong> <strong>City</strong> <strong>Council</strong> Coastal Zone Study<br />
Prepared for <strong>Wollongong</strong> <strong>City</strong> <strong>Council</strong><br />
and it is recommended that a detailed audit be undertaken to fully quantify the risk and<br />
develop a risk management strategy.<br />
Table 8.1: Risk Assessment: Stanwell Park Beach (see Figure 8.1 and Figure 8.14)<br />
Asset<br />
Notes<br />
2010<br />
2050<br />
2100<br />
Built Assets<br />
Roads<br />
Stormwater Infrastructure<br />
Land Parcels<br />
ZFRC* Extent<br />
√<br />
Inundation Extent √ √ √<br />
Immediate Hazard Extent<br />
ZFRC Extent 3 3 3<br />
Inundation Extent 24 33 41<br />
Assets Affected by Erosion<br />
Hazard<br />
Heritage<br />
Local Heritage<br />
State Heritage<br />
National Estate<br />
Ecology<br />
Helensburg-Stanwell Park SLSC &<br />
car park<br />
None present<br />
None present<br />
Stanwell Park Coastal Conservation<br />
Area; not affected<br />
√<br />
EEC Immediate Hazard Extent √ √ √<br />
*ZFRC = Zone of Reduced Foundation Capacity<br />
Table 8.2: Risk Assessment: Coalcliff Beach (see Figure 8.2 and Figure 8.15)<br />
Asset<br />
Notes<br />
2010<br />
2050<br />
2100<br />
Built Assets<br />
Roads<br />
None affected<br />
Stormwater Infrastructure Immediate Hazard Extent √ √ √<br />
Land Parcels<br />
Assets Affected by<br />
Erosion Hazard<br />
Heritage<br />
Local Heritage<br />
State Heritage<br />
National Estate<br />
ZFRC Extent 15 15 15<br />
Inundation Extent 16 16 16<br />
SLSC & car park Coalcliff √ √<br />
Coalcliff Tidal Rock Pool √ √ √<br />
None present<br />
None present<br />
None present<br />
Ecology<br />
EEC Immediate Hazard Extent √ √ √<br />
30 June 2010 Cardno Lawson Treloar Pty Ltd Page 67<br />
H:\Doc\2010\<strong>Report</strong>s.2010\Rep2564v2.Doc
<strong>Wollongong</strong> <strong>City</strong> <strong>Council</strong> Coastal Zone Study<br />
Prepared for <strong>Wollongong</strong> <strong>City</strong> <strong>Council</strong><br />
Table 8.3: Risk Assessment: Scarborough/Wombarra Beach (see Figure 8.3 and Figure 8.16)<br />
Asset<br />
Notes<br />
2010<br />
2050<br />
2100<br />
Built Assets<br />
Roads<br />
ZFRC Extent<br />
Inundation Extent √ √ √<br />
√<br />
Stormwater Infrastructure Immediate Hazard Extent √ √ √<br />
Land Parcels<br />
ZRFC Extent 1 1 1<br />
Inundation Extent 1 2 2<br />
Assets Affected by<br />
Erosion Hazard<br />
Heritage<br />
Local Heritage<br />
State Heritage<br />
National Estate<br />
Ecology<br />
SLSC Illawarra Park (off Monash<br />
Street, Wombarra)<br />
Not affected<br />
None present<br />
None present<br />
√ √ √<br />
EEC Immediate Hazard Extent √ √ √<br />
Table 8.4: Risk Assessment: Coledale Beach (see Figure 8.4 and Figure 8.17)<br />
Asset<br />
Notes<br />
2010<br />
2050<br />
2100<br />
Built Assets<br />
Roads<br />
ZFRC Extent<br />
√<br />
Inundation Extent √ √ √<br />
Stormwater Infrastructure Immediate Hazard Extent √<br />
Land Parcels<br />
Assets Affected by<br />
Erosion Hazard<br />
Heritage<br />
Local Heritage<br />
State Heritage<br />
National Estate<br />
ZRFC Extent 2 3 3<br />
Inundation Extent 2 2 3<br />
SLSC & car park Coledale √ √<br />
Coledale Tourist Park<br />
√<br />
ZRFC Extent √ √<br />
Inundation Extent √ √ √<br />
None present<br />
None present<br />
Ecology<br />
EEC Immediate Hazard Extent √ √ √<br />
30 June 2010 Cardno Lawson Treloar Pty Ltd Page 68<br />
H:\Doc\2010\<strong>Report</strong>s.2010\Rep2564v2.Doc
<strong>Wollongong</strong> <strong>City</strong> <strong>Council</strong> Coastal Zone Study<br />
Prepared for <strong>Wollongong</strong> <strong>City</strong> <strong>Council</strong><br />
Table 8.5: Risk Assessment: Sharkies Beach (see Figure 8.5 and Figure 8.18)<br />
Asset<br />
Notes<br />
2010<br />
2050<br />
2100<br />
Built Assets<br />
Roads<br />
ZFRC Extent<br />
Inundation Extent √ √<br />
Stormwater Infrastructure Immediate Hazard Extent √ √ √<br />
Land Parcels<br />
Assets Affected by<br />
Erosion Hazard<br />
Heritage<br />
Local Heritage<br />
State Heritage<br />
National Estate<br />
Ecology<br />
ZRFC Extent 4 4 4<br />
Inundation Extent 3 4 4<br />
Beach car park √ √<br />
Austinmer boat harbour car park √ √ √<br />
ZRFC Extent √ √ √<br />
Inundation Extent √ √ √<br />
None present<br />
None present<br />
EEC Immediate Hazard Extent √ √ √<br />
Table 8.6: Risk Assessment: Austinmer & Austinmer North Beaches (see Figure 8.6 and Figure 8.19)<br />
Asset<br />
Notes<br />
2010<br />
2050<br />
2100<br />
Built Assets<br />
Roads<br />
ZFRC Extent<br />
Inundation Extent √ √<br />
√<br />
Stormwater Infrastructure Immediate Hazard Extent √ √ √<br />
Land Parcels<br />
Assets Affected by<br />
Erosion Hazard<br />
Heritage<br />
Local Heritage<br />
State Heritage<br />
National Estate –<br />
Austinmer War Memorial<br />
ZRFC Extent 10 10 12<br />
Inundation Extent 10 13 19<br />
Tuckerman Park car park √ √ √<br />
Beach car park<br />
√<br />
SLSC Austinmer<br />
√<br />
Austinmer Rock Baths √ √ √<br />
ZRFC Extent √ √ √<br />
Inundation Extent<br />
None present<br />
ZRFC Extent<br />
√<br />
Inundation Extent √ √<br />
30 June 2010 Cardno Lawson Treloar Pty Ltd Page 69<br />
H:\Doc\2010\<strong>Report</strong>s.2010\Rep2564v2.Doc
<strong>Wollongong</strong> <strong>City</strong> <strong>Council</strong> Coastal Zone Study<br />
Prepared for <strong>Wollongong</strong> <strong>City</strong> <strong>Council</strong><br />
Asset<br />
Notes<br />
2010<br />
2050<br />
2100<br />
National Estate –<br />
Austinmer Beach<br />
Geological Site<br />
Ecology<br />
ZRFC Extent √ √ √<br />
Inundation Extent √ √ √<br />
EEC Immediate Hazard Extent √ √ √<br />
Table 8.7: Risk Assessment: Thirroul Beach (see Figure 8.7 and Figure 8.20)<br />
Asset<br />
Notes<br />
2010<br />
2050<br />
2100<br />
Built Assets<br />
Roads<br />
Stormwater<br />
Infrastructure<br />
Land Parcels<br />
Assets Affected by<br />
Erosion Hazard<br />
Heritage<br />
Local Heritage<br />
State Heritage<br />
National Estate<br />
Ecology<br />
ZRFC Extent<br />
Inundation Extent √ √ √<br />
Immediate Hazard Extent √ √ √<br />
ZRFC Extent 29 32 35<br />
Inundation Extent 173 187 195<br />
Building on Mary Street √ √<br />
SLSC & car park Thirroul √ √ √<br />
Thirroul Saltwater Pool √ √ √<br />
ZRFC Extent √ √ √<br />
Inundation Extent √ √ √<br />
None present<br />
None present<br />
EEC Immediate Hazard Extent √ √ √<br />
√<br />
30 June 2010 Cardno Lawson Treloar Pty Ltd Page 70<br />
H:\Doc\2010\<strong>Report</strong>s.2010\Rep2564v2.Doc
<strong>Wollongong</strong> <strong>City</strong> <strong>Council</strong> Coastal Zone Study<br />
Prepared for <strong>Wollongong</strong> <strong>City</strong> <strong>Council</strong><br />
Table 8.8: Risk Assessment: McCauley’s Beach (see Figure 8.7 and Figure 8.20)<br />
Asset<br />
Notes<br />
2010<br />
2050<br />
2100<br />
Built Assets<br />
Roads<br />
ZRFC Extent<br />
Inundation Extent √ √ √<br />
√<br />
Stormwater Infrastructure Immediate Hazard Extent √<br />
Land Parcels<br />
Assets Affected by<br />
Erosion Hazard<br />
Heritage<br />
Local Heritage<br />
State Heritage<br />
National Estate<br />
ZRFC Extent 10 11 12<br />
Inundation Extent 29 29 29<br />
Cycleway √ √<br />
Sandon Point Tent Embassy<br />
√<br />
ZRFC Extent √ √ √<br />
Inundation Extent √ √ √<br />
None present<br />
None present<br />
Ecology<br />
EEC Immediate Hazard Extent √ √ √<br />
Table 8.9: Risk Assessment: Sandon Point Beach (see Figure 8.8 and Figure 8.21)<br />
Asset<br />
Notes<br />
2010<br />
2050<br />
2100<br />
Built Assets<br />
Roads<br />
ZRFC Extent √ √<br />
Inundation Extent √ √ √<br />
Stormwater Infrastructure Immediate Hazard Extent √ √ √<br />
Land Parcels<br />
Assets Affected by<br />
Erosion Hazard<br />
Heritage<br />
Local Heritage<br />
State Heritage<br />
National Estate<br />
ZRFC Extent 5 13 23<br />
Inundation Extent 24 60 85<br />
SLSC Sandon Point √ √ √<br />
ZRFC Extent √ √ √<br />
Inundation Extent √ √ √<br />
None present<br />
None present<br />
Ecology<br />
EEC Immediate Hazard Extent √ √ √<br />
30 June 2010 Cardno Lawson Treloar Pty Ltd Page 71<br />
H:\Doc\2010\<strong>Report</strong>s.2010\Rep2564v2.Doc
<strong>Wollongong</strong> <strong>City</strong> <strong>Council</strong> Coastal Zone Study<br />
Prepared for <strong>Wollongong</strong> <strong>City</strong> <strong>Council</strong><br />
Table 8.10: Risk Assessment: Bulli Beach (see Figure 8.8 and Figure 8.21)<br />
Asset<br />
Notes<br />
2010<br />
2050<br />
2100<br />
Built Assets<br />
Roads<br />
Stormwater<br />
Infrastructure<br />
Land Parcels<br />
Assets Affected by<br />
Erosion Hazard<br />
Heritage<br />
Local Heritage<br />
State Heritage<br />
National Estate<br />
Ecology<br />
ZRFC Extent<br />
30 June 2010 Cardno Lawson Treloar Pty Ltd Page 72<br />
H:\Doc\2010\<strong>Report</strong>s.2010\Rep2564v2.Doc<br />
Inundation Extent<br />
Immediate Hazard Extent<br />
ZRFC Extent 12 15 16<br />
Inundation Extent 24 45 55<br />
SLSC & car park Bulli √ √<br />
Bulli Rock Baths √ √ √<br />
Bulli Beach Holiday Park √ √<br />
Cycleway √ √ √<br />
ZRFC Extent √ √ √<br />
Inundation Extent √ √ √<br />
None present<br />
None present<br />
EEC Immediate Hazard Extent √ √ √<br />
Table 8.11: Risk Assessment: Woonona/Bellambi Beach (see Figure 8.9 and Figure 8.22)<br />
Asset<br />
Built Assets<br />
Roads<br />
Stormwater<br />
Infrastructure<br />
Land Parcels<br />
Assets Affected by<br />
Erosion Hazard<br />
Heritage<br />
Local Heritage<br />
State Heritage<br />
National Estate<br />
Ecology<br />
Notes<br />
ZRFC Extent √ √<br />
Inundation Extent √ √ √<br />
Immediate Hazard Extent √ √<br />
ZRFC Extent 9 17 29<br />
Inundation Extent 66 91 100<br />
SLSC Woonona<br />
SLSC Bellambi<br />
Cycleway √ √<br />
None present<br />
None present<br />
None present<br />
EEC Immediate Hazard Extent √ √ √<br />
2010<br />
2050<br />
2100<br />
√
<strong>Wollongong</strong> <strong>City</strong> <strong>Council</strong> Coastal Zone Study<br />
Prepared for <strong>Wollongong</strong> <strong>City</strong> <strong>Council</strong><br />
Table 8.12: Risk Assessment: Bellambi Harbour, Bellambi Point and Corrimal Beaches (see Figure 8.10<br />
and Figure 8.23)<br />
Asset<br />
Notes<br />
2010<br />
2050<br />
2100<br />
Built Assets<br />
Roads<br />
ZRFC Extent √ √ √<br />
Inundation Extent √ √ √<br />
Stormwater<br />
Infrastructure<br />
Land Parcels<br />
Assets Affected by<br />
Erosion Hazard<br />
Heritage<br />
Local Heritage<br />
State Heritage<br />
National Estate<br />
Ecology<br />
Immediate Hazard Extent (at Bellambi<br />
Boat Harbour)<br />
√ √ √<br />
ZRFC Extent 14 11 14<br />
Inundation Extent 58 63 79<br />
SLSCCorrimal<br />
Bellambi Tidal Rock Pool √ √ √<br />
Coast Guard √ √<br />
Sewage Treatment Works<br />
Buildings in Towradgi Park<br />
ZRFC Extent √ √ √<br />
Inundation Extent √ √ √<br />
None present<br />
None present<br />
EEC Immediate Hazard Extent √ √ √<br />
Table 8.13: Risk Assessment: Towradgi/Fairy Meadow & North <strong>Wollongong</strong> Beaches (see Figure 8.11<br />
and Figure 8.24)<br />
√<br />
Asset<br />
Notes<br />
2010<br />
2050<br />
2100<br />
Built Assets<br />
Roads<br />
Stormwater<br />
Infrastructure<br />
Land Parcels<br />
Assets Affected by<br />
Erosion Hazard<br />
ZRFC Extent<br />
Inundation Extent √ √ √<br />
Immediate Hazard Extent √ √ √<br />
ZRFC Extent 10 14 17<br />
Inundation Extent 13 14 22<br />
SLSC Towradgi<br />
SLSC Fairy Meadow<br />
SLSC North <strong>Wollongong</strong> & associated<br />
buildings<br />
√<br />
√ √ √<br />
Towradgi Tidal Rock Pool √ √ √<br />
30 June 2010 Cardno Lawson Treloar Pty Ltd Page 73<br />
H:\Doc\2010\<strong>Report</strong>s.2010\Rep2564v2.Doc
<strong>Wollongong</strong> <strong>City</strong> <strong>Council</strong> Coastal Zone Study<br />
Prepared for <strong>Wollongong</strong> <strong>City</strong> <strong>Council</strong><br />
Cycleway √ √<br />
Heritage<br />
Local Heritage<br />
ZRFC Extent √ √ √<br />
Inundation Extent √ √ √<br />
State Heritage Present √ √ √<br />
National Estate Present √ √ √<br />
Ecology<br />
EEC Immediate Hazard Extent √ √ √<br />
Table 8.14: Risk Assessment: <strong>Wollongong</strong> <strong>City</strong> / Coniston Beach (see Figure 8.12 and Figure 8.25)<br />
Asset<br />
Notes<br />
2010<br />
2050<br />
2100<br />
Built Assets<br />
Roads<br />
Stormwater<br />
Infrastructure<br />
Land Parcels<br />
Assets Affected by<br />
Erosion Hazard<br />
Heritage<br />
Local Heritage<br />
State Heritage<br />
National Estate<br />
Ecology<br />
None affected<br />
Immediate Hazard Extent<br />
ZRFC Extent 11 12 13<br />
Inundation Extent 12 12 13<br />
SLSC & associated buildings -<br />
<strong>Wollongong</strong> <strong>City</strong>; not affected<br />
Entertainment Centre /Stadium<br />
<strong>Wollongong</strong> Golf Course √ √ √<br />
Cycleway, promenade & associated<br />
infrastructure<br />
None present<br />
None present<br />
None present<br />
EEC Immediate Hazard Extent √ √ √<br />
√<br />
√<br />
√<br />
30 June 2010 Cardno Lawson Treloar Pty Ltd Page 74<br />
H:\Doc\2010\<strong>Report</strong>s.2010\Rep2564v2.Doc
<strong>Wollongong</strong> <strong>City</strong> <strong>Council</strong> Coastal Zone Study<br />
Prepared for <strong>Wollongong</strong> <strong>City</strong> <strong>Council</strong><br />
Table 8.15: Risk Assessment: Perkins Beach (see Figure 8.13 and Figure 8.26)<br />
Asset<br />
Notes<br />
2010<br />
2050<br />
2100<br />
Built Assets<br />
Roads<br />
Stormwater<br />
Infrastructure<br />
Land Parcels<br />
Assets Affected by<br />
Erosion Hazard<br />
Heritage<br />
Local Heritage<br />
State Heritage<br />
National Estate -<br />
Lake Illawarra,<br />
Foreshore and<br />
Catchment<br />
None affected<br />
Immediate Hazard Extent √ √ √<br />
ZRFC Extent 6 7 8<br />
Inundation Extent 7 7 7<br />
SLSC Windang; not affected<br />
Port Kembla Saltwater Pool Not affected<br />
None affected<br />
None present<br />
ZRFC Extent √ √ √<br />
Inundation Extent √ √ √<br />
Ecology<br />
EEC Immediate Hazard Extent √ √ √<br />
Table 8.16: Risk Assessment: Lake Illawarra (see Figures 8.27 A-C)<br />
Asset<br />
Notes<br />
2010<br />
2050<br />
2100<br />
Built Assets<br />
Roads Inundation Extent √ √ √<br />
Land Parcels Inundation Extent 176 343 674<br />
Heritage<br />
Local Heritage Inundation Extent √ √ √<br />
State Heritage<br />
National Estate - Lake<br />
Illawarra, Foreshore<br />
and Catchment<br />
None present<br />
Inundation Extent √ √ √<br />
30 June 2010 Cardno Lawson Treloar Pty Ltd Page 75<br />
H:\Doc\2010\<strong>Report</strong>s.2010\Rep2564v2.Doc
<strong>Wollongong</strong> <strong>City</strong> <strong>Council</strong> Coastal Zone Study<br />
Prepared for <strong>Wollongong</strong> <strong>City</strong> <strong>Council</strong><br />
Table 8.17: Land Parcels affected by Coastal-Influenced Geotechnical Hazard Extents, by Suburb<br />
Suburb<br />
Count<br />
Woonona 7<br />
Bulli 37<br />
Otford 2<br />
Scarborough 51<br />
Thirroul 47<br />
Clifton 28<br />
Austinmer 56<br />
Stanwell Park 39<br />
Wombarra 128<br />
Coledale 70<br />
Coalcliff 93<br />
Kanahooka 69<br />
Primbee 116<br />
Lake Heights 74<br />
Warrawong 44<br />
Port Kembla 45<br />
Berkeley 8<br />
<strong>Wollongong</strong> 11<br />
Yallah 3<br />
North <strong>Wollongong</strong> 2<br />
Bellambi 10<br />
Stanwell Tops 1<br />
Koonawarra 3<br />
Towradgi 3<br />
TOTAL 947<br />
30 June 2010 Cardno Lawson Treloar Pty Ltd Page 76<br />
H:\Doc\2010\<strong>Report</strong>s.2010\Rep2564v2.Doc
<strong>Wollongong</strong> <strong>City</strong> <strong>Council</strong> Coastal Zone Study<br />
Prepared for <strong>Wollongong</strong> <strong>City</strong> <strong>Council</strong><br />
9 Qualifications and Assumptions<br />
The methodology and approach to this study have been developed in consultation with<br />
<strong>Wollongong</strong> <strong>City</strong> <strong>Council</strong> and the DECCW. The following qualifications and assumptions<br />
apply to the analyses undertaken and data used as part of this study:<br />
Wave Climate<br />
30 June 2010 Cardno Lawson Treloar Pty Ltd Page 77<br />
H:\Doc\2010\<strong>Report</strong>s.2010\Rep2564v2.Doc<br />
Nearshore wave climate was developed from numerical<br />
modelling of the coastal region. This modelling relied on the<br />
following information:<br />
• Extremal wave statistics for boundary conditions.<br />
• Bathymetric detail.<br />
The measurement and collection of this data was undertaken<br />
by third parties and its accuracy cannot be guaranteed by<br />
Cardno.<br />
Bathymetric information was obtained from all available<br />
reliable sources and where deficient was modified by Cardno<br />
through inspection of aerial photographs to ensure all<br />
significant nearshore features are described.<br />
Sea Level Rise A sea level rise of 0.4m to 2050 and 0.9m to 2100 from 1990<br />
levels was applied in this study. These values have been<br />
adopted based on the <strong>NSW</strong> State <strong>Government</strong> Sea Level Rise<br />
Policy (DECCW, 2009a) and no effort has been made to<br />
reassess these benchmarks.<br />
Historical Beach<br />
Change<br />
Storm Demand<br />
Calculations<br />
Future Shoreline<br />
Recession<br />
Coastal Inundation<br />
Photogrammetric data supplied by the DECCW was used in<br />
the analysis of historical beach change. This analysis was<br />
limited by the temporal resolution of the data set, which limits<br />
the ability to estimate event caused beach changes and<br />
shorter term beach fluctuations. The accuracy of this<br />
information is maintained by the DECCW.<br />
Numerical profile modelling was undertaken to quantify storm<br />
demand volumes along beach compartments. No data was<br />
available for calibration of these models; however, site specific<br />
sediment grain size data and detail of the underlying strata<br />
were included (where present) and realistic model parameters<br />
applied. While the outcomes are not a direct measure of the<br />
100-years ARI storm demand the model results were used to<br />
assess the relative beach exposure to storm erosion, and is<br />
considered realistic for this purpose.<br />
Future shoreline recession as a result of sea level rise was<br />
assessed by application of the Bruun Rule. The use of this<br />
rule along coastlines with complex bathymetric and shoreline<br />
features has been questioned by many researchers due to the<br />
fact that is was initially developed for uniform sandy<br />
unconsolidated shorelines. However, no easily applied<br />
scientifically robust alternative currently exists and State<br />
<strong>Government</strong> Policy currently promotes its use while<br />
acknowledging these points DECCW (2009c). To this end, a<br />
‘modified’ approach to the application of the rule has been<br />
adopted taking account of site specific features such as rock<br />
shelves.<br />
Hydrodynamic modelling of wave overtopping of the foreshore<br />
area was undertaken using a 2D hydraulic numerical scheme<br />
developed for overland flow investigations. Building structures<br />
and infrastructure features were not included in the models
<strong>Wollongong</strong> <strong>City</strong> <strong>Council</strong> Coastal Zone Study<br />
Prepared for <strong>Wollongong</strong> <strong>City</strong> <strong>Council</strong><br />
Erosion Hazard<br />
Mapping<br />
description of the foreshore area, and the results are<br />
considered conservative. No information was available to<br />
verify the model output although modelling outcomes derived<br />
for this and other studies has agreed well with anecdotal<br />
evidence of wave overtopping during severe storms at<br />
Austinmer, Kiama and Avoca. The modelling describes the<br />
foreshore terrain from high resolution ALS data and therefore<br />
is able to describe both the wave inundation and return flow via<br />
realistic flow paths over the foreshore area.<br />
Erosion hazard lines are intended to guide coastal planning<br />
and are not intended to describe an absolute event or<br />
outcome, but instead are used to designate an area of<br />
foreshore that may be at risk from coastal hazards. The<br />
mapping of these hazards was undertaken using industry<br />
standard and government endorsed methodologies.<br />
The mapping is based on the definition of a mean profile. This<br />
was generated from available photogrammetric information,<br />
which describes historical beach change, albeit at low temporal<br />
resolution. This approach takes account of beach processes<br />
such as beach rotation where they are described by the data.<br />
Coastal Features • The comments reported as personal communications<br />
or gathered via consultation do not necessarily<br />
represent the views of Cardno or <strong>Council</strong>.<br />
• The list of issues provided in Appendix G were<br />
compiled through consultation with a range of<br />
individuals and organisations. They do not necessarily<br />
represent the views of Cardno or <strong>Council</strong>.<br />
• The information presented in Section 7 was compiled<br />
based on a desktop assessment of available<br />
information. No detailed site inspections were<br />
undertaken for ground-truthing purposes.<br />
• Vegetation Assessment – The areas in Table 7.3<br />
represent a net change in vegetation across the 30<br />
years time frame. The quality of aerial photographs<br />
was variable from year to year and the data has not<br />
been ground-truthed.<br />
• This document in no way represents a detailed<br />
environmental assessment for development purposes.<br />
Risk Assessment • The risk assessment presented in Section 8 is<br />
preliminary in nature. It is based on an assessment of<br />
a limited number of attributes for which spatial<br />
mapping was readily available and the accuracy of that<br />
available mapping is variable.<br />
• Numbers of land parcels affected by coastal hazards<br />
were defined by <strong>Council</strong> and provided to Cardno for<br />
the purposes of this study.<br />
• A detailed risk assessment should be undertaken on a<br />
site specific basis.<br />
30 June 2010 Cardno Lawson Treloar Pty Ltd Page 78<br />
H:\Doc\2010\<strong>Report</strong>s.2010\Rep2564v2.Doc
<strong>Wollongong</strong> <strong>City</strong> <strong>Council</strong> Coastal Zone Study<br />
Prepared for <strong>Wollongong</strong> <strong>City</strong> <strong>Council</strong><br />
10 Conclusions and Recommendations<br />
This report describes the outcomes of coastal processes investigation and coastal hazards<br />
determination for the coastal beaches of the <strong>Wollongong</strong> LGA. Specifically these hazards<br />
are:-<br />
• Shoreline recession and storm erosion<br />
• Wave run-up and back-beach inundation<br />
• Coastal Geotechnical Hazard Zone<br />
The investigations have been based on coastal area survey/GIS data and historical<br />
photogrammetric data provided by <strong>Council</strong> and DECCW. <strong>Council</strong> also undertook site<br />
specific geotechnical investigations in order to assess the presence and upper level of any<br />
underlying rock shelves at selected beaches.<br />
It was found that there is presently no evidence of long term shoreline recession or loss of<br />
beach volume.<br />
Detailed wave modelling was undertaken to describe the relative exposure of the<br />
nominated beaches to Tasman Sea storm waves and to describe wave run-up levels along<br />
the shoreline cliff areas. These parameters were also utilised to define storm demand<br />
volumes along the sandy unconsolidated shorelines.<br />
Sub-consultants GHD Geotechnics were engaged to assess the impacts of coastal<br />
processes on geotechnical hazards within the LGA, including climate change<br />
considerations. This resulted in the definition of a Coastal Influenced Geotechnical Hazard<br />
Zone that compliments <strong>Council</strong>’s existing planning protocols.<br />
Erosion and Inundation Hazard extents were developed for beach compartments<br />
considering the storm demand and wave overtopping for a 100-years ARI event for the<br />
present day and out to the 2100 planning horizon. These hazard definitions will form the<br />
basis of <strong>Council</strong>’s foreshore planning policy.<br />
This study has addressed Stages 2 and 3 of the Coastal Management Process (Section<br />
1.3). <strong>Council</strong> may now proceed with the preparation of the <strong>Wollongong</strong> Coastal<br />
Management Study and Plan.<br />
30 June 2010 Cardno Lawson Treloar Pty Ltd Page 79<br />
H:\Doc\2010\<strong>Report</strong>s.2010\Rep2564v2.Doc
<strong>Wollongong</strong> <strong>City</strong> <strong>Council</strong> Coastal Zone Study<br />
Prepared for <strong>Wollongong</strong> <strong>City</strong> <strong>Council</strong><br />
11 References<br />
AGSO, (2000) Natural hazards and the risks they pose to South-East Queensland.<br />
Australian Geological Survey Organisation, Canberra, Australia.<br />
Cardno (2005) Fairy, Towradgi and Hewitts/Tramway Creeks Estuary management Study<br />
and Plan. Prepared by Cardno Lawson Treloar for <strong>Wollongong</strong> <strong>City</strong> <strong>Council</strong>, November.<br />
Cardno (2009) A Climate Change Impact Assessment of <strong>Wollongong</strong>’s Estuaries –<br />
Implications for Ongoing Estuary Management Planning. Prepared by Cardno Lawson<br />
Treloar for <strong>Wollongong</strong> <strong>City</strong> <strong>Council</strong>, December.<br />
Cardno (2010). Lake Illawarra Floodplain Risk Management Study - Draft. Prepared for<br />
Lake Illawarra Authority, <strong>Wollongong</strong> <strong>City</strong> <strong>Council</strong> and Shellharbour <strong>City</strong> <strong>Council</strong>. May<br />
2010.<br />
Carley, J. T., and Cox, R. J. (2001) A Methodology for Using Time-Dependent Beach<br />
Erosion Models for Design Events. Proceedings of Coasts and Ports Australasian<br />
Conference 2003. Auckland.<br />
Church, J., Hunter, J., McInnes, K. L. and White, N. J. (2006) Sea-Level Rise Around the<br />
Australian Coastline and the Changing Frequency of Extreme Sea-Level Events.<br />
Australian Meteorological Magazine, 55(4), pp: 253-260.<br />
Cooper, J.A.G., and Pilkey, O.H. (2004) Sea-level Rise and Shoreline Retreat: Time to<br />
Abandon the Bruun Rule. Global and Planetary Change, 43: 157-171.<br />
CSIRO (2007) Climate Change in Australia – Technical <strong>Report</strong>. Published by<br />
Commonwealth Scientific and Industrial Research Organisation and Bureau of<br />
Meteorology. October 2007<br />
DCC (2009) Climate Changes Risks to Australia’s Coast: A First Pass National<br />
Assessment. Commonwealth of Australia.<br />
Dean (2002) Beach Nourishment Theory and Practice. World Scientific Advanced Series<br />
on Ocean Engineering – Volume 18.<br />
DECC (2008) Summary of Climate Change Impacts on the Illawarra Region, <strong>NSW</strong> Climate<br />
Change Action Plan. <strong>NSW</strong> <strong>Government</strong>.<br />
DECCW (2009a) <strong>NSW</strong> Sea Level Rise Policy Statement.<br />
Environment, Climate Change and Water.<br />
<strong>NSW</strong> Department of<br />
DECCW (2009b) Derivation of the <strong>NSW</strong> <strong>Government</strong>’s Sea Level Rise Planning<br />
Benchmarks. Technical Note. <strong>NSW</strong> Department of Environment, Climate Change and<br />
Water.<br />
DECCW (2009c) Draft Coastal Risk Management Guide: Incorporating Sea Level Rise<br />
Benchmarks in Coastal Risk Assessments. <strong>NSW</strong> Department of Environment, Climate<br />
Change and Water.<br />
30 June 2010 Cardno Lawson Treloar Pty Ltd Page 80<br />
H:\Doc\2010\<strong>Report</strong>s.2010\Rep2564v2.Doc
<strong>Wollongong</strong> <strong>City</strong> <strong>Council</strong> Coastal Zone Study<br />
Prepared for <strong>Wollongong</strong> <strong>City</strong> <strong>Council</strong><br />
DECCW (2010, in prep.) Sea Level Rise Design Parameters for Sydney Harbour. <strong>NSW</strong><br />
Department of Environment, Climate Change and Water.<br />
DoP (2009). Draft <strong>NSW</strong> Coastal Planning Guideline: Adapting to Sea Level Rise.<br />
Consultation Draft – Not <strong>Government</strong> Policy. October 2009. <strong>NSW</strong> Department of Planning.<br />
Gordon, A. D. (1987) Beach Fluctuation and Shoreline Change – <strong>NSW</strong>. Proceedings of<br />
Coasts and Ports 1987, Launceston Tasmania.<br />
Hasselmann, K., Barnett, T.P., Bouws, E., Carlson, H., Cartwright, D.E., Enke, K., Ewing,<br />
J.A., Gienapp, H., Hasselmann, D.E., Kruseman, P., Meerburg, A., Muller, P., Olbers, D.J.,<br />
Richter, K., Sell, W. and Walden, H. (1973) Measurements of Wind-Wave Growth and<br />
Swell Decay during the Joint North Sea Wave Project (JO<strong>NSW</strong>AP). Ergnzungsheft zur<br />
Deutschen Hydrographischen Zeitschrift Reihe, Vol. 8, Issue.12.<br />
Hazelwood, M. (2007) Climate Change and Coastal Communities: An Assessment of the<br />
Impact of Sea Level Rise on Four <strong>Wollongong</strong> Beaches. Honours Thesis, Bachelor of<br />
Environmental Science, Faculty of Science, University of <strong>Wollongong</strong>, pp: 137.<br />
Hennessy, K., McInnes, K., Abbs, D., Jones, R., Bathols, J., Suppiah, R., Ricketts, J.,<br />
Rafter, T., Collins, D., and Jones, D. (2004) Climate Change in New South Wales. Part 2:<br />
Projected changes in climate extremes. CSIRO consultancy report prepared for the <strong>NSW</strong><br />
Greenhouse Office.<br />
Holper, P., Abbs, D., McInnes, K., and Tork, S. (2005) Potential Impacts of Climate Change<br />
on the Kiama Local <strong>Government</strong> Area. <strong>Report</strong> prepared by the CSIRO for Kiama Municipal<br />
<strong>Council</strong>, March 2005.<br />
Hughes S. A. (2005) Estimating Irregular Wave Runup on Rough, Impermeable Slopes.<br />
U.S Army Corp of Engineers ERDC/CHL CHETN-III-70. July 2005.<br />
IPCC (2007) Climate Change 2007: Synthesis <strong>Report</strong>. An Assessment of the<br />
Intergovernmental Panel on Climate Change. IPCC: Geneva, Switzerland.<br />
Iris Research (2008) <strong>Wollongong</strong> – Regional Statistics. Online:<br />
http://www.iris.org.au/index.pl?page=221. Accessed 1 April 2010.<br />
Lord, D., and Kulmar, M. (2000) The 1974 Storms Revisited: 25 Years Experience in<br />
Ocean Wave Measurements along the South-East Australian Coast. Proceedings of the<br />
27 th International Conference on Coastal Engineering, Sydney, VI pp 559-572, July 2000.<br />
McInnes, K., Walsh, K., Whetton, P., and Pittock, B. (1998) The Impact of Climate Change<br />
on Coastal <strong>NSW</strong>, Final <strong>Report</strong>: <strong>Report</strong> on Research Undertaken for the National<br />
Greenhouse Advisory Committee. CSIRO Atmospheric Research, July 1998.<br />
MHL (1992) Mid New South Wales Coastal Region Tide-Storm Surge Analysis. Manly<br />
Hydraulics Laboratory. <strong>Report</strong> No. MHL621 – October 1992.<br />
National Tide Tables (2010) Australian Hydro-graphic Publication 11. Department of<br />
Defence, Commonwealth of Australia.<br />
30 June 2010 Cardno Lawson Treloar Pty Ltd Page 81<br />
H:\Doc\2010\<strong>Report</strong>s.2010\Rep2564v2.Doc
<strong>Wollongong</strong> <strong>City</strong> <strong>Council</strong> Coastal Zone Study<br />
Prepared for <strong>Wollongong</strong> <strong>City</strong> <strong>Council</strong><br />
Nielsen A.F., Lord D.B. and Poulos, H.G. (1992) Dune stability considerations for building<br />
foundations, Civil Engineering Transactions of the Institute of Engineers Australia, CE34(2)<br />
June, 167–74.<br />
NPWS (2003) Native Vegetation of the Illawarra Escarpment and Coastal Plain. <strong>NSW</strong><br />
National Parks and Wildlife Service.<br />
<strong>NSW</strong> <strong>Government</strong> (1990) <strong>NSW</strong> Coastline Management Manual. New South Wales<br />
<strong>Government</strong>, September 1990.<br />
<strong>NSW</strong> <strong>Government</strong> (2007) Coastal Zone Management Manual Draft.<br />
Organ, M.K. and Speechley, C. (1997) Illawarra Aborigines - An Introductory History, in<br />
Hagan, JS and Wells, A (eds), A History of <strong>Wollongong</strong>, University of <strong>Wollongong</strong> Press,<br />
1997, 7-22..<br />
PKPC (2007). Port Kembla. Online: http://www.kemblaport.com.au/. Accessed 1 April 2010.<br />
PIANC (1992) Guidelines for the Design and Construction of Flexible Revetments<br />
Incorporating Geotextiles in Marine Environment.<br />
Ranasinghe, R., Watson, P., Lord, D., Hanslow, D. and Cowell, P. (2007). Sea Level Rise,<br />
Coastal Recession and the Bruun Rule. Proceedings of the 18th Australasian Coastal and<br />
Ocean Engineering Conference, July 2007.<br />
Roy, P.S. (1984) New South Wales Estuaries: Their Origin and Evolution, In B.G. Thom<br />
(Ed.) Coastal Geomorphology in Australia. Academic Press, Australia, pp. 99-121.<br />
Roy, P.S., Williams, R.J., Jones, A. R., Yassini, I., Gibbs, P.J., Coates, B., West, R.J.,<br />
Scanes, P.R., Hudson, J.P. and Nichol, S. (2001) Structure and Function of South-east<br />
Australian Estuaries. Estuarine, Coastal and Shelf Science, 53, 351-384.<br />
SPM (1984) Shoreline Protection Manual, 4 th edition. Coastal Engineering Research<br />
Centre, U.S. Department of the Army, Washington, D.C.<br />
Stelling, G. S., and Duinmeijer, S. P. A. (2003) A staggered conservative scheme for every<br />
Froude number in rapidly varied shallow water flows. International Journal Numerical<br />
Methods In Fluids 43: 1329-1354.<br />
Tourism Research Australia (2008) Tourism Profiles for Local <strong>Government</strong> Areas in<br />
Regional Australia, New South Wales: <strong>City</strong> of <strong>Wollongong</strong>.<br />
Tru Energy (2009) Welcome to Tallawarra. Online:<br />
http://www.truenergy.com.au/Production/Tallawarra/Index.xhtml. Accessed 1 April 2010.<br />
USACE (2002) Coastal Engineering Manual. U.S. Army Corps of Engineers, Washington,<br />
DC April 2002<br />
WBM (2005) Coastal Hazard Line Assessment for Corrimal Beach. WBM Oceanic<br />
Australia, Prepared for <strong>Wollongong</strong> <strong>City</strong> <strong>Council</strong>. L.N0964.003. May 2005.<br />
30 June 2010 Cardno Lawson Treloar Pty Ltd Page 82<br />
H:\Doc\2010\<strong>Report</strong>s.2010\Rep2564v2.Doc
<strong>Wollongong</strong> <strong>City</strong> <strong>Council</strong> Coastal Zone Study<br />
Prepared for <strong>Wollongong</strong> <strong>City</strong> <strong>Council</strong><br />
WCC (2007) <strong>Wollongong</strong> Wide Water Quality Monitoring Program 2002-2006. Prepared by<br />
<strong>Wollongong</strong> <strong>City</strong> <strong>Council</strong>.<br />
WCC (2010) Local Environmental Plan (LEP). Online:<br />
http://www.wollongong.nsw.gov.au/lep.asp. Accessed 1 April 2010.<br />
Wesson, S. (2005) Murni, Dhungang, Jirrar: Living in the Illawarra – Aboriginal people and<br />
wild resource use. <strong>NSW</strong> Department of Environment and Conservation.<br />
30 June 2010 Cardno Lawson Treloar Pty Ltd Page 83<br />
H:\Doc\2010\<strong>Report</strong>s.2010\Rep2564v2.Doc