Static and Dynamic Yield Stresses of Aerosil® 200 Suspensions in ...
Static and Dynamic Yield Stresses of Aerosil® 200 Suspensions in ...
Static and Dynamic Yield Stresses of Aerosil® 200 Suspensions in ...

Create successful ePaper yourself
Turn your PDF publications into a flip-book with our unique Google optimized e-Paper software.
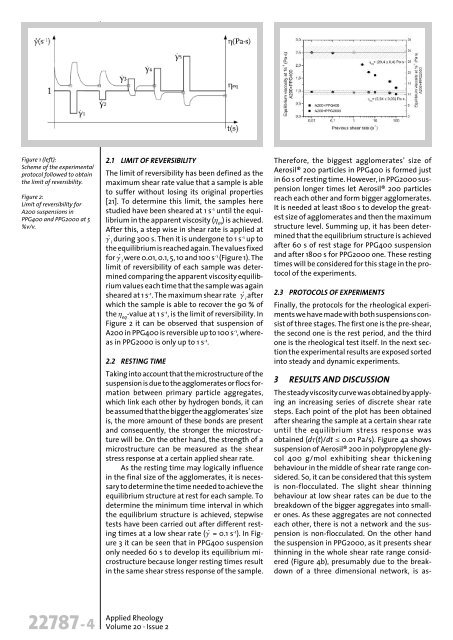
Figure 1 (left):<br />
Scheme <strong>of</strong> the experimental<br />
protocol followed to obta<strong>in</strong><br />
the limit <strong>of</strong> reversibility.<br />
Figure 2:<br />
Limit <strong>of</strong> reversibility for<br />
A<strong>200</strong> suspensions <strong>in</strong><br />
PPG400 <strong>and</strong> PPG<strong>200</strong>0 at 5<br />
%v/v.<br />
2.1 LIMIT OF REVERSIBILITY<br />
The limit <strong>of</strong> reversibility has been def<strong>in</strong>ed as the<br />
maximum shear rate value that a sample is able<br />
to suffer without los<strong>in</strong>g its orig<strong>in</strong>al properties<br />
[21]. To determ<strong>in</strong>e this limit, the samples here<br />
studied have been sheared at 1 s -1 until the equilibrium<br />
<strong>in</strong> the apparent viscosity (h m<br />
) is achieved.<br />
After this, a step wise <strong>in</strong> shear rate is applied at<br />
g· dur<strong>in</strong>g 300 s. Then it is undergone to 1 i s-1 up to<br />
the equilibrium is reached aga<strong>in</strong>. The values fixed<br />
for g· were 0.01, 0.1, 5, 10 <strong>and</strong> 100 i s-1 (Figure 1). The<br />
limit <strong>of</strong> reversibility <strong>of</strong> each sample was determ<strong>in</strong>ed<br />
compar<strong>in</strong>g the apparent viscosity equilibrium<br />
values each time that the sample was aga<strong>in</strong><br />
sheared at 1 s -1 . The maximum shear rate g· after i<br />
which the sample is able to recover the 90 % <strong>of</strong><br />
the h eq<br />
-value at 1 s -1 , is the limit <strong>of</strong> reversibility. In<br />
Figure 2 it can be observed that suspension <strong>of</strong><br />
A<strong>200</strong> <strong>in</strong> PPG400 is reversible up to 100 s -1 , whereas<br />
<strong>in</strong> PPG<strong>200</strong>0 is only up to 1 s -1 .<br />
2.2 RESTING TIME<br />
Tak<strong>in</strong>g <strong>in</strong>to account that the microstructure <strong>of</strong> the<br />
suspension is due to the agglomerates or flocs formation<br />
between primary particle aggregates,<br />
which l<strong>in</strong>k each other by hydrogen bonds, it can<br />
be assumed that the bigger the agglomerates’ size<br />
is, the more amount <strong>of</strong> these bonds are present<br />
<strong>and</strong> consequently, the stronger the microstructure<br />
will be. On the other h<strong>and</strong>, the strength <strong>of</strong> a<br />
microstructure can be measured as the shear<br />
stress response at a certa<strong>in</strong> applied shear rate.<br />
As the rest<strong>in</strong>g time may logically <strong>in</strong>fluence<br />
<strong>in</strong> the f<strong>in</strong>al size <strong>of</strong> the agglomerates, it is necessary<br />
to determ<strong>in</strong>e the time needed to achieve the<br />
equilibrium structure at rest for each sample. To<br />
determ<strong>in</strong>e the m<strong>in</strong>imum time <strong>in</strong>terval <strong>in</strong> which<br />
the equilibrium structure is achieved, stepwise<br />
tests have been carried out after different rest<strong>in</strong>g<br />
times at a low shear rate (g· = 0.1 s -1 ). In Figure<br />
3 it can be seen that <strong>in</strong> PPG400 suspension<br />
only needed 60 s to develop its equilibrium mi -<br />
cro structure because longer rest<strong>in</strong>g times result<br />
<strong>in</strong> the same shear stress response <strong>of</strong> the sample.<br />
Therefore, the biggest agglomerates’ size <strong>of</strong><br />
<strong>Aerosil®</strong> <strong>200</strong> particles <strong>in</strong> PPG400 is formed just<br />
<strong>in</strong> 60 s <strong>of</strong> rest<strong>in</strong>g time. However, <strong>in</strong> PPG<strong>200</strong>0 suspension<br />
longer times let <strong>Aerosil®</strong> <strong>200</strong> particles<br />
reach each other <strong>and</strong> form bigger agglomerates.<br />
It is needed at least 1800 s to develop the greatest<br />
size <strong>of</strong> agglomerates <strong>and</strong> then the maximum<br />
structure level. Summ<strong>in</strong>g up, it has been determ<strong>in</strong>ed<br />
that the equilibrium structure is achieved<br />
after 60 s <strong>of</strong> rest stage for PPG400 suspension<br />
<strong>and</strong> after 1800 s for PPG<strong>200</strong>0 one. These rest<strong>in</strong>g<br />
times will be considered for this stage <strong>in</strong> the protocol<br />
<strong>of</strong> the experiments.<br />
2.3 PROTOCOLS OF EXPERIMENTS<br />
F<strong>in</strong>ally, the protocols for the rheological experiments<br />
we have made with both suspensions consist<br />
<strong>of</strong> three stages. The first one is the pre-shear,<br />
the second one is the rest period, <strong>and</strong> the third<br />
one is the rheological test itself. In the next section<br />
the experimental results are exposed sorted<br />
<strong>in</strong>to steady <strong>and</strong> dynamic experiments.<br />
3 RESULTS AND DISCUSSION<br />
The steady viscosity curve was obta<strong>in</strong>ed by apply<strong>in</strong>g<br />
an <strong>in</strong>creas<strong>in</strong>g series <strong>of</strong> discrete shear rate<br />
steps. Each po<strong>in</strong>t <strong>of</strong> the plot has been obta<strong>in</strong>ed<br />
after shear<strong>in</strong>g the sample at a certa<strong>in</strong> shear rate<br />
until the equilibrium stress response was<br />
obta<strong>in</strong>ed (dt(t)/dt £ 0.01 Pa/s). Figure 4a shows<br />
suspension <strong>of</strong> <strong>Aerosil®</strong> <strong>200</strong> <strong>in</strong> polypropylene glycol<br />
400 g/mol exhibit<strong>in</strong>g shear thicken<strong>in</strong>g<br />
behaviour <strong>in</strong> the middle <strong>of</strong> shear rate range considered.<br />
So, it can be considered that this system<br />
is non-flocculated. The slight shear th<strong>in</strong>n<strong>in</strong>g<br />
behaviour at low shear rates can be due to the<br />
breakdown <strong>of</strong> the bigger aggregates <strong>in</strong>to smaller<br />
ones. As these aggregates are not connected<br />
each other, there is not a network <strong>and</strong> the suspension<br />
is non-flocculated. On the other h<strong>and</strong><br />
the suspension <strong>in</strong> PPG<strong>200</strong>0, as it presents shear<br />
th<strong>in</strong>n<strong>in</strong>g <strong>in</strong> the whole shear rate range considered<br />
(Figure 4b), presumably due to the breakdown<br />
<strong>of</strong> a three dimensional network, is as -<br />
22787-4<br />
Applied Rheology<br />
Volume 20 · Issue 2