Static and Dynamic Yield Stresses of Aerosil® 200 Suspensions in ...
Static and Dynamic Yield Stresses of Aerosil® 200 Suspensions in ...
Static and Dynamic Yield Stresses of Aerosil® 200 Suspensions in ...

Create successful ePaper yourself
Turn your PDF publications into a flip-book with our unique Google optimized e-Paper software.
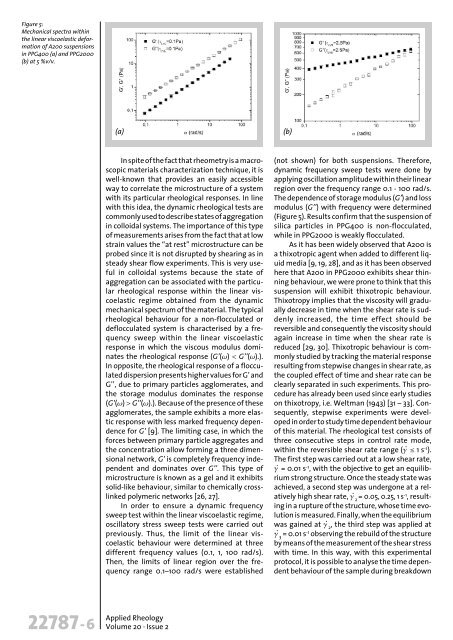
Figure 5:<br />
Mechanical spectra with<strong>in</strong><br />
the l<strong>in</strong>ear viscoelastic deformation<br />
<strong>of</strong> A<strong>200</strong> suspensions<br />
<strong>in</strong> PPG400 (a) <strong>and</strong> PPG<strong>200</strong>0<br />
(b) at 5 %v/v.<br />
(a)<br />
(b)<br />
In spite <strong>of</strong> the fact that rheometry is a macroscopic<br />
materials characterization technique, it is<br />
well-known that provides an easily accessible<br />
way to correlate the microstructure <strong>of</strong> a system<br />
with its particular rheological responses. In l<strong>in</strong>e<br />
with this idea, the dynamic rheological tests are<br />
commonly used to describe states <strong>of</strong> aggregation<br />
<strong>in</strong> colloidal systems. The importance <strong>of</strong> this type<br />
<strong>of</strong> measurements arises from the fact that at low<br />
stra<strong>in</strong> values the “at rest” microstructure can be<br />
probed s<strong>in</strong>ce it is not disrupted by shear<strong>in</strong>g as <strong>in</strong><br />
steady shear flow experiments. This is very useful<br />
<strong>in</strong> colloidal systems because the state <strong>of</strong><br />
aggregation can be associated with the particular<br />
rheological response with<strong>in</strong> the l<strong>in</strong>ear viscoelastic<br />
regime obta<strong>in</strong>ed from the dynamic<br />
mechanical spectrum <strong>of</strong> the material. The typical<br />
rheological behaviour for a non-flocculated or<br />
deflocculated system is characterised by a frequency<br />
sweep with<strong>in</strong> the l<strong>in</strong>ear viscoelastic<br />
response <strong>in</strong> which the viscous modulus dom<strong>in</strong>ates<br />
the rheological response (G’(w) < G’’(w).).<br />
In opposite, the rheological response <strong>of</strong> a flocculated<br />
dispersion presents higher values for G’ <strong>and</strong><br />
G’’, due to primary particles agglomerates, <strong>and</strong><br />
the storage modulus dom<strong>in</strong>ates the response<br />
(G’(w) > G’’(w).). Because <strong>of</strong> the presence <strong>of</strong> these<br />
agglomerates, the sample exhibits a more elastic<br />
response with less marked frequency dependence<br />
for G’ [9]. The limit<strong>in</strong>g case, <strong>in</strong> which the<br />
forces between primary particle aggregates <strong>and</strong><br />
the concentration allow form<strong>in</strong>g a three dimensional<br />
network, G’ is completely frequency <strong>in</strong>dependent<br />
<strong>and</strong> dom<strong>in</strong>ates over G’’. This type <strong>of</strong><br />
microstructure is known as a gel <strong>and</strong> it exhibits<br />
solid-like behaviour, similar to chemically crossl<strong>in</strong>ked<br />
polymeric networks [26, 27].<br />
In order to ensure a dynamic frequency<br />
sweep test with<strong>in</strong> the l<strong>in</strong>ear viscoelastic regime,<br />
oscillatory stress sweep tests were carried out<br />
previously. Thus, the limit <strong>of</strong> the l<strong>in</strong>ear viscoelastic<br />
behaviour were determ<strong>in</strong>ed at three<br />
different frequency values (0.1, 1, 100 rad/s).<br />
Then, the limits <strong>of</strong> l<strong>in</strong>ear region over the frequency<br />
range 0.1–100 rad/s were established<br />
(not shown) for both suspensions. Therefore,<br />
dynamic frequency sweep tests were done by<br />
apply<strong>in</strong>g oscillation amplitude with<strong>in</strong> their l<strong>in</strong>ear<br />
region over the frequency range 0.1 - 100 rad/s.<br />
The dependence <strong>of</strong> storage modulus (G’) <strong>and</strong> loss<br />
modulus (G’’) with frequency were determ<strong>in</strong>ed<br />
(Figure 5). Results confirm that the suspension <strong>of</strong><br />
silica particles <strong>in</strong> PPG400 is non-flocculated,<br />
while <strong>in</strong> PPG<strong>200</strong>0 is weakly flocculated.<br />
As it has been widely observed that A<strong>200</strong> is<br />
a thixotropic agent when added to different liquid<br />
media [9, 19, 28], <strong>and</strong> as it has been observed<br />
here that A<strong>200</strong> <strong>in</strong> PPG<strong>200</strong>0 exhibits shear th<strong>in</strong>n<strong>in</strong>g<br />
behaviour, we were prone to th<strong>in</strong>k that this<br />
suspension will exhibit thixotropic behaviour.<br />
Thixotropy implies that the viscosity will gradually<br />
decrease <strong>in</strong> time when the shear rate is suddenly<br />
<strong>in</strong>creased, the time effect should be<br />
reversible <strong>and</strong> consequently the viscosity should<br />
aga<strong>in</strong> <strong>in</strong>crease <strong>in</strong> time when the shear rate is<br />
reduced [29, 30]. Thixotropic behaviour is commonly<br />
studied by track<strong>in</strong>g the material response<br />
result<strong>in</strong>g from stepwise changes <strong>in</strong> shear rate, as<br />
the coupled effect <strong>of</strong> time <strong>and</strong> shear rate can be<br />
clearly separated <strong>in</strong> such experiments. This procedure<br />
has already been used s<strong>in</strong>ce early studies<br />
on thixotropy, i.e. Weltman (1943) [31 – 33]. Consequently,<br />
stepwise experiments were developed<br />
<strong>in</strong> order to study time dependent behaviour<br />
<strong>of</strong> this material. The rheological test consists <strong>of</strong><br />
three consecutive steps <strong>in</strong> control rate mode,<br />
with<strong>in</strong> the reversible shear rate range (g· £ 1 s -1 ).<br />
The first step was carried out at a low shear rate,<br />
g· = 0.01 s -1 , with the objective to get an equilibrium<br />
strong structure. Once the steady state was<br />
achieved, a second step was undergone at a relatively<br />
high shear rate, g· = 0.05, 0.25, 1 2 s-1 , result<strong>in</strong>g<br />
<strong>in</strong> a rupture <strong>of</strong> the structure, whose time evolution<br />
is measured. F<strong>in</strong>ally, when the equilibrium<br />
was ga<strong>in</strong>ed at g· 2<br />
, the third step was applied at<br />
g· = 0.01 3 s-1 observ<strong>in</strong>g the rebuild <strong>of</strong> the structure<br />
by means <strong>of</strong> the measurement <strong>of</strong> the shear stress<br />
with time. In this way, with this experimental<br />
protocol, it is possible to analyse the time dependent<br />
behaviour <strong>of</strong> the sample dur<strong>in</strong>g breakdown<br />
22787-6<br />
Applied Rheology<br />
Volume 20 · Issue 2