Static and Dynamic Yield Stresses of Aerosil® 200 Suspensions in ...
Static and Dynamic Yield Stresses of Aerosil® 200 Suspensions in ...
Static and Dynamic Yield Stresses of Aerosil® 200 Suspensions in ...

Create successful ePaper yourself
Turn your PDF publications into a flip-book with our unique Google optimized e-Paper software.
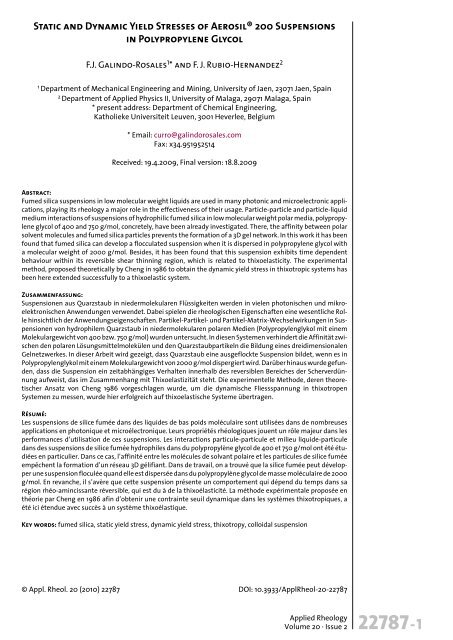
<strong>Static</strong> <strong>and</strong> <strong>Dynamic</strong> <strong>Yield</strong> <strong>Stresses</strong> <strong>of</strong> <strong>Aerosil®</strong> <strong>200</strong> <strong>Suspensions</strong><br />
<strong>in</strong> Polypropylene Glycol<br />
F.J. Gal<strong>in</strong>do-Rosales 1 * <strong>and</strong> F. J. Rubio-Hern<strong>and</strong>ez 2<br />
1<br />
Department <strong>of</strong> Mechanical Eng<strong>in</strong>eer<strong>in</strong>g <strong>and</strong> M<strong>in</strong><strong>in</strong>g, University <strong>of</strong> Jaen, 23071 Jaen, Spa<strong>in</strong><br />
2<br />
Department <strong>of</strong> Applied Physics II, University <strong>of</strong> Malaga, 29071 Malaga, Spa<strong>in</strong><br />
* present address: Department <strong>of</strong> Chemical Eng<strong>in</strong>eer<strong>in</strong>g,<br />
Katholieke Universiteit Leuven, 3001 Heverlee, Belgium<br />
* Email: curro@gal<strong>in</strong>dorosales.com<br />
Fax: x34.951952514<br />
Received: 19.4.<strong>200</strong>9, F<strong>in</strong>al version: 18.8.<strong>200</strong>9<br />
Abstract:<br />
Fumed silica suspensions <strong>in</strong> low molecular weight liquids are used <strong>in</strong> many photonic <strong>and</strong> microelectronic applications,<br />
play<strong>in</strong>g its rheology a major role <strong>in</strong> the effectiveness <strong>of</strong> their usage. Particle-particle <strong>and</strong> particle-liquid<br />
medium <strong>in</strong>teractions <strong>of</strong> suspensions <strong>of</strong> hydrophilic fumed silica <strong>in</strong> low molecular weight polar media, polypropylene<br />
glycol <strong>of</strong> 400 <strong>and</strong> 750 g/mol, concretely, have been already <strong>in</strong>vestigated. There, the aff<strong>in</strong>ity between polar<br />
solvent molecules <strong>and</strong> fumed silica particles prevents the formation <strong>of</strong> a 3D gel network. In this work it has been<br />
found that fumed silica can develop a flocculated suspension when it is dispersed <strong>in</strong> polypropylene glycol with<br />
a molecular weight <strong>of</strong> <strong>200</strong>0 g/mol. Besides, it has been found that this suspension exhibits time dependent<br />
behaviour with<strong>in</strong> its reversible shear th<strong>in</strong>n<strong>in</strong>g region, which is related to thixoelasticity. The experimental<br />
method, proposed theoretically by Cheng <strong>in</strong> 1986 to obta<strong>in</strong> the dynamic yield stress <strong>in</strong> thixotropic systems has<br />
been here extended successfully to a thixoelastic system.<br />
Zusammenfassung:<br />
Suspensionen aus Quarzstaub <strong>in</strong> niedermolekularen Flüssigkeiten werden <strong>in</strong> vielen photonischen und mikroelektronischen<br />
Anwendungen verwendet. Dabei spielen die rheologischen Eigenschaften e<strong>in</strong>e wesentliche Rolle<br />
h<strong>in</strong>sichtlich der Anwendungseigenschaften. Partikel-Partikel- und Partikel-Matrix-Wechselwirkungen <strong>in</strong> Suspensionen<br />
von hydrophilem Quarzstaub <strong>in</strong> niedermolekularen polaren Medien (Polypropylenglykol mit e<strong>in</strong>em<br />
Molekulargewicht von 400 bzw. 750 g/mol) wurden untersucht. In diesen Systemen verh<strong>in</strong>dert die Aff<strong>in</strong>ität zwischen<br />
den polaren Lösungsmittelmolekülen und den Quarzstaubpartikeln die Bildung e<strong>in</strong>es dreidimensionalen<br />
Gelnetzwerkes. In dieser Arbeit wird gezeigt, dass Quarzstaub e<strong>in</strong>e ausgeflockte Suspension bildet, wenn es <strong>in</strong><br />
Polypropylenglykol mit e<strong>in</strong>em Molekulargewicht von <strong>200</strong>0 g/mol dispergiert wird. Darüber h<strong>in</strong>aus wurde gefunden,<br />
dass die Suspension e<strong>in</strong> zeitabhängiges Verhalten <strong>in</strong>nerhalb des reversiblen Bereiches der Scherverdünnung<br />
aufweist, das im Zusammenhang mit Thixoelastizität steht. Die experimentelle Methode, deren theoretischer<br />
Ansatz von Cheng 1986 vorgeschlagen wurde, um die dynamische Fliessspannung <strong>in</strong> thixotropen<br />
Sys temen zu messen, wurde hier erfolgreich auf thixoelastische Systeme übertragen.<br />
Résumé:<br />
Les suspensions de silice fumée dans des liquides de bas poids moléculaire sont utilisées dans de nombreuses<br />
applications en photonique et microélectronique. Leurs propriétés rhéologiques jouent un rôle majeur dans les<br />
performances d’utilisation de ces suspensions. Les <strong>in</strong>teractions particule-particule et milieu liquide-particule<br />
dans des suspensions de silice fumée hydrophiles dans du polypropylène glycol de 400 et 750 g/mol ont été étudiées<br />
en particulier. Dans ce cas, l’aff<strong>in</strong>ité entre les molécules de solvant polaire et les particules de silice fumée<br />
empêchent la formation d’un réseau 3D gélifiant. Dans de travail, on a trouvé que la silice fumée peut développer<br />
une suspension floculée qu<strong>and</strong> elle est dispersée dans du polypropylène glycol de masse moléculaire de <strong>200</strong>0<br />
g/mol. En revanche, il s’avère que cette suspension présente un comportement qui dépend du temps dans sa<br />
région rhéo-am<strong>in</strong>cissante réversible, qui est du à de la thixoélasticité. La méthode expérimentale proposée en<br />
théorie par Cheng en 1986 af<strong>in</strong> d’obtenir une contra<strong>in</strong>te seuil dynamique dans les systèmes thixotropiques, a<br />
été ici étendue avec succès à un système thixoélastique.<br />
Key words: fumed silica, static yield stress, dynamic yield stress, thixotropy, colloidal suspension<br />
© Appl. Rheol. 20 (2010) 22787 DOI: 10.3933/ApplRheol-20-22787<br />
Applied Rheology<br />
Volume 20 · Issue 2<br />
22787-1
1 INTRODUCTION<br />
Fumed silica is amorphous nonporous silica prepared<br />
by a flame hydrolysis <strong>of</strong> SiCl4. Its surface<br />
chemistry is hydrophilic due to the presence <strong>of</strong><br />
hydroxyl or silanol groups (-OH) on the surface.<br />
These groups let particles l<strong>in</strong>k each other <strong>in</strong> liquids<br />
by means <strong>of</strong> hydrogen bond<strong>in</strong>g <strong>and</strong> are<br />
responsible <strong>of</strong> its ability to form network structures.<br />
This is the ma<strong>in</strong>ly reason why fumed silica<br />
systems are widespread used <strong>in</strong> emerg<strong>in</strong>g technologies,<br />
like photonics <strong>and</strong> microelectronics. To<br />
achieve the expected result <strong>in</strong> the f<strong>in</strong>al product,<br />
it is sometimes necessary us<strong>in</strong>g an organic media<br />
as a liquid phase. However, Raghavan et al. [1, 2]<br />
found that hydrophilic fumed silica is largely <strong>in</strong>capable<br />
<strong>of</strong> gell<strong>in</strong>g polar organic liquids with low<br />
molecular weight (< 750 g/mol), just because<br />
medium molecules preferentially form hydrogen<br />
bonds with the surface silanol groups present on<br />
the silica aggregates. Thereby, it is expected that<br />
these suspensions were non-flocculated <strong>and</strong>,<br />
consequently, its yield stress (YS) will be extremely<br />
low. As the YS is a rheological parameter with<br />
evident implications <strong>in</strong> the process eng<strong>in</strong>eer<strong>in</strong>g,<br />
an underst<strong>and</strong><strong>in</strong>g <strong>of</strong> the rheology <strong>of</strong> fumed silica<br />
<strong>in</strong> polar organic liquids is critical to ma<strong>in</strong>ta<strong>in</strong> the<br />
<strong>in</strong>tegrity <strong>and</strong> reliability <strong>of</strong> the f<strong>in</strong>al product [1, 2].<br />
Theoretically the YS is def<strong>in</strong>ed to be the<br />
stress at which the fluid just starts/stops mov<strong>in</strong>g,<br />
<strong>in</strong> other words, when the viscosity changes<br />
between be<strong>in</strong>g f<strong>in</strong>ite <strong>and</strong> <strong>in</strong>f<strong>in</strong>ite. This def<strong>in</strong>ition<br />
<strong>of</strong> YS is <strong>in</strong>applicable for experimentalists,<br />
because experiments <strong>of</strong> <strong>in</strong>f<strong>in</strong>ite duration would<br />
be required <strong>in</strong> order to dist<strong>in</strong>guish between f<strong>in</strong>ite<br />
<strong>and</strong> <strong>in</strong>f<strong>in</strong>ite viscosities. Consequently, the measured<br />
yield stress may depend on the patience <strong>of</strong><br />
the experimentalist <strong>and</strong> the experimental protocol.<br />
So, depend<strong>in</strong>g on the experimental procedure<br />
quite different values <strong>of</strong> YS can be obta<strong>in</strong>ed<br />
[3 - 5]. However, despite <strong>of</strong> the controversial concept<br />
<strong>of</strong> the YS as a true material property, its usefulness<br />
<strong>in</strong> eng<strong>in</strong>eer<strong>in</strong>g design <strong>and</strong> operation <strong>of</strong><br />
processes when h<strong>and</strong>l<strong>in</strong>g <strong>and</strong> transport <strong>of</strong> <strong>in</strong>dustrial<br />
suspensions are <strong>in</strong>volved make YS an important<br />
parameter from a practical po<strong>in</strong>t <strong>of</strong> view.<br />
One method that has been used for such applications<br />
is to work with two yield stresses, one static<br />
<strong>and</strong> one dynamic [6].<br />
As a consequence <strong>of</strong> the structure formation,<br />
it has been po<strong>in</strong>ted out [7] that it is possible<br />
to dist<strong>in</strong>guish between the <strong>Static</strong> <strong>Yield</strong> Stress<br />
(SYS) <strong>and</strong> the <strong>Dynamic</strong> <strong>Yield</strong> Stress (DYS) <strong>in</strong><br />
thixotropic materials. The SYS can be experimentally<br />
obta<strong>in</strong>ed by apply<strong>in</strong>g a quick (non-equilibrium)<br />
shear stress ramp to the system. The idea<br />
<strong>in</strong> which is based upon this rheological test is<br />
that, start<strong>in</strong>g from rest state, the sample will<br />
eventually start to flow by <strong>in</strong>creas<strong>in</strong>g the applied<br />
shear stress, just when a critical shear stress value<br />
was exceeded. The DYS is obta<strong>in</strong>ed from the<br />
steady-state flow curve (SSFC). The steady-shear<br />
stress value, obta<strong>in</strong>ed from the extrapolation <strong>of</strong><br />
the SSFC <strong>in</strong> the limit g·ô 0, is assumed as the<br />
DYS [7]. Hence, while the SYS is related to the<br />
amount <strong>of</strong> stress necessary to get the test material<br />
starts to flow from a rest state (i.e. it is an <strong>in</strong>dication<br />
<strong>of</strong> the transformation from a solid state to<br />
a viscoplastic state), the DYS can be understood<br />
as the stress necessary for stopp<strong>in</strong>g a flow<strong>in</strong>g test<br />
material (i.e. it is an <strong>in</strong>dication <strong>of</strong> the transformation<br />
from a viscoplastic state back to the solid<br />
state). As an example <strong>of</strong> the practical utility <strong>of</strong><br />
the separation <strong>in</strong> both YS values, the DYS is considered<br />
as the parameter responsible for stopp<strong>in</strong>g<br />
the flow<strong>in</strong>g concrete <strong>in</strong>side the mould or<br />
framework, while it is necessary to know the SYS<br />
<strong>of</strong> the concrete to select an adequate concrete<br />
pump [8]. On the other h<strong>and</strong>, the existence <strong>of</strong> different<br />
SYS <strong>and</strong> DYS values <strong>in</strong> the same material<br />
is taken as an <strong>in</strong>dication <strong>of</strong> that more than one<br />
k<strong>in</strong>d <strong>of</strong> structure exist <strong>in</strong> the system [7]. Follow<strong>in</strong>g<br />
Cheng, one <strong>of</strong> these structures would be very<br />
sensitive <strong>and</strong> would be broken down by relatively<br />
small shear values <strong>and</strong> it would only be built<br />
up at rest, while the other one would be more<br />
robust <strong>and</strong> would withst<strong>and</strong> moderate shear<br />
rates be<strong>in</strong>g responsible for the DYS. The SYS is<br />
consequence <strong>of</strong> the comb<strong>in</strong>ed structure. Therefore<br />
its value will be higher than the DYS one [9].<br />
Survey<strong>in</strong>g the literature it can be found a different<br />
def<strong>in</strong>ition for the term “dynamic yield<br />
stress”. It can be def<strong>in</strong>ed as the stress value at<br />
which deviation from l<strong>in</strong>earity occurred <strong>in</strong> oscillatory<br />
stress sweep tests. This def<strong>in</strong>ition has been<br />
used to determ<strong>in</strong>e the yield stress <strong>of</strong> emulsions <strong>and</strong><br />
the term “dynamic” appears because <strong>of</strong> the fact<br />
that this parameter is obta<strong>in</strong>ed by means <strong>of</strong> an<br />
oscillatory test. However this def<strong>in</strong>ition <strong>of</strong> dynamic<br />
yield stress is not constant but strongly dependent<br />
on frequency; besides, it does not present reasonable<br />
correlation with the yield stress estimated<br />
from flow curves [10]. Therefore, here this def<strong>in</strong>ition<br />
<strong>of</strong> dynamic yield stress will not be considered.<br />
22787-2<br />
Applied Rheology<br />
Volume 20 · Issue 2
Physical property PPG400 PPG<strong>200</strong>0<br />
M w [g/mol] 400 <strong>200</strong>0<br />
r [g/cm 3 ] 1.01 1<br />
h 20ºC [Pa·s] 100 450<br />
R g [Å] 7.8 54<br />
Table 1:<br />
Physical-chemical properties<br />
<strong>of</strong> PPG400 <strong>and</strong> PPG<strong>200</strong>0<br />
In this work it has been found that the length<br />
<strong>of</strong> polypropylene glycol molecules has an important<br />
effect on the effectiveness <strong>of</strong> the solvation <strong>of</strong><br />
<strong>Aerosil®</strong> <strong>200</strong> particles. Then, when these molecules<br />
are long enough, they cannot prevent that<br />
silica particles l<strong>in</strong>k each other anymore <strong>and</strong>, consequently<br />
a network would be formed. The presence<br />
<strong>of</strong> a network would imply higher values <strong>of</strong> YS<br />
<strong>and</strong>, possibly, time dependent behaviour. If time<br />
dependence were related to thixotropy, accord<strong>in</strong>g<br />
to Cheng, it would be possible dist<strong>in</strong>guish<strong>in</strong>g<br />
between SYS <strong>and</strong> DYS. This paper presents a study<br />
<strong>of</strong> the <strong>in</strong>fluence <strong>of</strong> the length <strong>of</strong> the polypropylene<br />
glycol molecules on the microstructure <strong>of</strong> <strong>Aerosil®</strong><br />
<strong>200</strong> suspensions by us<strong>in</strong>g rheometrics. Discrim<strong>in</strong>ation<br />
between flocculated <strong>and</strong> non-flocculated<br />
suspensions has been made by means <strong>of</strong> steady<br />
<strong>and</strong> oscillatory tests. In the case <strong>of</strong> flocculated suspension,<br />
the YS <strong>and</strong> time dependent behaviour due<br />
to thixoelasticy has been determ<strong>in</strong>ed. F<strong>in</strong>ally, SYS<br />
<strong>and</strong> DYS have been calculated follow<strong>in</strong>g the rheological<br />
experiments described above. This allows<br />
an analysis <strong>of</strong> the microstructure formed by<br />
<strong>Aerosil®</strong> <strong>200</strong> particles when they are dispersed <strong>in</strong><br />
a relatively high molecular weight polar medium<br />
2 MATERIALS AND METHODS<br />
In this work <strong>Aerosil®</strong> <strong>200</strong> supplied by Degussa<br />
A.G. (Düsseldorf, Germany) has been used as<br />
hydrophilic fumed silica, whose character is given<br />
by keep<strong>in</strong>g the whole orig<strong>in</strong>al silanol (Si-OH)<br />
groups on its surface. This material is presented<br />
as a f<strong>in</strong>e white powder with a purity <strong>of</strong> 99.8 %,<br />
<strong>and</strong> was used without any additional purification<br />
process. Its specific surface area BET is ª <strong>200</strong> ±<br />
25 m 2 /g <strong>and</strong> its primary spherical particles average<br />
size is 12 nm [11-13]. However, although the<br />
flame hydrolysis process <strong>in</strong>itially produces spherical<br />
particles, as they are hot at the end <strong>of</strong> the production<br />
process the particles collide each other<br />
<strong>and</strong> they fuse <strong>in</strong>to aggregates. These aggregates<br />
are branched, fractal structures, <strong>and</strong> can be considered<br />
as fumed silica primary structure s<strong>in</strong>ce<br />
the fusion process is irreversible <strong>and</strong> they cannot<br />
be separated by shear [14]. The cont<strong>in</strong>uous phase<br />
here considered is polypropylene glycol (HO-<br />
[CH 2<br />
-CH(CH 3<br />
)-O] n<br />
-H) with two different molecular<br />
weights, 400 g/mol (PPG400) <strong>and</strong> <strong>200</strong>0<br />
g/mol (PPG<strong>200</strong>0) on average (Sigma-Aldrich<br />
Chemical GmbH, Düsseldorf, Germany). Both<br />
have low <strong>and</strong> constant viscosity under ambient<br />
conditions. Some <strong>of</strong> their physical-chemical<br />
properties are <strong>in</strong>cluded <strong>in</strong>to Table 1.<br />
Each suspension was prepared by add<strong>in</strong>g the<br />
liquid to the silica <strong>and</strong> afterwards mixed <strong>in</strong> a<br />
blender for 10 m<strong>in</strong>utes at 796 rpm. These parameters<br />
have been determ<strong>in</strong>ed, <strong>in</strong> a previous study,<br />
as the m<strong>in</strong>imum mix<strong>in</strong>g time <strong>and</strong> angular velocity<br />
required to ensure homogeneity <strong>and</strong> reproducibility<br />
between batches. Samples were made<br />
<strong>in</strong> batches <strong>of</strong> 35 cm 3 <strong>and</strong> placed under vacuum <strong>and</strong><br />
sonication conditions at room temperature for<br />
one hour <strong>in</strong> order to remove air bubbles. Afterwards<br />
the sample was let at rest for 12 h <strong>in</strong> an airtight<br />
plastic bottle. The volume fraction <strong>of</strong><br />
<strong>Aerosil®</strong> <strong>200</strong> particles <strong>in</strong> the suspensions is quite<br />
low f s<br />
= 0.05, calculated from bulk densities consider<strong>in</strong>g<br />
silica particles as Euclidean solids, which<br />
corresponds to the 10.378 <strong>and</strong> 10.286 %w/w for<br />
PPG400 <strong>and</strong> PPG<strong>200</strong>0 suspensions, respectively.<br />
To sum up, both samples were composed by the<br />
same k<strong>in</strong>d <strong>of</strong> particles, which particle size distribution<br />
<strong>and</strong> shape are identical. Even the chemical<br />
<strong>in</strong>teractions with the suspend<strong>in</strong>g media are <strong>of</strong> the<br />
same k<strong>in</strong>d, i.e. the silanol groups on the surface <strong>of</strong><br />
the silica particles form hydrogen bonds with the<br />
polymer cha<strong>in</strong>s <strong>of</strong> PPG. So the only difference<br />
between them is related to the length <strong>of</strong> the polymer<br />
molecules <strong>of</strong> the suspend<strong>in</strong>g media.<br />
All rheological experiments were carried out<br />
at 25.0 ± 0.1ºC, with a controlled temperature<br />
bath (Thermo Haake DC30), on a Rheostress<br />
RS600 (Haake Thermo Electron Corporation<br />
GmbH, Karlsruhe, Germany), us<strong>in</strong>g a cone-plate<br />
sensor system with a cone angle <strong>of</strong> 2º <strong>and</strong> a diameter<br />
<strong>of</strong> 35 mm. Experiments were conducted<br />
under both steady as well as dynamic oscillatory<br />
shear. The time dependent behaviour <strong>of</strong> fumed<br />
silica suspensions is well known. Therefore, it is<br />
a common practice apply<strong>in</strong>g a pre-shear stage <strong>in</strong><br />
order to erase this pre-shear history dependent<br />
behaviour [15-19]. So, <strong>in</strong> order to ensure the<br />
results were reproducible, before each experiment,<br />
a steady pre-shear was applied up to an<br />
equilibrium state (dt(t)/dt £ 0.01 Pa/s). In this<br />
way, any previous shear history on the sample<br />
was erased [20]. The value <strong>of</strong> the shear rate<br />
applied <strong>in</strong> this pre-shear stage is the limit <strong>of</strong><br />
reversibility <strong>of</strong> the sample <strong>in</strong> order to ensure that<br />
they have not been denatured [21]. Afterwards,<br />
the sample was kept at rest for a period <strong>of</strong> time<br />
long enough to let them achieve an equilibrium<br />
structure [22].<br />
Applied Rheology<br />
Volume 20 · Issue 2<br />
22787-3
Figure 1 (left):<br />
Scheme <strong>of</strong> the experimental<br />
protocol followed to obta<strong>in</strong><br />
the limit <strong>of</strong> reversibility.<br />
Figure 2:<br />
Limit <strong>of</strong> reversibility for<br />
A<strong>200</strong> suspensions <strong>in</strong><br />
PPG400 <strong>and</strong> PPG<strong>200</strong>0 at 5<br />
%v/v.<br />
2.1 LIMIT OF REVERSIBILITY<br />
The limit <strong>of</strong> reversibility has been def<strong>in</strong>ed as the<br />
maximum shear rate value that a sample is able<br />
to suffer without los<strong>in</strong>g its orig<strong>in</strong>al properties<br />
[21]. To determ<strong>in</strong>e this limit, the samples here<br />
studied have been sheared at 1 s -1 until the equilibrium<br />
<strong>in</strong> the apparent viscosity (h m<br />
) is achieved.<br />
After this, a step wise <strong>in</strong> shear rate is applied at<br />
g· dur<strong>in</strong>g 300 s. Then it is undergone to 1 i s-1 up to<br />
the equilibrium is reached aga<strong>in</strong>. The values fixed<br />
for g· were 0.01, 0.1, 5, 10 <strong>and</strong> 100 i s-1 (Figure 1). The<br />
limit <strong>of</strong> reversibility <strong>of</strong> each sample was determ<strong>in</strong>ed<br />
compar<strong>in</strong>g the apparent viscosity equilibrium<br />
values each time that the sample was aga<strong>in</strong><br />
sheared at 1 s -1 . The maximum shear rate g· after i<br />
which the sample is able to recover the 90 % <strong>of</strong><br />
the h eq<br />
-value at 1 s -1 , is the limit <strong>of</strong> reversibility. In<br />
Figure 2 it can be observed that suspension <strong>of</strong><br />
A<strong>200</strong> <strong>in</strong> PPG400 is reversible up to 100 s -1 , whereas<br />
<strong>in</strong> PPG<strong>200</strong>0 is only up to 1 s -1 .<br />
2.2 RESTING TIME<br />
Tak<strong>in</strong>g <strong>in</strong>to account that the microstructure <strong>of</strong> the<br />
suspension is due to the agglomerates or flocs formation<br />
between primary particle aggregates,<br />
which l<strong>in</strong>k each other by hydrogen bonds, it can<br />
be assumed that the bigger the agglomerates’ size<br />
is, the more amount <strong>of</strong> these bonds are present<br />
<strong>and</strong> consequently, the stronger the microstructure<br />
will be. On the other h<strong>and</strong>, the strength <strong>of</strong> a<br />
microstructure can be measured as the shear<br />
stress response at a certa<strong>in</strong> applied shear rate.<br />
As the rest<strong>in</strong>g time may logically <strong>in</strong>fluence<br />
<strong>in</strong> the f<strong>in</strong>al size <strong>of</strong> the agglomerates, it is necessary<br />
to determ<strong>in</strong>e the time needed to achieve the<br />
equilibrium structure at rest for each sample. To<br />
determ<strong>in</strong>e the m<strong>in</strong>imum time <strong>in</strong>terval <strong>in</strong> which<br />
the equilibrium structure is achieved, stepwise<br />
tests have been carried out after different rest<strong>in</strong>g<br />
times at a low shear rate (g· = 0.1 s -1 ). In Figure<br />
3 it can be seen that <strong>in</strong> PPG400 suspension<br />
only needed 60 s to develop its equilibrium mi -<br />
cro structure because longer rest<strong>in</strong>g times result<br />
<strong>in</strong> the same shear stress response <strong>of</strong> the sample.<br />
Therefore, the biggest agglomerates’ size <strong>of</strong><br />
<strong>Aerosil®</strong> <strong>200</strong> particles <strong>in</strong> PPG400 is formed just<br />
<strong>in</strong> 60 s <strong>of</strong> rest<strong>in</strong>g time. However, <strong>in</strong> PPG<strong>200</strong>0 suspension<br />
longer times let <strong>Aerosil®</strong> <strong>200</strong> particles<br />
reach each other <strong>and</strong> form bigger agglomerates.<br />
It is needed at least 1800 s to develop the greatest<br />
size <strong>of</strong> agglomerates <strong>and</strong> then the maximum<br />
structure level. Summ<strong>in</strong>g up, it has been determ<strong>in</strong>ed<br />
that the equilibrium structure is achieved<br />
after 60 s <strong>of</strong> rest stage for PPG400 suspension<br />
<strong>and</strong> after 1800 s for PPG<strong>200</strong>0 one. These rest<strong>in</strong>g<br />
times will be considered for this stage <strong>in</strong> the protocol<br />
<strong>of</strong> the experiments.<br />
2.3 PROTOCOLS OF EXPERIMENTS<br />
F<strong>in</strong>ally, the protocols for the rheological experiments<br />
we have made with both suspensions consist<br />
<strong>of</strong> three stages. The first one is the pre-shear,<br />
the second one is the rest period, <strong>and</strong> the third<br />
one is the rheological test itself. In the next section<br />
the experimental results are exposed sorted<br />
<strong>in</strong>to steady <strong>and</strong> dynamic experiments.<br />
3 RESULTS AND DISCUSSION<br />
The steady viscosity curve was obta<strong>in</strong>ed by apply<strong>in</strong>g<br />
an <strong>in</strong>creas<strong>in</strong>g series <strong>of</strong> discrete shear rate<br />
steps. Each po<strong>in</strong>t <strong>of</strong> the plot has been obta<strong>in</strong>ed<br />
after shear<strong>in</strong>g the sample at a certa<strong>in</strong> shear rate<br />
until the equilibrium stress response was<br />
obta<strong>in</strong>ed (dt(t)/dt £ 0.01 Pa/s). Figure 4a shows<br />
suspension <strong>of</strong> <strong>Aerosil®</strong> <strong>200</strong> <strong>in</strong> polypropylene glycol<br />
400 g/mol exhibit<strong>in</strong>g shear thicken<strong>in</strong>g<br />
behaviour <strong>in</strong> the middle <strong>of</strong> shear rate range considered.<br />
So, it can be considered that this system<br />
is non-flocculated. The slight shear th<strong>in</strong>n<strong>in</strong>g<br />
behaviour at low shear rates can be due to the<br />
breakdown <strong>of</strong> the bigger aggregates <strong>in</strong>to smaller<br />
ones. As these aggregates are not connected<br />
each other, there is not a network <strong>and</strong> the suspension<br />
is non-flocculated. On the other h<strong>and</strong><br />
the suspension <strong>in</strong> PPG<strong>200</strong>0, as it presents shear<br />
th<strong>in</strong>n<strong>in</strong>g <strong>in</strong> the whole shear rate range considered<br />
(Figure 4b), presumably due to the breakdown<br />
<strong>of</strong> a three dimensional network, is as -<br />
22787-4<br />
Applied Rheology<br />
Volume 20 · Issue 2
Figure 3 (left):<br />
Influence <strong>of</strong> the rest<strong>in</strong>g time<br />
<strong>in</strong> the transitory response <strong>of</strong><br />
the suspensions <strong>of</strong> A<strong>200</strong> <strong>in</strong><br />
PPG400 <strong>and</strong> PPG<strong>200</strong>0 at 5<br />
%v/v when undergone to a<br />
step-up <strong>in</strong> shear rate from 0<br />
to 0.1 s -1 .<br />
(a)<br />
Figure 4:<br />
Steady state viscosity curves<br />
<strong>of</strong> A<strong>200</strong> suspensions <strong>in</strong><br />
PPG400 (a) <strong>and</strong> PPG<strong>200</strong>0<br />
(b) at 5 %v/v.<br />
sumed as flocculated [1, 2, 22]. Therefore, it is<br />
obvious that the length <strong>of</strong> the polymer molecule<br />
has a great <strong>in</strong>fluence on the microstructure<br />
developed by A<strong>200</strong>. In order to underst<strong>and</strong> why<br />
A<strong>200</strong> is able to develop a 3D network <strong>in</strong> PPG<strong>200</strong>0,<br />
but not <strong>in</strong> PPG400, it is needed to focus on the<br />
particle-particle <strong>and</strong> particle-media <strong>in</strong>teractions.<br />
Khan <strong>and</strong> Zoeller [22], <strong>and</strong> Raghavan et al.<br />
[2] found out that A<strong>200</strong> <strong>in</strong> polar media with low<br />
molecular weight (< 750 g/mol) is unable to<br />
develop a volume fill<strong>in</strong>g network structure <strong>and</strong><br />
then these systems are not flocculated. They<br />
deduced that particles <strong>of</strong> A<strong>200</strong> present a preferential<br />
<strong>in</strong>teraction with liquid molecules, because each<br />
preserv<strong>in</strong>g the whole orig<strong>in</strong>al silanol groups they<br />
form hydrogen bonds with the polymer molecules,<br />
<strong>and</strong> this would lead to a solvation layer that<br />
coats each silica particle <strong>of</strong> each primary aggregate.<br />
Follow<strong>in</strong>g their argument, as the length <strong>of</strong><br />
polymer cha<strong>in</strong>s is, accord<strong>in</strong>g to the <strong>in</strong>formation<br />
given by the fabricant, approximately five times<br />
shorter than particle’s diameter <strong>in</strong> the case <strong>of</strong><br />
PPG400 suspension (Table 1), the solvation <strong>of</strong> the<br />
silica particles is almost whole effective <strong>and</strong>, consequently,<br />
it is expected that only few particle<br />
primary aggregates form agglomerates. The disruption<br />
<strong>of</strong> these agglomerates under shear<br />
would justify the existence <strong>of</strong> the reversible<br />
shear-th<strong>in</strong>n<strong>in</strong>g region found at shear rates lower<br />
than 10.91 s -1 . Due to the effective solvation <strong>of</strong><br />
the silica particles by PPG400 molecules, the particle-particle<br />
<strong>in</strong>teraction will be short-range<br />
order <strong>and</strong> this system is non-flocculated. As it has<br />
been described, this proposed scheme is consistent<br />
with the given result <strong>of</strong> the steady viscosity<br />
curve. The slight shear th<strong>in</strong>n<strong>in</strong>g region at low<br />
shear rates, lower than critical shear rate (g· £g· ), c<br />
occurs because the mechanical energy applied is<br />
able to disrupt the agglomerates <strong>in</strong> smaller ones.<br />
On the other h<strong>and</strong>, the shear thicken<strong>in</strong>g behaviour<br />
can be expla<strong>in</strong>ed by means <strong>of</strong> hydro-cluster<strong>in</strong>g<br />
mechanism [23, 24]. As the shear rate<br />
<strong>in</strong>creases the aggregates may be moved to closer<br />
positions, so, over a critical shear rate value<br />
(g· £g·<br />
c £g· m<br />
), the aggregates may be attached<br />
(b)<br />
other form<strong>in</strong>g bigger clusters driven by<br />
shear forces. The bigger the cluster size, the higher<br />
the resistance to flow is with<strong>in</strong> them, so locally<br />
lubrication forces dom<strong>in</strong>ate <strong>and</strong> consequently<br />
the viscosity <strong>in</strong>crease [25].<br />
In the case <strong>of</strong> PPG<strong>200</strong>0 suspension, as the<br />
length <strong>of</strong> polymer cha<strong>in</strong>s is <strong>of</strong> the same order <strong>of</strong><br />
magnitude than particle diameter (Table 1), the<br />
solvation <strong>of</strong> silica particles by PPG<strong>200</strong>0 molecules<br />
is not as effective as <strong>in</strong> the case <strong>of</strong> PPG400<br />
suspension. Consequently, aga<strong>in</strong> based upon<br />
Khan <strong>and</strong> Zoeller [22], <strong>and</strong> Raghavan et al. [2]<br />
<strong>in</strong>terpretations, we can assume that particle primary<br />
aggregates are able to form a volume fill<strong>in</strong>g<br />
network structure. The poor solvation <strong>of</strong> particles<br />
by PPG<strong>200</strong>0 molecules makes possible that<br />
a long-range order particle-particle <strong>in</strong>teraction<br />
can be achieved <strong>in</strong> suspensions <strong>of</strong> A<strong>200</strong> <strong>in</strong><br />
PPG<strong>200</strong>0 at 5 %v/v. Therefore this system is flocculated.<br />
Besides, the formation <strong>of</strong> this network<br />
may take long time (≥ 1800 s) as was observed.<br />
The primary particle aggregates have more difficulty<br />
to move through the medium to connect<br />
each other possibly because <strong>of</strong> relative high viscosity<br />
<strong>of</strong> the suspend<strong>in</strong>g media. Accord<strong>in</strong>g to this<br />
explanation the proposed scheme for this material<br />
is consistent with its steady viscosity curve.<br />
The shear th<strong>in</strong>n<strong>in</strong>g behaviour observed <strong>in</strong> the<br />
whole shear rate region here studied is a consequence<br />
<strong>of</strong> disrupt<strong>in</strong>g the agglomerates <strong>in</strong> smaller<br />
ones, which is driven by the mechanical energy<br />
supplied <strong>in</strong> form <strong>of</strong> shear stress.<br />
Applied Rheology<br />
Volume 20 · Issue 2<br />
22787-5
Figure 5:<br />
Mechanical spectra with<strong>in</strong><br />
the l<strong>in</strong>ear viscoelastic deformation<br />
<strong>of</strong> A<strong>200</strong> suspensions<br />
<strong>in</strong> PPG400 (a) <strong>and</strong> PPG<strong>200</strong>0<br />
(b) at 5 %v/v.<br />
(a)<br />
(b)<br />
In spite <strong>of</strong> the fact that rheometry is a macroscopic<br />
materials characterization technique, it is<br />
well-known that provides an easily accessible<br />
way to correlate the microstructure <strong>of</strong> a system<br />
with its particular rheological responses. In l<strong>in</strong>e<br />
with this idea, the dynamic rheological tests are<br />
commonly used to describe states <strong>of</strong> aggregation<br />
<strong>in</strong> colloidal systems. The importance <strong>of</strong> this type<br />
<strong>of</strong> measurements arises from the fact that at low<br />
stra<strong>in</strong> values the “at rest” microstructure can be<br />
probed s<strong>in</strong>ce it is not disrupted by shear<strong>in</strong>g as <strong>in</strong><br />
steady shear flow experiments. This is very useful<br />
<strong>in</strong> colloidal systems because the state <strong>of</strong><br />
aggregation can be associated with the particular<br />
rheological response with<strong>in</strong> the l<strong>in</strong>ear viscoelastic<br />
regime obta<strong>in</strong>ed from the dynamic<br />
mechanical spectrum <strong>of</strong> the material. The typical<br />
rheological behaviour for a non-flocculated or<br />
deflocculated system is characterised by a frequency<br />
sweep with<strong>in</strong> the l<strong>in</strong>ear viscoelastic<br />
response <strong>in</strong> which the viscous modulus dom<strong>in</strong>ates<br />
the rheological response (G’(w) < G’’(w).).<br />
In opposite, the rheological response <strong>of</strong> a flocculated<br />
dispersion presents higher values for G’ <strong>and</strong><br />
G’’, due to primary particles agglomerates, <strong>and</strong><br />
the storage modulus dom<strong>in</strong>ates the response<br />
(G’(w) > G’’(w).). Because <strong>of</strong> the presence <strong>of</strong> these<br />
agglomerates, the sample exhibits a more elastic<br />
response with less marked frequency dependence<br />
for G’ [9]. The limit<strong>in</strong>g case, <strong>in</strong> which the<br />
forces between primary particle aggregates <strong>and</strong><br />
the concentration allow form<strong>in</strong>g a three dimensional<br />
network, G’ is completely frequency <strong>in</strong>dependent<br />
<strong>and</strong> dom<strong>in</strong>ates over G’’. This type <strong>of</strong><br />
microstructure is known as a gel <strong>and</strong> it exhibits<br />
solid-like behaviour, similar to chemically crossl<strong>in</strong>ked<br />
polymeric networks [26, 27].<br />
In order to ensure a dynamic frequency<br />
sweep test with<strong>in</strong> the l<strong>in</strong>ear viscoelastic regime,<br />
oscillatory stress sweep tests were carried out<br />
previously. Thus, the limit <strong>of</strong> the l<strong>in</strong>ear viscoelastic<br />
behaviour were determ<strong>in</strong>ed at three<br />
different frequency values (0.1, 1, 100 rad/s).<br />
Then, the limits <strong>of</strong> l<strong>in</strong>ear region over the frequency<br />
range 0.1–100 rad/s were established<br />
(not shown) for both suspensions. Therefore,<br />
dynamic frequency sweep tests were done by<br />
apply<strong>in</strong>g oscillation amplitude with<strong>in</strong> their l<strong>in</strong>ear<br />
region over the frequency range 0.1 - 100 rad/s.<br />
The dependence <strong>of</strong> storage modulus (G’) <strong>and</strong> loss<br />
modulus (G’’) with frequency were determ<strong>in</strong>ed<br />
(Figure 5). Results confirm that the suspension <strong>of</strong><br />
silica particles <strong>in</strong> PPG400 is non-flocculated,<br />
while <strong>in</strong> PPG<strong>200</strong>0 is weakly flocculated.<br />
As it has been widely observed that A<strong>200</strong> is<br />
a thixotropic agent when added to different liquid<br />
media [9, 19, 28], <strong>and</strong> as it has been observed<br />
here that A<strong>200</strong> <strong>in</strong> PPG<strong>200</strong>0 exhibits shear th<strong>in</strong>n<strong>in</strong>g<br />
behaviour, we were prone to th<strong>in</strong>k that this<br />
suspension will exhibit thixotropic behaviour.<br />
Thixotropy implies that the viscosity will gradually<br />
decrease <strong>in</strong> time when the shear rate is suddenly<br />
<strong>in</strong>creased, the time effect should be<br />
reversible <strong>and</strong> consequently the viscosity should<br />
aga<strong>in</strong> <strong>in</strong>crease <strong>in</strong> time when the shear rate is<br />
reduced [29, 30]. Thixotropic behaviour is commonly<br />
studied by track<strong>in</strong>g the material response<br />
result<strong>in</strong>g from stepwise changes <strong>in</strong> shear rate, as<br />
the coupled effect <strong>of</strong> time <strong>and</strong> shear rate can be<br />
clearly separated <strong>in</strong> such experiments. This procedure<br />
has already been used s<strong>in</strong>ce early studies<br />
on thixotropy, i.e. Weltman (1943) [31 – 33]. Consequently,<br />
stepwise experiments were developed<br />
<strong>in</strong> order to study time dependent behaviour<br />
<strong>of</strong> this material. The rheological test consists <strong>of</strong><br />
three consecutive steps <strong>in</strong> control rate mode,<br />
with<strong>in</strong> the reversible shear rate range (g· £ 1 s -1 ).<br />
The first step was carried out at a low shear rate,<br />
g· = 0.01 s -1 , with the objective to get an equilibrium<br />
strong structure. Once the steady state was<br />
achieved, a second step was undergone at a relatively<br />
high shear rate, g· = 0.05, 0.25, 1 2 s-1 , result<strong>in</strong>g<br />
<strong>in</strong> a rupture <strong>of</strong> the structure, whose time evolution<br />
is measured. F<strong>in</strong>ally, when the equilibrium<br />
was ga<strong>in</strong>ed at g· 2<br />
, the third step was applied at<br />
g· = 0.01 3 s-1 observ<strong>in</strong>g the rebuild <strong>of</strong> the structure<br />
by means <strong>of</strong> the measurement <strong>of</strong> the shear stress<br />
with time. In this way, with this experimental<br />
protocol, it is possible to analyse the time dependent<br />
behaviour <strong>of</strong> the sample dur<strong>in</strong>g breakdown<br />
22787-6<br />
Applied Rheology<br />
Volume 20 · Issue 2
Figure 6:<br />
Transitory response <strong>of</strong> A<strong>200</strong><br />
suspension <strong>in</strong> PPG<strong>200</strong>0 at 5<br />
%v/v when it is undergone<br />
to a step-up essay from 0 to<br />
0.01 s -1 (a), when it is undergone<br />
to a step-up essay<br />
from 0.01 to 0.05, 0.25, <strong>and</strong><br />
1 s -1 (b), <strong>and</strong> when it is undergone<br />
to a step-down essay<br />
from 0.05, 0.25 <strong>and</strong> 1 s -1 to<br />
0.01 s -1 (c).<br />
(a)<br />
(b)<br />
<strong>and</strong> build-up transitory responses, as well as its<br />
reversibility, which is a basic condition that must<br />
be accomplished to affirm thixotropy is be<strong>in</strong>g<br />
observed.<br />
Figure 6a shows a breakdown transitory<br />
response when the system is undergone to the<br />
first step from the rest. The time-dependent<br />
changes <strong>in</strong> stress <strong>and</strong> structure reveal two periods<br />
with dist<strong>in</strong>ct time scales <strong>in</strong> the breakdown<br />
process, situated on either side <strong>of</strong> the maximum<br />
stress <strong>and</strong> orientation <strong>of</strong> the structure, which<br />
rema<strong>in</strong>s connected. The second corresponds to<br />
flow <strong>and</strong> disaggregation <strong>of</strong> the structure. It has<br />
been reported by Pignon et al. (1998) [34] that the<br />
order <strong>of</strong> magnitude <strong>of</strong> the time scale <strong>in</strong> the first<br />
period is shorter than that <strong>in</strong> the second for<br />
thixotropic materials, be<strong>in</strong>g the ratio <strong>of</strong> the time<br />
scales <strong>of</strong> the order <strong>of</strong> 1/1000. In our case, it is clearly<br />
observed a delayed <strong>in</strong> the overshoot <strong>in</strong> t(t) <strong>and</strong><br />
the ratio is around 1/3. In order to study the breakdown<br />
<strong>of</strong> the microstructure, the procedure followed<br />
<strong>in</strong>volves apply<strong>in</strong>g a jump <strong>in</strong> shear rate<br />
from an <strong>in</strong>itial value (g· = 0.01 s -1 ) to a f<strong>in</strong>al value<br />
(g· ) with (g· > g·<br />
2 2 1<br />
). Dur<strong>in</strong>g this test, the material<br />
passes from an aggregate structure with a certa<strong>in</strong><br />
‘‘high’’ <strong>in</strong>itial consistency to a less aggregated<br />
structural state, i.e. with a lower level <strong>of</strong><br />
consistency. In Figure 6b, a delayed overshoot is<br />
observed aga<strong>in</strong> <strong>in</strong> the shear stress response for<br />
all values <strong>of</strong> g· 2<br />
here considered, but the ratios are<br />
<strong>in</strong> the order <strong>of</strong> 1/20. The overshoot can be <strong>in</strong>terpreted<br />
<strong>in</strong> this case as the expression <strong>of</strong> the maximum<br />
deformation that the microstructure<br />
developed <strong>in</strong> the steady state at g· = 0.01 1 s-1 can<br />
support before it falls apart. After this, new s<strong>of</strong>ter<br />
equilibrium microstructures are formed, s<strong>of</strong>ter<br />
as higher is the shear rate applied to the sample<br />
<strong>in</strong> the second step-up. When the equilibrium<br />
state is reached at g· , the lower shear rate g· =<br />
2 3<br />
0.01 s -1 is aga<strong>in</strong> applied to the system. As it was<br />
before po<strong>in</strong>ted out, this last step-down is<br />
designed to analyse the build-up transitory<br />
response <strong>of</strong> the material (Figure 6c). It can be<br />
observed the result<strong>in</strong>g stress transients display<br />
an <strong>in</strong>itial, sudden decrease that reflects the<br />
(c)<br />
reduction <strong>of</strong> the purely viscous stress contribution<br />
when lower<strong>in</strong>g the shear rate. It is followed<br />
by a fast viscoelastic relaxation. After this, the<br />
stress monotonically <strong>in</strong>creases to a steady state<br />
level as a result <strong>of</strong> the grow<strong>in</strong>g microstructure.<br />
Figure 6.c shows that the steady state value <strong>of</strong><br />
the stress at the f<strong>in</strong>al shear rate is <strong>in</strong>dependent<br />
<strong>of</strong> the g· 2-value <strong>and</strong> the samples recover over the<br />
90 % <strong>of</strong> the steady shear stress value which was<br />
achieved <strong>in</strong> the first step-up. This quantitative<br />
result <strong>in</strong>dicates that the reversibility, a basic condition<br />
to affirm we are observ<strong>in</strong>g thixotropic<br />
behaviour, has been proved. This typical build-up<br />
curve has been reported before for many other<br />
for thixotropic systems by different authors [33,<br />
34]. On the other h<strong>and</strong>, the overshoots observed<br />
start<strong>in</strong>g the step tests lead us to conclude that<br />
A<strong>200</strong> suspension <strong>in</strong> PPG<strong>200</strong>0 at 5 %v/v also presents<br />
elastic behaviour. Accord<strong>in</strong>g to Cheng [7],<br />
the comb<strong>in</strong>ation <strong>of</strong> both time dependent behaviours<br />
can be named as thixoelasticity.<br />
As po<strong>in</strong>ted out, there are thixotropic materials<br />
<strong>in</strong> which it is possible to dist<strong>in</strong>guish between<br />
the SYS <strong>and</strong> the DYS. Cheng proposed an experimental<br />
method to determ<strong>in</strong>e the DYS [7]. Basically<br />
it consists <strong>of</strong> apply<strong>in</strong>g to a thixotropic sample<br />
successive steps <strong>in</strong> shear rate <strong>and</strong> determ<strong>in</strong>e<br />
a family <strong>of</strong> constant structure curves <strong>and</strong>, from<br />
these, its steady-state flow curve (SSFC). The SSFC<br />
will be f<strong>in</strong>ally used to get the DYS. Gal<strong>in</strong>do-Rosales<br />
et al. [9] have validated experimentally this<br />
Applied Rheology<br />
Volume 20 · Issue 2<br />
22787-7
Figure 7 (left):<br />
Family <strong>of</strong> constant structure<br />
curves with<strong>in</strong> the reversible<br />
shear rate range <strong>of</strong> A<strong>200</strong><br />
suspension <strong>in</strong> PPG<strong>200</strong>0 at 5<br />
%v/v.<br />
Figure 8: Representation <strong>of</strong><br />
t oy<br />
versus g· eq<br />
<strong>of</strong> A<strong>200</strong> suspension<br />
<strong>in</strong> PPG<strong>200</strong>0 at 5<br />
%v/v <strong>and</strong> fitt<strong>in</strong>g curve from<br />
Equation 2.<br />
Table 2 (above):<br />
Parameter values <strong>of</strong> the<br />
Equation 1 for each constant<br />
structure curve <strong>of</strong> A<strong>200</strong><br />
suspension <strong>in</strong> PPG<strong>200</strong>0 at<br />
5 %v/v. Correlation coefficient<br />
is also given for each<br />
fit.<br />
Table 3:<br />
Parameter values <strong>of</strong> the<br />
Equation 2 applied to A<strong>200</strong><br />
suspension <strong>in</strong> PPG<strong>200</strong>0 at<br />
5 %v/v. Correlation coefficient<br />
is also given.<br />
method by us<strong>in</strong>g aqueous suspensions <strong>of</strong> A<strong>200</strong><br />
at 2.5 <strong>and</strong> 7.5 %v/v. These suspensions showed<br />
thixotropic behaviour (no thixoelastic) <strong>and</strong> different<br />
values for the SYS <strong>and</strong> the DYS were<br />
obta<strong>in</strong>ed <strong>in</strong> both cases. Consequently, accord<strong>in</strong>g<br />
to Cheng [7], they concluded that more than one<br />
k<strong>in</strong>d <strong>of</strong> structure must exist <strong>in</strong> these aqueous systems.<br />
Follow<strong>in</strong>g the method described, a family<br />
<strong>of</strong> constant structure curves with<strong>in</strong> the reversible<br />
shear rate range <strong>of</strong> A<strong>200</strong> suspension <strong>in</strong> PPG<strong>200</strong>0<br />
has been obta<strong>in</strong>ed. Figure 7 shows the results.<br />
Each constant structure curve represents<br />
the overshoot values <strong>of</strong> t i<br />
(t) with which an equilibrium<br />
structure developed <strong>in</strong> state <strong>of</strong> flux at g· e<br />
responses when, suddenly, is undergone to g· i . It<br />
has been found that the equation which better<br />
fits each constant structure curve is:<br />
where t •l<br />
<strong>and</strong> t 0l<br />
are <strong>in</strong>terpreted as the overshoot<br />
values with which an equilibrium structure<br />
developed <strong>in</strong> state <strong>of</strong> flux at g· e<br />
would response<br />
when the sample was undergone to g· ô•<strong>and</strong><br />
i<br />
g· i<br />
ô 0, respectively; p is a non-dimensional<br />
parameter <strong>and</strong> g· 0<br />
is a shear rate value that gives<br />
an overshoot value which is the average value <strong>of</strong><br />
t •<br />
<strong>and</strong> t 0<br />
. The results correspond<strong>in</strong>g to each constant<br />
structure curve are shown <strong>in</strong> Table 2. From<br />
.<br />
g eq [s -1 .<br />
] t 0l [Pa] t ∞l [Pa] g 0 [s -1 ] p R 2<br />
0.01 4.4±0.2 261.3±0.8 0.549±0.003 0.835±0.003 0.99987<br />
0.05 3.4±0.3 301±2 0.91±0.01 0.876±0.006 0.99949<br />
0.1 2.41±0.09 210.4±0.5 0.507±0.002 1.055±0.003 0.99994<br />
0.5 0.75±0.03 222±2 0.673±0.009 0.996±0.009 0.9992<br />
1 0.31±0.01 225±3 0.91±0.02 0.892±0.009 0.9988<br />
A 0 [Pa] A 1 [Pa] B 1 [s -1 ] A 2 [Pa] B 2 [s -1 ] R 2<br />
-0.061±0.001 1.726±0.002 0.65±0.01 3.111±0.003 0.088±0.002 0.999<br />
(1)<br />
data shown <strong>in</strong> Table 2, a plot t 0l<br />
= t 0l<br />
(g· eq ) has<br />
been obta<strong>in</strong>ed. As can be seen <strong>in</strong> Figure 8 it follows<br />
a double exponential decay equation:<br />
(2)<br />
Table 3 conta<strong>in</strong>s all the values <strong>of</strong> the parameters<br />
from Equation 2. Accord<strong>in</strong>g to Cheng [7], the DYS<br />
is given by the follow<strong>in</strong>g equation:<br />
therefore from Equation 2 the DYS is given by:<br />
(3)<br />
(4)<br />
The value <strong>of</strong> SYS <strong>of</strong> A<strong>200</strong> suspension <strong>in</strong> PPG<strong>200</strong>0<br />
was determ<strong>in</strong>ed by apply<strong>in</strong>g a steady stress<br />
sweep from 0 to 100 Pa as the limit <strong>of</strong> elastic<br />
deformation range [35] (Figure 9). The result so<br />
obta<strong>in</strong>ed was:<br />
(5)<br />
As SYS does not co<strong>in</strong>cide with DYS, it can be concluded<br />
that A<strong>200</strong> may develop at least two different<br />
k<strong>in</strong>d <strong>of</strong> microstructure <strong>in</strong> PPG<strong>200</strong>0 at 5<br />
%v/v, the robust one would be build-up under<br />
flow conditions <strong>and</strong> would be responsible for the<br />
value <strong>of</strong> DYS, while the weak one would be generated<br />
at rest. The value <strong>of</strong> SYS is consequence <strong>of</strong><br />
the comb<strong>in</strong>ed effect <strong>of</strong> both structures, <strong>and</strong><br />
therefore is needed to be bigger than the value<br />
<strong>of</strong> DYS [7].<br />
4 CONCLUSION<br />
In this study we <strong>in</strong>vestigated the rheological<br />
behaviour <strong>of</strong> <strong>Aerosil®</strong> <strong>200</strong> suspensions <strong>in</strong><br />
polypropylene glycol <strong>of</strong> two different molecular<br />
weights (400 <strong>and</strong> <strong>200</strong>0 g/mol), <strong>and</strong> two ma<strong>in</strong><br />
conclusions have been obta<strong>in</strong>ed. First, the length<br />
<strong>of</strong> the polymeric molecules has a great <strong>in</strong>fluence<br />
on the microstructure developed by A<strong>200</strong> <strong>in</strong> PPG.<br />
22787-8<br />
Applied Rheology<br />
Volume 20 · Issue 2
Figure 9:<br />
Experimental determ<strong>in</strong>ation<br />
<strong>of</strong> SYS value as the limit <strong>of</strong><br />
elastic deformation range <strong>of</strong><br />
A<strong>200</strong> suspension <strong>in</strong><br />
PPG<strong>200</strong>0 at 5 %v/v by<br />
apply<strong>in</strong>g a steady stress<br />
sweep from 0 to 100Pa.<br />
A<strong>200</strong> particles <strong>and</strong> PPG molecules tends to form<br />
hydrogen bonds, due to fumed silica particles are<br />
hydrophilic <strong>and</strong> the polymer is a polar organic liquid.<br />
In spite <strong>of</strong> that, it has been found that it is<br />
possible to obta<strong>in</strong> a flocculated suspension. Only<br />
it is needed a dispers<strong>in</strong>g media with cha<strong>in</strong>s long<br />
enough, at least <strong>of</strong> the same order <strong>of</strong> magnitude<br />
that the particle diameter, to reduce the effectiveness<br />
<strong>of</strong> the solvation <strong>of</strong> the particle. Then,<br />
hav<strong>in</strong>g rest<strong>in</strong>g time long enough to let the primary<br />
particle aggregates contact each other,<br />
they are able to develop a volume fill<strong>in</strong>g network<br />
structure. Second, the use <strong>of</strong> the experimental<br />
method proposed theoretically by Cheng [7] has<br />
been successfully applied to a thixoelastic system<br />
(suspension <strong>of</strong> A<strong>200</strong> <strong>in</strong> PPG<strong>200</strong>0 at 5 %v/v)<br />
<strong>in</strong> order to determ<strong>in</strong>e its DYS value. It has also<br />
been found that the value <strong>of</strong> SYS <strong>and</strong> DYS does<br />
not co<strong>in</strong>cide, so more than one k<strong>in</strong>d <strong>of</strong> micro -<br />
structure must have been developed by A<strong>200</strong> <strong>in</strong><br />
PPG<strong>200</strong>0.<br />
5 ACKNOWLEDGEMENTS<br />
We would like to express our gratitude to Degussa<br />
A.G. for supply<strong>in</strong>g k<strong>in</strong>dly <strong>Aerosil®</strong><strong>200</strong>.<br />
REFERENCES<br />
[1] Raghavan SR, Hou J, Khan SA: Colloidal <strong>in</strong>teractions<br />
between particles with tethered nonpolar<br />
cha<strong>in</strong>s dispersed <strong>in</strong> polar media: Direct correlation<br />
between dynamic rheology <strong>and</strong> <strong>in</strong>teractions<br />
parameters, Langmuir 16 (<strong>200</strong>0) 1066-1077.<br />
[2] Raghavan SR, Walls HJ, Khan SA: Rheology <strong>of</strong> silica<br />
dispersions <strong>in</strong> organic liquids: New evidence<br />
<strong>of</strong> solvations forces dictated by hidrogen bond<strong>in</strong>g,<br />
Langmuir 16 (<strong>200</strong>0) 7920-7930.<br />
[3] Barnes HA: The yield stress: a review or 'pantarei':<br />
everyth<strong>in</strong>g flows? J. Non-Newtonian Fluid Mech.<br />
81 (1999) 133-178.<br />
[4] Barnes HA: The ‘<strong>Yield</strong> Stress Myth?’ paper – 21<br />
years on, Appl. Rheol. 17 (<strong>200</strong>7) 43110.<br />
[5] Barnes HA, Walters K: The <strong>Yield</strong> Stress Myth? Rheol.<br />
Acta 24 (1985) 323–6.<br />
[6] Moller PCF, Mewis J, Bonn D: <strong>Yield</strong> Stress <strong>and</strong><br />
thixotropy: on the difficulty <strong>of</strong> measur<strong>in</strong>g yield<br />
stress <strong>in</strong> practice, S<strong>of</strong>t Matter 2 (<strong>200</strong>6) 274-283.<br />
[7] Cheng DCH: <strong>Yield</strong> Stress: A Time-Dependent<br />
Property <strong>and</strong> How to Measure it, Rheol. Acta 25<br />
(1986) 542-554.<br />
[8] Wallevik JE: Rheology <strong>of</strong> suspensions. Fresh Concrete,<br />
Mortar <strong>and</strong> Cement Paste, Ph.D. Thesis,<br />
University <strong>of</strong> Trondheim, Norway (<strong>200</strong>3).<br />
[9] Gal<strong>in</strong>do-Rosales FJ, Rubio-Hernández FJ, Veláz -<br />
quez-Navarro JF, Gómez-Mer<strong>in</strong>o AI: Structural<br />
Level <strong>of</strong> Silica-Fumed Aqueous <strong>Suspensions</strong>, J.<br />
American Ceramic Soc. 90 (<strong>200</strong>7) 1641-1643.<br />
[10] Masalova I, Malk<strong>in</strong> AYa, Foudazi R: <strong>Yield</strong> stress <strong>of</strong><br />
emulsions <strong>and</strong> suspensions as measured <strong>in</strong><br />
steady shear<strong>in</strong>g <strong>and</strong> <strong>in</strong> oscillations, Appl. Rheol.<br />
18 (<strong>200</strong>9) 44790.<br />
[11] Degussa A.G.: Technical Bullet<strong>in</strong> - F<strong>in</strong>e Particles 18<br />
(1989).<br />
[12] Degussa A.G.: Product Information (<strong>200</strong>5).<br />
[13] Degussa A.G.:Technical Bullet<strong>in</strong> - F<strong>in</strong>e Particles 11<br />
(<strong>200</strong>6).<br />
[14] Sánchez A: Colloidal gels <strong>of</strong> fumed silica: Micro -<br />
structure, surface <strong>in</strong>teractions <strong>and</strong> temperature<br />
effects, Ph.D. Thesis, North Carol<strong>in</strong>a State University,<br />
United States (<strong>200</strong>6).<br />
[15] Khan SA, Baker GL, Colson S: Composite Polymer<br />
Electrolytes Us<strong>in</strong>g Fumed Silica Fillers: Rheology<br />
<strong>and</strong> Ionic Conductivity, Chem. Mater. 6 (1994)<br />
2359-2363.<br />
[16] Raghavan SR, Riley M, Fedwik PS, Khan SA: Composite<br />
Polymer Electrolytes Based on Poly(ethylene<br />
glycol) <strong>and</strong> Hydrophobic Fumed Silica:<br />
<strong>Dynamic</strong> Rheology <strong>and</strong> Microstructure, Chem.<br />
Mater. 10 (1998) 244-251.<br />
[17] Nguyen D, Jensen CTB, Kristensen PG: Experimental<br />
<strong>and</strong> modell<strong>in</strong>g studies <strong>of</strong> the flow properties<br />
<strong>of</strong> maize <strong>and</strong> waxy maize starch pastes,<br />
Chem. Eng. J. 70 (1998) 165-171.<br />
[18] Jaúregi-Beloqui B, Fernández-García JC, Orgilés-<br />
Barceló AC, Mahiques-Buj<strong>and</strong>a MM, Martín-<br />
Martínez JM: Rheological properties <strong>of</strong> thermoplastic<br />
polyurethane adhesive solutions<br />
con ta<strong>in</strong><strong>in</strong>g fumed silicas <strong>of</strong> different surface areas,<br />
Inter. J. Adhesion Adhesives 19 (1999) 321-328.<br />
[19] Torró-Palau, AM, Fernández-García JC, Orgilés-<br />
Barceló MM, Martín-Martínez JM: Characterization<br />
<strong>of</strong> polyurethanes conta<strong>in</strong><strong>in</strong>g different silicas,<br />
Inter. J. Adhesion Adhesives 21 (<strong>200</strong>1) 1-9.<br />
[20] Raghavan SR, Khan SA: Shear-<strong>in</strong>duced micro -<br />
structural changes <strong>in</strong> flocculated suspensions <strong>of</strong><br />
fumed silica, J. Rheol. 39 (1995) 1311-1325.<br />
[21] Dullaert K: Constitutive equations for thixotropic<br />
dispersions, Ph.D. thesis, Katholieke Universiteit<br />
Leuven, Belgium (<strong>200</strong>5).<br />
[22] Khan SA, Zoeller NJ: <strong>Dynamic</strong> rheological behaviour<br />
<strong>of</strong> flocculated fumed silica suspensions, J.<br />
Rheol. 37 (1993) 1225-1235.<br />
[23] Bender J, Wagner NJ: Reversible shear thicken<strong>in</strong>g<br />
<strong>in</strong> monodisperse <strong>and</strong> bidisperse colloidal dispersions,<br />
J. Rheol. 40 (1996) 899-916.<br />
Applied Rheology<br />
Volume 20 · Issue 2<br />
22787-9
[24] Lee YS, Wagner NJ: <strong>Dynamic</strong> properties <strong>of</strong> shear<br />
thicken<strong>in</strong>g colloidal suspensions, Rheol. Acta 42<br />
(<strong>200</strong>3) 199-208.<br />
[25] Fischer C, Plummer CJG, Michaud V, Bourban PE,<br />
Manson JAE: Pre- <strong>and</strong> post-transition behavior <strong>of</strong><br />
shear-thicken<strong>in</strong>g fluids <strong>in</strong> oscillat<strong>in</strong>g shear, Rheol.<br />
Acta 46 (<strong>200</strong>7) 1099-1108.<br />
[26] Campo L: Reometría d<strong>in</strong>ámica aplicada al estudio<br />
de surimis elaborados por métodos dist<strong>in</strong>tos y<br />
con diversos <strong>in</strong>gredientes. Importancia de la conservación<br />
en estado congelado, Ph.D. Thesis, University<br />
<strong>of</strong> Vigo, Spa<strong>in</strong> (<strong>200</strong>8).<br />
[27] Campo L, Tovar C: Influence <strong>of</strong> the starch content<br />
<strong>in</strong> the viscoelastic properties <strong>of</strong> surimi gels, J.Food<br />
Eng. 84 (<strong>200</strong>8) 140-147.<br />
[28] Dolz M, González F, Delegido J, Hernández MJ,<br />
Pellicer J: A Time-Dependent Expression for<br />
Thixotropic Areas. Application to Aerosil <strong>200</strong><br />
Hydrogels, J. Pharma. Sci. 89 (<strong>200</strong>0) 790-797.<br />
[29] Mewis J: Thixotropy – A general review, J. Non<br />
Newtonian Fluid Mech. 6 (1979) 1-20.<br />
[30] Barnes HA: Thixotropy – A review, J. Non Newtonian<br />
Fluid Mecha. 70 (1997) 1-33.<br />
[31] Weltman R: Breakdown <strong>of</strong> thixotropic structure<br />
as a function <strong>of</strong> time, J. Appl. Phys. 14 (1943) 343-<br />
350.<br />
[32] Coussot P, Nguyen QD, Huynh HT, Bonn D: Viscosity<br />
bifurcation <strong>in</strong> thixotropic, yield<strong>in</strong>g fluids, J.<br />
Rheol. 46 (<strong>200</strong>2) 573-589.<br />
[33] Dullaert K, Mewis J: Thixotropy: Build-up <strong>and</strong><br />
breakdown curves dur<strong>in</strong>g flow, J. Rheol. 49 (<strong>200</strong>5)<br />
1213-1230.<br />
[34] Pignon F, Magn<strong>in</strong> A, Piau JM: Thixotropic behaviour<br />
<strong>of</strong> clay dispersions: comb<strong>in</strong>ations <strong>of</strong> scatter<strong>in</strong>g<br />
<strong>and</strong> rheometric techniques, J. Rheol. 42 (1998)<br />
1349-1373.<br />
[35] Mezger T: The Rheology H<strong>and</strong>book for users <strong>of</strong><br />
rotational <strong>and</strong> oscillatory rheometers, V<strong>in</strong>cent<br />
Verlag, Germany (<strong>200</strong>2).<br />
22787-10<br />
Applied Rheology<br />
Volume 20 · Issue 2