Static and Dynamic Yield Stresses of Aerosil® 200 Suspensions in ...
Static and Dynamic Yield Stresses of Aerosil® 200 Suspensions in ...
Static and Dynamic Yield Stresses of Aerosil® 200 Suspensions in ...

Create successful ePaper yourself
Turn your PDF publications into a flip-book with our unique Google optimized e-Paper software.
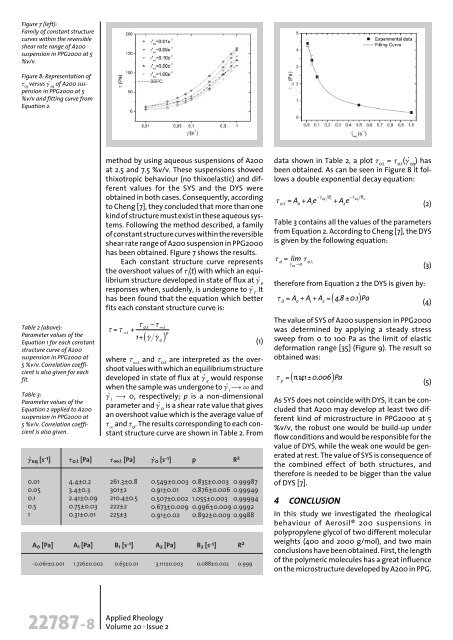
Figure 7 (left):<br />
Family <strong>of</strong> constant structure<br />
curves with<strong>in</strong> the reversible<br />
shear rate range <strong>of</strong> A<strong>200</strong><br />
suspension <strong>in</strong> PPG<strong>200</strong>0 at 5<br />
%v/v.<br />
Figure 8: Representation <strong>of</strong><br />
t oy<br />
versus g· eq<br />
<strong>of</strong> A<strong>200</strong> suspension<br />
<strong>in</strong> PPG<strong>200</strong>0 at 5<br />
%v/v <strong>and</strong> fitt<strong>in</strong>g curve from<br />
Equation 2.<br />
Table 2 (above):<br />
Parameter values <strong>of</strong> the<br />
Equation 1 for each constant<br />
structure curve <strong>of</strong> A<strong>200</strong><br />
suspension <strong>in</strong> PPG<strong>200</strong>0 at<br />
5 %v/v. Correlation coefficient<br />
is also given for each<br />
fit.<br />
Table 3:<br />
Parameter values <strong>of</strong> the<br />
Equation 2 applied to A<strong>200</strong><br />
suspension <strong>in</strong> PPG<strong>200</strong>0 at<br />
5 %v/v. Correlation coefficient<br />
is also given.<br />
method by us<strong>in</strong>g aqueous suspensions <strong>of</strong> A<strong>200</strong><br />
at 2.5 <strong>and</strong> 7.5 %v/v. These suspensions showed<br />
thixotropic behaviour (no thixoelastic) <strong>and</strong> different<br />
values for the SYS <strong>and</strong> the DYS were<br />
obta<strong>in</strong>ed <strong>in</strong> both cases. Consequently, accord<strong>in</strong>g<br />
to Cheng [7], they concluded that more than one<br />
k<strong>in</strong>d <strong>of</strong> structure must exist <strong>in</strong> these aqueous systems.<br />
Follow<strong>in</strong>g the method described, a family<br />
<strong>of</strong> constant structure curves with<strong>in</strong> the reversible<br />
shear rate range <strong>of</strong> A<strong>200</strong> suspension <strong>in</strong> PPG<strong>200</strong>0<br />
has been obta<strong>in</strong>ed. Figure 7 shows the results.<br />
Each constant structure curve represents<br />
the overshoot values <strong>of</strong> t i<br />
(t) with which an equilibrium<br />
structure developed <strong>in</strong> state <strong>of</strong> flux at g· e<br />
responses when, suddenly, is undergone to g· i . It<br />
has been found that the equation which better<br />
fits each constant structure curve is:<br />
where t •l<br />
<strong>and</strong> t 0l<br />
are <strong>in</strong>terpreted as the overshoot<br />
values with which an equilibrium structure<br />
developed <strong>in</strong> state <strong>of</strong> flux at g· e<br />
would response<br />
when the sample was undergone to g· ô•<strong>and</strong><br />
i<br />
g· i<br />
ô 0, respectively; p is a non-dimensional<br />
parameter <strong>and</strong> g· 0<br />
is a shear rate value that gives<br />
an overshoot value which is the average value <strong>of</strong><br />
t •<br />
<strong>and</strong> t 0<br />
. The results correspond<strong>in</strong>g to each constant<br />
structure curve are shown <strong>in</strong> Table 2. From<br />
.<br />
g eq [s -1 .<br />
] t 0l [Pa] t ∞l [Pa] g 0 [s -1 ] p R 2<br />
0.01 4.4±0.2 261.3±0.8 0.549±0.003 0.835±0.003 0.99987<br />
0.05 3.4±0.3 301±2 0.91±0.01 0.876±0.006 0.99949<br />
0.1 2.41±0.09 210.4±0.5 0.507±0.002 1.055±0.003 0.99994<br />
0.5 0.75±0.03 222±2 0.673±0.009 0.996±0.009 0.9992<br />
1 0.31±0.01 225±3 0.91±0.02 0.892±0.009 0.9988<br />
A 0 [Pa] A 1 [Pa] B 1 [s -1 ] A 2 [Pa] B 2 [s -1 ] R 2<br />
-0.061±0.001 1.726±0.002 0.65±0.01 3.111±0.003 0.088±0.002 0.999<br />
(1)<br />
data shown <strong>in</strong> Table 2, a plot t 0l<br />
= t 0l<br />
(g· eq ) has<br />
been obta<strong>in</strong>ed. As can be seen <strong>in</strong> Figure 8 it follows<br />
a double exponential decay equation:<br />
(2)<br />
Table 3 conta<strong>in</strong>s all the values <strong>of</strong> the parameters<br />
from Equation 2. Accord<strong>in</strong>g to Cheng [7], the DYS<br />
is given by the follow<strong>in</strong>g equation:<br />
therefore from Equation 2 the DYS is given by:<br />
(3)<br />
(4)<br />
The value <strong>of</strong> SYS <strong>of</strong> A<strong>200</strong> suspension <strong>in</strong> PPG<strong>200</strong>0<br />
was determ<strong>in</strong>ed by apply<strong>in</strong>g a steady stress<br />
sweep from 0 to 100 Pa as the limit <strong>of</strong> elastic<br />
deformation range [35] (Figure 9). The result so<br />
obta<strong>in</strong>ed was:<br />
(5)<br />
As SYS does not co<strong>in</strong>cide with DYS, it can be concluded<br />
that A<strong>200</strong> may develop at least two different<br />
k<strong>in</strong>d <strong>of</strong> microstructure <strong>in</strong> PPG<strong>200</strong>0 at 5<br />
%v/v, the robust one would be build-up under<br />
flow conditions <strong>and</strong> would be responsible for the<br />
value <strong>of</strong> DYS, while the weak one would be generated<br />
at rest. The value <strong>of</strong> SYS is consequence <strong>of</strong><br />
the comb<strong>in</strong>ed effect <strong>of</strong> both structures, <strong>and</strong><br />
therefore is needed to be bigger than the value<br />
<strong>of</strong> DYS [7].<br />
4 CONCLUSION<br />
In this study we <strong>in</strong>vestigated the rheological<br />
behaviour <strong>of</strong> <strong>Aerosil®</strong> <strong>200</strong> suspensions <strong>in</strong><br />
polypropylene glycol <strong>of</strong> two different molecular<br />
weights (400 <strong>and</strong> <strong>200</strong>0 g/mol), <strong>and</strong> two ma<strong>in</strong><br />
conclusions have been obta<strong>in</strong>ed. First, the length<br />
<strong>of</strong> the polymeric molecules has a great <strong>in</strong>fluence<br />
on the microstructure developed by A<strong>200</strong> <strong>in</strong> PPG.<br />
22787-8<br />
Applied Rheology<br />
Volume 20 · Issue 2