SEASONAL (3-month seasons) - Forestry South Africa
SEASONAL (3-month seasons) - Forestry South Africa
SEASONAL (3-month seasons) - Forestry South Africa

Create successful ePaper yourself
Turn your PDF publications into a flip-book with our unique Google optimized e-Paper software.
<strong>SEASONAL</strong> (3-<strong>month</strong> <strong>seasons</strong>) Forecast Overview for SOUTH AFRICA<br />
Issued on Tuesday the 19 th of April, 2011<br />
1. ENSO Discussion<br />
ENSO conditions have been shown to be the single most determining factor in <strong>South</strong><br />
<strong>Africa</strong>n summer rainfall which can also be effectively forecasted. Other local ocean<br />
basins such as those from the Atlantic and Indian oceans have also shown to have very<br />
strong influences to <strong>South</strong> <strong>Africa</strong>n rainfall, but remain very difficult to forecast for various<br />
reasons. Because of this fact, we look at ENSO forecasts to give an indication of<br />
whether the <strong>seasons</strong> ahead would be abnormally wet (La Nina) or dry (El Nino). Below<br />
are some forecasts from international and local centers:<br />
European Centre for Medium-Range Weather Forecasts (ECMWF)<br />
Climate Prediction Center – National Centers for Environmental Prediction (CPC-<br />
NCEP)<br />
International Research Institute Climate and Society (IRI)<br />
Risk & Vulnerability Atlas (RAVA)<br />
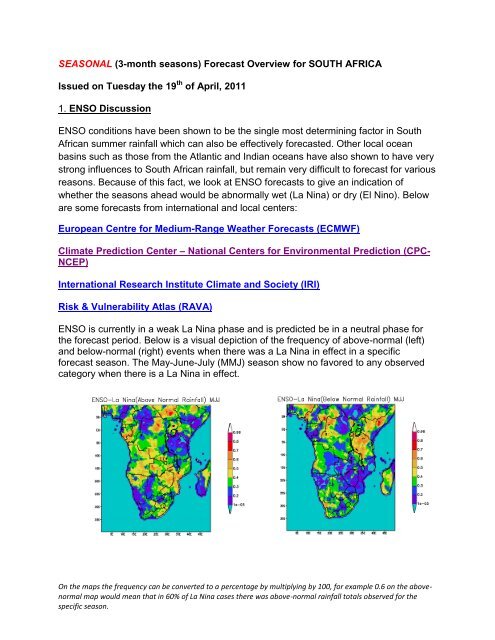
ENSO is currently in a weak La Nina phase and is predicted be in a neutral phase for<br />
the forecast period. Below is a visual depiction of the frequency of above-normal (left)<br />
and below-normal (right) events when there was a La Nina in effect in a specific<br />
forecast season. The May-June-July (MMJ) season show no favored to any observed<br />
category when there is a La Nina in effect.<br />
On the maps the frequency can be converted to a percentage by multiplying by 100, for example 0.6 on the abovenormal<br />
map would mean that in 60% of La Nina cases there was above-normal rainfall totals observed for the<br />
specific season.
2. Rainfall Forecast (May 2011 to Sep 2011)<br />
May-June-July<br />
No Enhanced probabilities for a specific category to occur.<br />
June-July-August<br />
Enhanced probabilities for above-normal rainfall totals are expected for parts of North-<br />
West, Free State and the Northern Cape. Enhanced probabilities for below-normal<br />
rainfall totals are expected parts of Limpopo.<br />
Enhanced Probabilities is considered to be more than 45% probability for a specific category. If there are areas that<br />
do not show an indication of more than 45% probability, then the forecasts for that area is considered to be<br />
uncertain.
July-August-September<br />
Enhanced probabilities for below-normal rainfall totals are expected for parts of<br />
Kwazulu-Natal, Free State, Eastern Cape, Western Cape and Northern Cape.<br />
Enhanced Probabilities is considered to be more than 45% probability for a specific category. If there are areas that<br />
do not show an indication of more than 45% probability, then the forecasts for that area is considered to be<br />
uncertain.
3. Minimum Temperature Forecast (May 2011 to September 2011)<br />
May-June-July<br />
Enhanced probabilities for below-normal minimum temperatures expected for parts of<br />
the Western Cape.<br />
June-July-August<br />
No Enhanced probabilities for a specific category to occur.<br />
Enhanced Probabilities is considered to be more than 45% probability for a specific category. If there are areas that<br />
do not show an indication of more than 45% probability, then the forecasts for that area is considered to be<br />
uncertain.
July-August-September<br />
Enhanced probabilities for above-normal minimum temperatures expected for parts of<br />
the Eastern Cape. Enhanced probabilities for below-normal minimum temperatures<br />
expected for parts of the Western Cape.<br />
Enhanced Probabilities is considered to be more than 45% probability for a specific category. If there are areas that<br />
do not show an indication of more than 45% probability, then the forecasts for that area is considered to be<br />
uncertain.
4. Maximum Temperature Forecast (May 2011 to September 2011)<br />
May-June-July<br />
Enhanced probabilities for above-normal maximum temperatures expected for Limpopo,<br />
North-West, Gauteng, Mpumalanga and parts of Free State, Kwazulu-Natal and Eastern<br />
Cape.<br />
June-July-August<br />
Enhanced probabilities of above-normal maximum temperatures expected for Limpopo.<br />
Enhanced probabilities of below-normal maximum temperatures expected for parts of<br />
the Western Cape and Northern Cape.<br />
Enhanced Probabilities is considered to be more than 45% probability for a specific category. If there are areas that<br />
do not show an indication of more than 45% probability, then the forecasts for that area is considered to be<br />
uncertain.
July-August-September<br />
Enhanced probabilities of above-normal maximum temperatures expected for parts of<br />
Western Cape and Northern Cape. Enhanced probabilities of below-normal maximum<br />
temperatures expected for parts of Limpopo, North-West, Gauteng, Mpumalanga, Free<br />
State, Kwazulu-Natal and Eastern Cape.<br />
Enhanced Probabilities is considered to be more than 45% probability for a specific category. If there are areas that<br />
do not show an indication of more than 45% probability, then the forecasts for that area is considered to be<br />
uncertain.
Forecast of EXTREME rainfall conditions: May-June-July 2011<br />
EXTREMES refer to the highest or lowest 15% of the climatological record. The bar on<br />
the bottom of each map below shows the probabilities of exceeding the highest or<br />
lowest 15% thresholds.<br />
No indication of Extremes in Precipitation for the May-June-July 2011 season.<br />
The Extreme forecast gives users an indication of whether draughts (extremely below-normal rainfall totals) or<br />
floods (extremely above-normal rainfall totals) may occur. Keep in mind that floods and draughts or the lack<br />
thereof may also be a result of land use and water resource management effects as well as extreme rainfall events.
All the forecasts are a result of an objective multi-model prediction system developed at<br />
the <strong>South</strong> <strong>Africa</strong>n Weather Service. This system comprises of long-range forecasts<br />
produced by the following institutions:<br />
Useful internet sites to visit:<br />
Global Forecasting Centre for <strong>South</strong>ern <strong>Africa</strong> (GFCSA)<br />
Risk & Vulnerability Atlas (RAVA)<br />
International Research Institute Climate and Society (IRI)<br />
European Centre for Medium-Range Weather Forecasts (ECMWF)<br />
Climate Prediction Center – National Centers for Environmental Prediction (CPC-<br />
NCEP)<br />
ENQUIRIES<br />
cobus.olivier@weathersa.co.za