FAQ for Bioanalyzer service RNA012804 - VHIR
FAQ for Bioanalyzer service RNA012804 - VHIR
FAQ for Bioanalyzer service RNA012804 - VHIR

Create successful ePaper yourself
Turn your PDF publications into a flip-book with our unique Google optimized e-Paper software.
<strong>FAQ</strong> <strong>for</strong> Agilent 2100 <strong>Bioanalyzer</strong> Service<br />
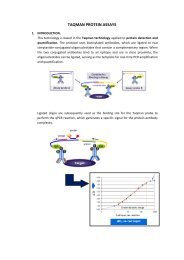
How does the <strong>Bioanalyzer</strong> work?<br />
The bioanalyzer instrument detects biomolecules by laser-induced fluorescence. Each LabChip®<br />
contains an interconnected set of microchannels that is used <strong>for</strong> separation of nucleic acid fragments<br />
based on their size as they are driven through it electrophoretically. During chip preparation, the<br />
channels of the chip are filled with the gel-dye mix. Then, twelve samples and ladder with marker are<br />
loaded in each well. During the chip run, the dye intercalates directly with the analytes (DNA and<br />
RNA assays) or with SDS-micelles (protein assays) and all bands pass the detector at different speeds.<br />
The software automatically compares the unknown samples to the ladder fragments to determine the<br />
concentration of the unknown samples and to identify the ribosomal RNA peaks.<br />
.<br />
How to Assess the Total RNA Data<br />
1. RNA Ladder Results<br />
The RNA 6000 ladder standard is run on every chip from a specified ladder well and is used as a<br />
reference <strong>for</strong> data analysis. The RNA 6000 ladder contains six RNA fragments ranging in size from 0.2<br />
to 6 kb (0.2kb, 0.5kb, 1.0kb, 2.0kb, 4.0kb, and 60.kb) at a total concentration of 150ng/ µl. The<br />
software automatically compares the unknown samples to the ladder fragments to determine the<br />
concentration of the unknown samples and to identify the ribosomal RNA peaks. The ladder also<br />
serves as a built-in quality control measurement of system per<strong>for</strong>mance under standard conditions.<br />
Major features of a successful ladder run are:<br />
• 6 RNA peaks (s/w calls <strong>for</strong> 5 ladder peaks only)<br />
• 1 Marker peak<br />
• All 7 peaks are well resolved<br />
Note: Peak ratios and peak heights <strong>for</strong> the RNA ladder may vary from one batch of RNA 6000 ladder<br />
to the next. Assay per<strong>for</strong>mance will not be affected by this variation.
2. Total RNA Sample Results<br />
The bioanalyzer electropherogram of total RNA shows two distinct ribosomal peaks<br />
corresponding to either18S and 28S <strong>for</strong> eukaryotic RNA or 16S and 23S <strong>for</strong> prokaryotic RNA and a<br />
relatively flat baseline between the 5S and 18S ribosomal peaks.<br />
Major features <strong>for</strong> a successful total RNA run are:<br />
• Two ribosomal peaks: Any mRNA migrating between the ribosomes will be smooth and lack<br />
distinct peaks.<br />
• The baseline between 29 seconds and the 18S ribosomes is relatively flat and free of small<br />
rounded peaks corresponding to smaller RNA molecule. Depending on the RNA extraction<br />
method, the small 5S, 5.8S and tRNA may be present in the electropherogram from 24-27<br />
seconds.<br />
• 1 marker peak<br />
3. Ribosomal RNA ratio and baseline <strong>for</strong> the quality assessment of RNA sample<br />
In general, the height of the 28S ribosomal peak should be twice that, or at least equal to the 18S<br />
ribosomal peak. Variability in this ratio may indicate partial degradation of the sample by ribonuclease<br />
contamination during the purification procedure. In the case of complete sample degradation these<br />
bands will disappear. However, ribosomal ratios will vary according to the species and tissue type as<br />
well according to the RNA extraction method. For a specific tissue, similar values should be found so<br />
that after establishing quality criteria <strong>for</strong> a specific sample type, the ribosomal ratio can be used as a<br />
quick check <strong>for</strong> RNA sample quality.<br />
Beside the ratio, the baseline is a kind of trademark and could use as a secondary parameter <strong>for</strong> the<br />
RNA quality. If you have a flat baseline, your RNA is OK. The more peaks visible (and higher<br />
background) between the two ribosomal bands and below the 18S (16S) band, the worse the sample<br />
quality. In the lower part of the electropherogram around 24 to 29 seconds, 5S RNA and transfer RNA<br />
can be seen because they cannot be separated on the bioanalyzer. Typically, trizol isolations do not<br />
remove 5S and tRNA, while many column-based RNA extraction kit do remove these small RNA<br />
species. In Eukaryotic cells the 5S/tRNA should represent 5 to 10 % (maximum) of the 18S and the<br />
28S. This population of small fragments is composed of several population from 5S to 8S and the
profile is tissue and cell specific. In some Prokaryote cells, there is 20% of messenger and 30 to 40 %<br />
of 5S/tRNA(in<strong>for</strong>mation from Agilent Technology Inc )<br />
4. The Degraded Total RNA<br />
RNase degradation of total RNA samples produces a shift in the RNA size distribution toward<br />
smaller fragments and a decrease in fluorescence signal and the 18S and 28S peak can no longer be<br />
identified with certainty (figure A). Degraded total RNA will lack a smooth baseline and typically<br />
contains multiple peaks that are as large or larger than the ribosomal peaks. The most highly degraded<br />
products have a migration time between 22 and 24 seconds. With more severe degradation (figure B),<br />
the spectrum shifts entirely toward early migration times.<br />
5. Contamination in Total RNA<br />
Example 1:
The peak seen here migrating between 24 and 29 seconds is most likely tRNA, 5S ribosomal RNA, or<br />
a combination of both.<br />
Example 2:<br />
The bump running just after the 28S ribosomal peak is genomic DNA contamination. It is suggested a<br />
DNase1/RNase free treatment to get rid of this genomic DNA contamination.<br />
How to Assess the mRNA Results<br />
1. mRNA Sample Results<br />
Messenger RNA should be checked <strong>for</strong> degradation as well as significant levels of ribosomal RNA<br />
contamination. Intact poly (A)+ RNA samples display broad size distributions. The 18S and 28S peak<br />
can no longer be identified with certainty.
Major features <strong>for</strong> a successful mRNA run are:<br />
• Broad hump: Intact poly (A)+ RNA samples display broad size distributions (as described<br />
above) and the size range can be estimated by overlaying the RNA 6000 ladder containing<br />
RNA fragments of known size (0.2kb, 0.5kb, 1.0kb, 2.0kb,4.0kb and 6.0kb)<br />
• 1 marker peak<br />
2. Degradation of mRNA<br />
As with total RNA, RNase degradation of mRNA shifts the RNA size distribution toward smaller<br />
fragments. The Figure above shows that Poly (A)+ RNA (60 ng/µL) from cultured Jurkat cells was<br />
incubated <strong>for</strong> 15 minutes at room temperature with very dilute RNase A (1 x 10⁻⁶ and 2 x 10⁻⁶<br />
mg/mL, resp.). Samples (1.0-µL aliquots) were analyzed using the RNA 6000 LabChip kit ( Data from<br />
Agilent Technology Inc).<br />
3. Ribosomal RNA Contamination in mRNA Preparations<br />
Too much ribosomal contamination can artificially inflate the measured concentration of starting<br />
mRNA template. The Agilent 2100 bioanalyzer automatically calculates the percent ribosomal RNA in<br />
mRNA samples and can detect as low as five percent contamination. Ribosomal RNA contamination<br />
in mRNA preparations is easily identified by the presence of ribosomal RNA peaks.
How does RNA quantitation on the bioanalyzer compare to RNA quantitation on UV?<br />
In an Agilent Technology application note, results from the bioanalyzer are compared to results<br />
generated with UV and ribogreen. In most of the cases, a good match is found between the 3 methods<br />
<strong>for</strong> RNA quantitation. In some cases, a deviation from the UV value was observed (i.e. > 20%<br />
difference from UV value), the bioanalyzer showed most of the time a lower value than UV. The<br />
explanation <strong>for</strong> this phenomenon is as follows: RNA preps can contain varying amounts of phenol,<br />
genomic DNA and other matrix components that also absorb at 260 nm. If a sample contains one of<br />
these components, the UV value will be higher than the value from the bioanalyzer, which only detects<br />
RNA with the intercalating dye (similarly to detecting RNA via ribogreen).