Financials - Santos
Financials - Santos
Financials - Santos

Create successful ePaper yourself
Turn your PDF publications into a flip-book with our unique Google optimized e-Paper software.
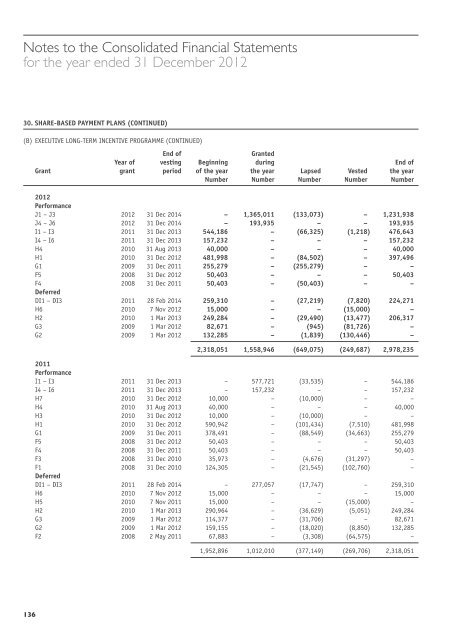
Notes to the Consolidated Financial Statements<br />
for the year ended 31 December 2012<br />
30. Share‐based Payment Plans (continued)<br />
(b) Executive Long‐term Incentive Programme (continued)<br />
End of<br />
Granted<br />
year of vesting Beginning during End of<br />
Grant grant period of the year the year Lapsed Vested the year<br />
Number Number Number Number Number<br />
2012<br />
Performance<br />
J1 – J3 2012 31 Dec 2014 – 1,365,011 (133,073) – 1,231,938<br />
J4 – J6 2012 31 Dec 2014 – 193,935 – – 193,935<br />
I1 – I3 2011 31 Dec 2013 544,186 – (66,325) (1,218) 476,643<br />
I4 – I6 2011 31 Dec 2013 157,232 – – – 157,232<br />
H4 2010 31 Aug 2013 40,000 – – – 40,000<br />
H1 2010 31 Dec 2012 481,998 – (84,502) – 397,496<br />
G1 2009 31 Dec 2011 255,279 – (255,279) – –<br />
F5 2008 31 Dec 2012 50,403 – – – 50,403<br />
F4 2008 31 Dec 2011 50,403 – (50,403) – –<br />
Deferred<br />
DI1 – DI3 2011 28 Feb 2014 259,310 – (27,219) (7,820) 224,271<br />
H6 2010 7 Nov 2012 15,000 – – (15,000) –<br />
H2 2010 1 Mar 2013 249,284 – (29,490) (13,477) 206,317<br />
G3 2009 1 Mar 2012 82,671 – (945) (81,726) –<br />
G2 2009 1 Mar 2012 132,285 – (1,839) (130,446) –<br />
2,318,051 1,558,946 (649,075) (249,687) 2,978,235<br />
2011<br />
Performance<br />
I1 – I3 2011 31 Dec 2013 – 577,721 (33,535) – 544,186<br />
I4 – I6 2011 31 Dec 2013 – 157,232 – – 157,232<br />
H7 2010 31 Dec 2012 10,000 – (10,000) – –<br />
H4 2010 31 Aug 2013 40,000 – – – 40,000<br />
H3 2010 31 Dec 2012 10,000 – (10,000) – –<br />
H1 2010 31 Dec 2012 590,942 – (101,434) (7,510) 481,998<br />
G1 2009 31 Dec 2011 378,491 – (88,549) (34,663) 255,279<br />
F5 2008 31 Dec 2012 50,403 – – – 50,403<br />
F4 2008 31 Dec 2011 50,403 – – – 50,403<br />
F3 2008 31 Dec 2010 35,973 – (4,676) (31,297) –<br />
F1 2008 31 Dec 2010 124,305 – (21,545) (102,760) –<br />
Deferred<br />
DI1 – DI3 2011 28 Feb 2014 – 277,057 (17,747) – 259,310<br />
H6 2010 7 Nov 2012 15,000 – – – 15,000<br />
H5 2010 7 Nov 2011 15,000 – – (15,000) –<br />
H2 2010 1 Mar 2013 290,964 – (36,629) (5,051) 249,284<br />
G3 2009 1 Mar 2012 114,377 – (31,706) – 82,671<br />
G2 2009 1 Mar 2012 159,155 – (18,020) (8,850) 132,285<br />
F2 2008 2 May 2011 67,883 – (3,308) (64,575) –<br />
1,952,896 1,012,010 (377,149) (269,706) 2,318,051<br />
136