snto - Santos
snto - Santos
snto - Santos

You also want an ePaper? Increase the reach of your titles
YUMPU automatically turns print PDFs into web optimized ePapers that Google loves.
s<br />
nt<br />
os<br />
a<br />
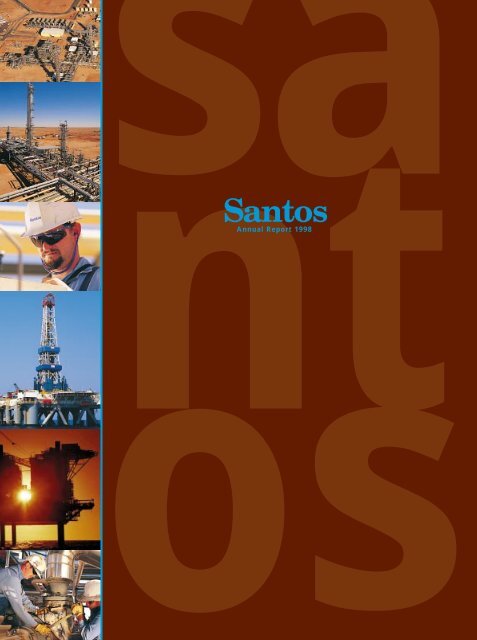
<strong>Santos</strong><br />
Annual Report 1998
<strong>Santos</strong> is Australia’s largest onshore oil and gas<br />
producer. It is a world-scale specialist oil and<br />
gas company with assets of over $4 billion and<br />
annual production of over 45 million barrels of<br />
oil equivalent.<br />
The core of <strong>Santos</strong>’ business is a majority<br />
working interest in the Cooper/Eromanga<br />
Basins oil and gas fields located in central<br />
Australia. <strong>Santos</strong> produces gas, ethane, oil and<br />
gas liquids from the Basins and is the operator<br />
of production and exploration operations.<br />
Australia<br />
South East Asia<br />
United States<br />
<strong>Santos</strong> Ltd ACN 007 550 923<br />
Incorporated in Adelaide, South Australia on 18 March 1954. Quoted on the official list of the Australian Stock Exchange Ltd and also<br />
the New Zealand Exchange. <strong>Santos</strong> American Depository Receipts issued by Morgan Guaranty in the USA are sponsored and are<br />
quoted on the NASDAQ system in the USA.<br />
Contents<br />
1998 Report to Shareholders<br />
Aims, Values, Strategy, Highlights ..........2<br />
Results Overview .....................................4<br />
Chairman’s Overview...............................5<br />
Managing Director’s Review ...................6<br />
Review of Performance<br />
Financial Performance ....................12<br />
Exploration.......................................14<br />
Development ...................................16<br />
Reserves...........................................18<br />
<strong>Santos</strong>’ Australian Gas Business...19<br />
Production........................................20<br />
Environment ....................................21<br />
Board of Directors..................................22<br />
Business Units Operations....................24<br />
10 Year Summary...................................28<br />
Production Statistics..............................29<br />
<strong>Santos</strong> Group Interests..........................30<br />
Glossary ..................................................32<br />
Corporate Governance ..........................33<br />
Directors’ Statutory Report ...................38<br />
Financial Report .....................................42<br />
Stock Exchange and<br />
Shareholder Information.......................76
Although the majority of the Company’s assets<br />
are located onshore Australia, business<br />
development in recent years has expanded<br />
<strong>Santos</strong>’ portfolio of interests offshore Australia<br />
and in South East Asia and the United States.<br />
Company Profile<br />
1998<br />
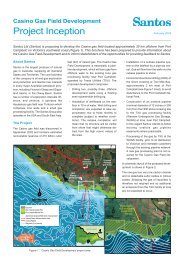
<strong>Santos</strong>’ Australian and South East Asian Interests<br />
Pacific Ocean<br />
Korinci-Baru<br />
Bentu<br />
Bangko<br />
Indonesia<br />
Seram<br />
Warim<br />
Papua New<br />
Guinea<br />
Sampang<br />
Timor Gap<br />
Exploration<br />
Timor Sea<br />
Bonaparte<br />
Gulf<br />
Darwin<br />
Production<br />
Oil pipeline<br />
Browse Basin<br />
McArthur River<br />
Gas pipeline<br />
Carnarvon Basin<br />
Mt Isa<br />
Ethane pipeline<br />
Gas pipeline<br />
under<br />
construction<br />
Amadeus Basin<br />
Alice Springs<br />
Cooper/Eromanga Basins<br />
Surat Basin &<br />
Denison Trough<br />
Gladstone<br />
Brisbane<br />
Indian Ocean<br />
Kalgoorlie<br />
Perth<br />
Adelaide<br />
Sydney<br />
Australia<br />
Melbourne<br />
Canberra<br />
0 1000<br />
kilometres<br />
Southern Ocean<br />
Otway Basin<br />
Gippsland Basin<br />
Bass Basin<br />
Hobart<br />
1
Objective<br />
The Company’s objective is to provide its shareholders with<br />
a superior investment in the oil and gas industry.<br />
The Ocean Ambassador which drilled Ewing Bank 994#1. (Photo courtesy of Diamond Offshore Drilling, Inc)<br />
Aims<br />
Values<br />
■<br />
■<br />
■<br />
Provide consistent growth in<br />
shareholder value<br />
Seek best practice standards in all<br />
facets of operations<br />
Perform at a level above that of<br />
its peers<br />
■<br />
■<br />
■<br />
Safe working places<br />
Ethical behaviour<br />
Responsible environmental<br />
practices and management<br />
2<br />
■<br />
Pursue opportunities to grow<br />
the business
Strategy<br />
<strong>Santos</strong> aims to generate increasing value for its<br />
shareholders by:<br />
■<br />
Maximising the value of<br />
the Company’s core South<br />
Australian oil and gas<br />
business<br />
■<br />
Continuing the growth of<br />
the Queensland, Northern<br />
Territory and Offshore<br />
Australia businesses<br />
■<br />
Developing the existing<br />
business in the United<br />
States and South East<br />
Asia<br />
Aims/Values/Strategy/1998 Highlights<br />
1998 Highlights<br />
Exploration<br />
Drilled 81 exploration wells with a 54% success rate. ■ ■ ■<br />
1998<br />
Discovery of Legendre South (oil), Mutineer (oil) and<br />
John Brookes (gas) fields. Extension of the Reindeer gas field<br />
confirmed by the Caribou-1 well.<br />
■<br />
Discovery of Ewing Bank 994#1 oil field (Gulf of Mexico).<br />
■<br />
Discovery of 14 gas fields in the Cooper/Eromanga Basins ■ ■<br />
and one gas field in the Denison Trough.<br />
Acquired interests in an additional six<br />
exploration blocks in the Gulf of Mexico.<br />
Acquisitions/Divestments<br />
Successful divestment of <strong>Santos</strong> Europe Limited.<br />
■<br />
■<br />
Acquired additional interests in south-west Queensland via<br />
the acquisition of Gulf Australian Hydrocarbons Limited.<br />
■<br />
Acquisition of a 31% interest in PDL1 in Papua New Guinea which contains<br />
the majority of the Hides gas field. (Announced subsequent to 31 December 1998.<br />
Acquisition subject to Papua New Guinea Government approval.)<br />
■<br />
Development<br />
Stag (Carnarvon Basin), Elang/Kakatua/Kakatua North (Timor Gap) ■ ■<br />
and SE Gobe (Papua New Guinea) oil field development projects<br />
completed and brought onto production.<br />
Completion of the Ballera Gas Plant Phase 3 development project and the<br />
commencement of the Phase 4 expansion for increasing sales within Queensland.<br />
■<br />
Eugene Island 335 oil and gas field development project commenced.<br />
■<br />
An active development program including 25 gas development wells ■ ■<br />
undertaken onshore Australia focused on sustaining and increasing gas<br />
production to meet increasing customer demand.<br />
46 million boe reserves developed in onshore Australian fields to ■ ■<br />
meet increasing gas demand and optimise oil production.<br />
Development studies to commercialise the Minerva (Offshore Otway Basin), ■ ■<br />
Bentu (Indonesia), Reindeer (Carnarvon Basin) and John Brookes (Carnarvon Basin)<br />
gas fields, the Ewing Bank 994#1 (Gulf of Mexico) and Legendre (Carnarvon<br />
Basin) oil fields and the Bayu-Undan (Timor Gap) gas/condensate field.<br />
Marketing<br />
Supplied first south-west Queensland gas to Mt Isa.<br />
Signed a further contract for East Spar Gas.<br />
■<br />
■<br />
3
Results Overview<br />
Key Financial Results<br />
1998 1997<br />
Earnings before interest expense and tax $334.6 m $376.5 m<br />
Profit attributable to shareholders after tax $176.3 m $206.2 m<br />
Cash flow from operations $457.6 m $460.7 m<br />
Exploration and development expenditure $504.5 m $575.2 m<br />
Earnings per share 29.1 cents 35.3 cents<br />
Dividends per share (fully franked) 25.0 cents 25.0 cents<br />
Total shareholders’ equity $1939.2 m $1919.0 m<br />
Return on average shareholders’ equity 9.1% 11.8%<br />
Net debt/shareholders’ equity 66.0% 58.1%<br />
Net interest cover (times) 4.4 5.4<br />
Production<br />
MMboe<br />
Net Profit After Tax (a) 1998<br />
$million<br />
A$/bbl<br />
Reserves<br />
MMboe<br />
46<br />
44<br />
42<br />
40<br />
38<br />
36<br />
34<br />
32<br />
30<br />
94 95 96 97 98<br />
200 40<br />
175<br />
35<br />
150<br />
30<br />
125<br />
25<br />
100<br />
20<br />
75<br />
15<br />
50<br />
10<br />
25<br />
5<br />
0<br />
0<br />
1994 1995 1996 1997<br />
Average Crude Oil Price<br />
Operating Profit after Tax<br />
(a) before abnormals<br />
1600<br />
1400<br />
1200<br />
1000<br />
800<br />
600<br />
400<br />
200<br />
0<br />
94 95 96 97 98<br />
Outlook<br />
Outcome<br />
January 1998 December 1998<br />
Production growth from committed new projects.<br />
Completion of three major oil development projects.<br />
Provision of gas to MIM Holdings Ltd (formerly Mt Isa<br />
Mines) at Mt Isa.<br />
117 exploration wells to be drilled.<br />
1998 operating profit to be similar to or exceed 1997,<br />
subject to oil and liquids prices remaining at around<br />
current levels.<br />
Increase in production of 11.0%.<br />
Three major oil development projects brought<br />
onto production.<br />
Commenced gas delivery to Mt Isa.<br />
81 exploration wells drilled (target revised downwards due<br />
to fall in world oil price).<br />
Reduction in operating profit of 14.5% reflecting fall in the<br />
average oil price realised by <strong>Santos</strong> of 23.6% in Australian<br />
dollar terms.<br />
4
Chairman’s Overview 1998<br />
The Board’s aim is to provide shareholders with a<br />
superior investment in the oil and gas industry. While<br />
1998 was a disappointing year for investors in the oil<br />
and gas sector generally, the total return to <strong>Santos</strong><br />
shareholders (capital appreciation plus dividends)<br />
during the year exceeded the Australian Stock<br />
Exchange Energy Accumulation Index by 11.0%.<br />
In addition, tax paying domestic investors have<br />
also benefited from the full franking of dividends.<br />
Results Overview/Chairman’s Overview<br />
J A Uhrig<br />
Chairman<br />
<strong>Santos</strong> made solid progress in 1998 despite the<br />
difficult external environment.<br />
Record production was achieved for the third year<br />
in a row. In recent years the Company has invested<br />
substantial sums in acquisitions, exploration and<br />
development and the returns from these investments<br />
are reflected in the increasing volume of production.<br />
<strong>Santos</strong>’ growing production base and domestic gas<br />
business mitigated the impact of the fall in oil prices.<br />
However, notwithstanding overall production growth<br />
of 11.0%, the fall in the oil price brought about a<br />
14.5% reduction in earnings.<br />
This is a disappointing outcome but one which has<br />
been experienced throughout the oil industry in 1998.<br />
Looking forward, the Company’s focus will be on<br />
internal cost reductions and reducing capital<br />
expenditure, while maintaining the investment<br />
necessary for continuing long-term growth.<br />
The Board has confidence in the long-term outlook for<br />
the Company. A final dividend of 13 cents per share<br />
was declared by the Directors making a total dividend<br />
payment of 25 cents per share for the year. This is the<br />
same level as the 1997 dividend.<br />
The final dividend will be paid on 30 April 1999 to<br />
those shareholders registered in the books of the<br />
Company on 8 April 1999 in respect of fully paid<br />
shares held at record date.<br />
The dividend continues to be fully franked.<br />
Over the year the number of <strong>Santos</strong> shareholders<br />
increased from 65,459 to 81,300. The Board is<br />
delighted by the interest shown in the Company by<br />
so many new shareholders.<br />
Responsible environmental management and<br />
workplace safety continue to be priorities for the<br />
Board. The Company’s environmental policies and<br />
performance are governed by a Board Committee of<br />
which I am Chairman. The Company’s<br />
comprehensive environmental management<br />
processes are detailed on pages 21 and 35 of this<br />
report. Occupational health and safety is also an<br />
important matter.<br />
The provision of a safe working place is an issue<br />
which is governed closely by the Board.<br />
In conclusion, <strong>Santos</strong> has made substantial progress<br />
in 1998. This progress positions the Company well<br />
for the future.<br />
On behalf of the Board, I wish to record our<br />
appreciation and thanks to the Company’s<br />
management and employees for their contribution<br />
throughout 1998. I also acknowledge the support of<br />
the Company’s shareholders.<br />
J A Uhrig<br />
Chairman<br />
15 March 1999<br />
1998<br />
5
Managing Director’s Review 1998<br />
In March 1999, <strong>Santos</strong> acquired an approximate 7.5%<br />
economic interest in Retention Lease Vic/RL2, which<br />
contains part of the Kipper gas field and is located in<br />
Bass Strait in the Gippsland Basin. Under the terms<br />
of the renewal of Retention Lease Vic/RL2, which<br />
was granted in December 1998, the participants will<br />
be undertaking a work program to evaluate the<br />
commercial viability of the Kipper field.<br />
6<br />
N R Adler<br />
Managing Director<br />
<strong>Santos</strong> achieved record production and sales of<br />
45.6 million barrels of oil equivalent (boe) and<br />
45.1 million boe respectively in 1998.<br />
Earnings in 1998 were $176.3 million, a reduction of<br />
14.5% on the record 1997 earnings. This resulted from<br />
the fall in the average oil price received of 23.6% in<br />
Australian dollar terms, which more than offset<br />
record production.<br />
Operating cash flow was $457.6 million, close to the<br />
record achieved in 1997.<br />
Low oil prices are providing <strong>Santos</strong> with<br />
opportunities to acquire additional interests on<br />
attractive terms.<br />
Three such opportunities were realised by the<br />
Company in early 1999. In February, <strong>Santos</strong><br />
announced that it had entered into an agreement<br />
for the acquisition of a 31% interest in Petroleum<br />
Development Licence 1 (PDL1) in Papua New Guinea,<br />
subject to Papua New Guinea Government approval.<br />
PDL1 contains the majority of the Hides gas field.<br />
The Hides field is a world-class resource which is<br />
estimated to contain proven and probable reserves in<br />
excess of five trillion cubic feet of gas. This acquisition<br />
is of strategic importance. Reserves from the<br />
Hides gas field are planned to be incorporated into<br />
the proposed Papua New Guinea to Queensland<br />
gas project.<br />
The Company also acquired interests in PEP132 (40%)<br />
and PEP108 (50%) onshore in the Otway Basin. This<br />
transaction was finalised in early 1999 and provides<br />
the Company with opportunities to increase gas sales<br />
in Victoria.<br />
Production<br />
1998 was a record year for <strong>Santos</strong> production,<br />
marked by growing production outside the<br />
company’s traditional core areas.<br />
This resulted from the completion of four major<br />
development projects during the year – the Stag oil<br />
field in the Carnarvon Basin, the Elang/Kakatua/Kakatua<br />
North oil fields in the Timor Gap, the SE Gobe oil<br />
field in Papua New Guinea and the infrastructure<br />
required to provide gas to Mt Isa. Total production<br />
reached 45.6 million barrels of oil equivalent (boe),<br />
an increase of 11.0% from the 1997 level.<br />
Exploration<br />
The Company also maintained an active exploration<br />
program in 1998, with a total success rate of 54%.<br />
Total reserves fell slightly from 1,009 million boe at<br />
the end of 1997 to 966 million boe. This reflects the<br />
sale of <strong>Santos</strong> Europe and its associated reserves,<br />
record production, revisions and the fact that a<br />
number of the discoveries made during the year<br />
require further appraisal and development studies<br />
prior to reserve booking.<br />
Business Unit Development<br />
<strong>Santos</strong> aims to generate increasing value for its<br />
shareholders by:<br />
■ Maximising the value of its South Australian<br />
gas business.<br />
■ Continuing the growth of its<br />
Queensland/Northern Territory and Offshore<br />
Australia businesses.<br />
■ Building up its businesses in the US and South<br />
East Asia.<br />
Additional progress was made during the year in<br />
creating further value in all of the regions in which<br />
the Company operates.
1998 was a record year for <strong>Santos</strong> production,<br />
marked by growing production outside the<br />
Company’s traditional core areas.<br />
Managing Director’s Review<br />
South Australia<br />
The South Australian Cooper Basin is becoming a<br />
mature producing area. Notwithstanding this, total<br />
production during the year increased by 3.8% to<br />
24.4 million boe.<br />
Total gas sales increased to customers in South<br />
Australia, New South Wales and the Australian Capital<br />
Territory and first gas was supplied to Victoria<br />
following the completion of the interconnecting<br />
pipeline between New South Wales and Victoria.<br />
The long-term value of the South Australia Business<br />
Unit was also enhanced by a successful exploration<br />
program. The Accelerated Exploration Program, which<br />
commenced in 1996, has added over 430 petajoules<br />
(PJ) gross of gas reserves. The South Australian<br />
Cooper Basin exploration licences held by <strong>Santos</strong> –<br />
PELs 5&6 – expired in February 1999. However <strong>Santos</strong><br />
holds, or has applied for, production licences covering<br />
all discoveries made in the area prior to the licence<br />
expiry. There remains scope for continued exploration<br />
and increasing reserves in these production licences.<br />
Queensland and Northern Territory<br />
<strong>Santos</strong>’ activities in Queensland and the Northern<br />
Territory have expanded greatly in recent years.<br />
They now make a significant contribution to<br />
the Company’s results and have considerable<br />
further potential.<br />
During the year <strong>Santos</strong> increased its interests in<br />
south-west Queensland through the acquisition of<br />
Gulf Australian Hydrocarbons Limited.<br />
A milestone in Queensland was reached during<br />
1998 with the first gas sales to MIM Holdings Ltd<br />
(formerly Mt Isa Mines) at Mt Isa. There were also<br />
increased gas sales in the Northern Territory.<br />
<strong>Santos</strong> and its joint venturers are now the major gas<br />
producers in Queensland.<br />
The Company also has significant undeveloped gas<br />
reserves in south-west Queensland which have the<br />
commercial advantage of being rich in natural gas<br />
liquids. There is potential to add to these reserves<br />
and they are well located<br />
not only for sales in Key Achievements<br />
Queensland, but also in<br />
Four major development<br />
New South Wales, projects were completed<br />
Victoria and South and brought onto<br />
Australia.<br />
production.<br />
Development of these<br />
reserves is underway.<br />
The Challum field was<br />
successfully developed<br />
in 1998 and appraisal<br />
of the Barrolka field<br />
continued, with<br />
production anticipated to<br />
commence in 1999.<br />
A record level of<br />
production was achieved.<br />
Gas sales to MIM<br />
Holdings Ltd at Mt Isa<br />
commenced.<br />
An active exploration<br />
program was undertaken<br />
for an overall success<br />
rate of 54%.<br />
Offshore Australia<br />
The Offshore Australia Business Unit developed<br />
further during the year with increased gas sales and<br />
the commencement of production from the Stag and<br />
Elang/Kakatua/Kakatua North oil fields.<br />
The Stag oil field commenced production in May<br />
and marks <strong>Santos</strong>’ first significant production in the<br />
Carnarvon Basin.<br />
Unfortunately field production has fallen short of<br />
expectations. The operator, Apache Corporation, is<br />
proposing a number of initiatives to improve<br />
production.<br />
The Elang/Kakatua/Kakatua North oil fields<br />
commenced production in July and during the<br />
year reached a peak of 42,475 barrels of oil per<br />
day, well ahead of expectations.<br />
The East Spar gas/condensate project continued to<br />
perform well, with gas sales reaching 80 terajoules<br />
(TJ) per day.<br />
1998<br />
7
Managing Director’s Review continued<br />
8<br />
A new gas contract was signed to supply the Kwinana<br />
Ammonia Project, commencing in mid-1999. This has<br />
necessitated construction of a second pipeline from<br />
Varanus Island to the Dampier Bunbury pipeline.<br />
By early 2000 it is expected that East Spar will be<br />
supplying approximately 16% of the existing Western<br />
Australian domestic gas market.<br />
The Business Unit’s exploration program during<br />
the year focused on Northern Australia and the<br />
Carnarvon Basin. Results in Northern Australia were<br />
disappointing, with no discoveries. Results in the<br />
Carnarvon Basin, however, were more encouraging.<br />
Further details of the discoveries are provided on<br />
page 15.<br />
<strong>Santos</strong> now has interests in three potential<br />
development projects in the Carnarvon Basin resulting<br />
from exploration in 1997 and 1998: Legendre (oil),<br />
Reindeer (gas) and John Brookes (gas). Development<br />
studies on these discoveries progressed.<br />
Studies were undertaken on the proposal to develop<br />
the Bayu-Undan gas/condensate field as a liquids<br />
stripping gas re-injection project.<br />
Work is also continuing on possible development<br />
of the Petrel-Tern and Minerva gas fields and other<br />
hydrocarbon resources in the Business Unit’s<br />
portfolio.<br />
Over the last three years production by the Offshore<br />
Australia Business Unit has grown to make a<br />
meaningful contribution to the Group.<br />
South East Asia<br />
<strong>Santos</strong> believes that Papua New Guinea provides<br />
long-term potential.<br />
During 1998 the Group commenced its first<br />
production in Papua New Guinea through its interest<br />
in the SE Gobe oil project.<br />
Production commenced in April and reached a<br />
maximum of 20,565 barrels of oil per day.<br />
<strong>Santos</strong>’ drilling program in Papua New Guinea<br />
commenced in early 1999 with the drilling of Stanley-1<br />
in PPL 157. In February 1999 the Company announced<br />
the Hides acquisition referred to earlier.<br />
United States<br />
<strong>Santos</strong> USA also provides longer term potential.<br />
During the year the Group sold its United Kingdom<br />
North Sea interests and increased its emphasis in<br />
the United States.<br />
In particular, <strong>Santos</strong> USA is expanding its<br />
exploration portfolio in the shallow water Gulf of<br />
Mexico. The Group now has interests in 24 offshore<br />
blocks. During the year two wells were drilled which<br />
lead to one oil discovery (Ewing Bank 994#1).<br />
Development of the Eugene Island 335#1 oil and<br />
gas discovery also proceeded.<br />
Over time it is expected that <strong>Santos</strong> USA will<br />
become an increasing contributor to Group results.<br />
Investments<br />
QCT Resources Limited<br />
<strong>Santos</strong> has a significant interest in QCT Resources<br />
Limited (“QRL”). QRL has a 32.37% interest in the<br />
Central Queensland Coal Associates (CQCA) and<br />
Gregory Joint Ventures and 100% of the South<br />
Blackwater mines. During the year QRL purchased<br />
an additional 2.79% in the CQCA and Gregory Joint<br />
Ventures from AMP for $97.6 million.<br />
The short-term outlook for seaborne traded coal is<br />
uncertain. In December 1998 agreement was reached<br />
with the Japanese Steel Mills to reduce the price<br />
of hard coking coals from the CQCA and Gregory<br />
Joint Venture mines for the Japanese financial year<br />
commencing 1 April 1999 by an average of US$9 per<br />
tonne, or approximately 18%. Agreements for the<br />
supply of coking coal from South Blackwater are<br />
being negotiated. Significant progress was made in<br />
1998 in improving the competitiveness of CQCA and<br />
Gregory Joint Venture mines by reducing the total<br />
workforce by approximately 25% and implementing<br />
programs to improve the utilisation of equipment and<br />
coal deposits. The full benefit of these cost reductions<br />
should be realised in 1999.<br />
In the longer term the company may also benefit<br />
from a lower Australian dollar/US dollar exchange<br />
rate once current currency hedges expire and a<br />
reduction in rail freight rates.<br />
During the year <strong>Santos</strong> increased its shareholding in<br />
QRL from 34.9% to 36.4% through conversion of a<br />
portion of its holding of QRL convertible notes and
<strong>Santos</strong>’ employees made a significant<br />
contribution to the results achieved in 1998.<br />
Managing Director’s Review<br />
participation in QRL’s Dividend Reinvestment Plan.<br />
The remainder of <strong>Santos</strong>’ holding of QRL convertible<br />
notes was sold during the year pursuant to an<br />
on-market buy-back undertaken by QRL. The sale<br />
realised $27.2 million.<br />
An external expert’s opinion has been obtained,<br />
confirming that the long-term strategic value of the<br />
investment in QCT Resources Ltd exceeds the<br />
Company’s carrying value at year end 1998.<br />
Other Investments<br />
<strong>Santos</strong> has a 12.5% interest in Oil Company of<br />
Australia and an 18.3% interest in Magellan<br />
Petroleum Australia Limited. These companies have<br />
interests in oil and gas production, mainly in<br />
Queensland and the Northern Territory respectively.<br />
Human Resources<br />
There were a number of important senior<br />
management appointments during the year.<br />
Dr John Armstrong, previously head of <strong>Santos</strong>’<br />
Americas and Europe Business Unit, was<br />
appointed General Manager of the Offshore Australia<br />
Business Unit.<br />
He was succeeded as President of <strong>Santos</strong> USA<br />
Corporation by Mr Michael Baugh who joined <strong>Santos</strong><br />
after a long and successful career in the oil and gas<br />
industry, both in the United States and Australia.<br />
A third significant appointment was that of<br />
Dr Ashok Khurana as General Manager Petroleum<br />
Development and Planning. Dr Khurana,<br />
acknowledged as a world expert on gas deliverability<br />
from tight reservoirs, joins <strong>Santos</strong> after more than 30<br />
years’ international experience in the industry.<br />
More generally, the progress achieved by <strong>Santos</strong> in<br />
1998 reflects the significant contribution made by<br />
all employees.<br />
Production and Earnings Outlook<br />
With oil prices at 12 year lows, 1999 is expected to<br />
be another difficult year.<br />
Key Appointments<br />
During the first two during 1998<br />
months of 1999 the<br />
Dr John Armstrong<br />
price of West Texas<br />
General Manager, Offshore<br />
Intermediate Crude Australia Business Unit<br />
averaged US$12.26 per<br />
barrel, 15% below the<br />
Mr Michael Baugh<br />
President, <strong>Santos</strong> USA<br />
average price of<br />
US$14.43 in 1998. These Dr Ashok Khurana<br />
prices are well below the General Manager,<br />
Petroleum Development<br />
five-year average price<br />
and Planning<br />
of US$18.50.<br />
The company is actively seeking to further mitigate<br />
the fall in world oil prices through increasing<br />
production, conserving capital, curtailing spending<br />
and enhancing productivity.<br />
Production and sales volumes increased to record<br />
levels in 1998 and are likely to be higher again in<br />
1999 with the full year effect of recent development<br />
projects. In 1998 operating costs per boe produced<br />
fell for the third year in a row and it is planned to<br />
reduce them further in 1999.<br />
Spending on exploration and development is being<br />
reduced by approximately $170 million. This reflects<br />
the completion of a number of major development<br />
projects, the Company’s substantial level of reserves<br />
– with an average life of over 20 years – and the<br />
impact of low oil prices.<br />
Looking to the longer term, the Company’s outlook<br />
is positive with a good suite of exploration and<br />
development opportunities.<br />
N R Adler<br />
Managing Director<br />
15 March 1999<br />
1998<br />
9
Modec Venture 1 floating production, storage and offloading facility (Elang/Kakatua/Kakatua North - Timor Gap)<br />
In 1998 <strong>Santos</strong> production reached record levels.<br />
In 1998 <strong>Santos</strong> began production from four<br />
10
In 1998 <strong>Santos</strong> achieved an exploration success rate of 54%.<br />
major development projects.<br />
11
Review of Performance<br />
Financial Performance<br />
Record sales volumes were achieved in 1998. This growth largely offset<br />
the impact of the lower oil price, with the result being a marginal fall in<br />
sales revenue.<br />
The volume of product sold in 1998 increased by 9.2%<br />
to a record 45.1 million boe.<br />
Gas sales were 183.6 PJ, an increase of 7.1%,<br />
reflecting increased sales in Queensland, South<br />
Australia and Western Australia.<br />
Sales of crude oil increased by 15.6% as a result of<br />
the new oil fields which came onto production during<br />
the year. There were also increases in sales of LPG<br />
and condensate.<br />
Average prices received for sales gas remained<br />
stable. However, the prices received for crude oil fell<br />
by 35.2% in US dollar terms and 23.6% in Australian<br />
dollar terms. Prices received for ethane, condensate<br />
and LPG also fell.<br />
As a result, notwithstanding the strong growth<br />
in sales volume, sales revenue fell by 1.2% to<br />
$769.4 million.<br />
Operating Expenses<br />
Average operating costs per boe produced fell to $4.49,<br />
the lowest in four years. However, total operating<br />
costs increased by 9.2% due to increased production.<br />
Royalties paid decreased due to lower oil prices.<br />
The depreciation and depletion expense increased by<br />
9.0% to $225.9 million. Average depreciation and<br />
depletion per boe produced fell from $5.04 to $4.95.<br />
There was a writedown in exploration expenditure<br />
of $4.9 million (nil in 1997) in respect of interests<br />
in the Browse Basin, Bula/Seram in Indonesia and<br />
New Zealand.<br />
Earnings Before Interest Expense and Tax<br />
(EBIT)<br />
Earnings before interest expense and tax fell by 11.1%<br />
to $334.6 million. Interest on higher borrowings<br />
associated with the funding of the Company’s<br />
development program increased the net interest<br />
expense by $13.1 million to $67.3 million.<br />
Operating profit before income tax fell by 17.1% to<br />
$267.3 million. Income tax on operating profit fell by<br />
$25.1 million to $91.0 million, primarily due to the fall<br />
in operating profit before tax.<br />
In 1998, gas sales commenced for supply to the Mica Creek Power Station<br />
12
Operating Profit After Tax<br />
A net profit of $176.3 million was achieved in 1998,<br />
compared with a result of $206.2 million in 1997.<br />
The sale of <strong>Santos</strong> Europe contributed $7.4 million to<br />
earnings reflecting sale proceeds of $137.0 million<br />
and book value of assets at time of sale of $129.6<br />
million.<br />
No abnormal items were recorded in either 1997<br />
or 1998.<br />
Cash Flow<br />
Cash flow from operations was $457.6 million, close to<br />
the record level achieved in 1997.<br />
Operating cash flow was 75.6 cents per share.<br />
Dividends of $151.4 million (1997 – $142.5 million)<br />
were paid to shareholders.<br />
Balance Sheet<br />
The level of net debt increased during 1998 to<br />
$1,280.0 million (1997 – $1,114.2 million) due<br />
to funding of capital expenditure together with the<br />
increase in the Australian dollar equivalent of US<br />
dollar dominated debt. The net debt to equity ratio at<br />
the end of the year was 66.0% (1997 – 58.1%).<br />
After providing for the final dividend of 13 cents per<br />
share, shareholders’ equity at the end of the year was<br />
$1,939.2 million.<br />
Treasury Policies and Funding<br />
The Company’s borrowing facilities are summarised<br />
in Note 16 to the Financial Statements and the<br />
structure of its share capital is set out in Note 18.<br />
The approach to management of foreign exchange,<br />
interest rate and commodity price risk exposures are<br />
detailed in Note 33.<br />
“Year 2000” Issue<br />
<strong>Santos</strong> continues to progress its Year 2000<br />
preparedness with the overall objective of minimising<br />
the potential for a material disruption to the Company’s<br />
business due to the rollover of the century dates.<br />
Information technology and process control systems,<br />
identified as critical to maintaining the Company’s<br />
business, have been assessed for Year 2000<br />
compliance and, where relevant, corrective action<br />
implemented. By the end of June 1999, remedial<br />
action for all identified critical process control<br />
systems and for all but five of the identified critical<br />
information technology systems is scheduled to have<br />
been completed and tested as compliant. The five<br />
information technology production reporting systems<br />
are scheduled to be replaced at year end 1999, with<br />
the replacement systems scheduled to be tested for<br />
Year 2000 compliance by the end of September 1999.<br />
The Company is reviewing and, where considered<br />
necessary, will be revising existing contingency plans<br />
or, based on a business risk analysis, creating<br />
additional contingency plans with a view to ensuring<br />
appropriateness to Year 2000 issues.<br />
<strong>Santos</strong> is dependent upon a number of third parties<br />
having Year 2000 compliant systems, including<br />
suppliers, contractors, pipeline operators, major<br />
customers and operators of joint ventures in which<br />
the Company holds an interest. <strong>Santos</strong> continues to<br />
closely monitor progress with identified key third<br />
parties and to participate in oil and gas industry<br />
forums to promote awareness and to share industry<br />
knowledge of Year 2000 issues. However, an<br />
assurance that Year 2000 problems will not affect<br />
<strong>Santos</strong>’ business cannot be given.<br />
<strong>Santos</strong> has factored Year 2000 matters into its<br />
decisions on new systems investment. In June 1998,<br />
the Company reported that the estimated overall<br />
costs associated with Year 2000 issues over the four<br />
year period commencing 1996 was approximately<br />
$18 million, inclusive of the capital investment of<br />
$11.5 million to replace its legacy commercial<br />
systems. As at 31 December 1998, approximately<br />
75% of these costs had been expended and current<br />
indications are that this estimate will not be exceeded.<br />
Further information on the Company’s response to the<br />
Year 2000 issue appears at page 35 of this Annual<br />
Report and in the releases to the Australian Stock<br />
Exchange Ltd made in June 1998 and March 1999.<br />
Review of Performance<br />
Financial Performance<br />
13
Review of Performance<br />
Exploration<br />
<strong>Santos</strong> achieved some significant exploration successes in 1998.<br />
1998 Exploration<br />
A total of 67 wildcat and 14 appraisal wells were<br />
drilled in 1998 for a cost of $180.7 million. The<br />
program achieved an overall success rate of 54%<br />
(52% on wildcats, 64% on appraisals). At the end of<br />
the year 28 million boe of proved and probable<br />
reserves had been booked. This figure excluded some<br />
notable discoveries, namely John Brookes-1,<br />
Mutineer-1 and Ewing Bank 994#1. The Caribou-1<br />
appraisal of the Reindeer gas field was also excluded.<br />
Further appraisal and development studies are<br />
required on these resources. The annual finding cost<br />
for the booked reserves was $6.52/boe. This figure<br />
excludes the potential reserves associated with the<br />
discoveries noted above, but includes the expenditure<br />
1998 Exploration Results<br />
Wells Drilled Successful Wells Success<br />
Gas Oil Gas Oil Rate %<br />
South Australia 32 2 20 0 59<br />
Queensland 14 3 9 1 59<br />
Offshore Australia 4 9 2 2 31<br />
South East Asia 0 4 0 2 50<br />
US 12 1 7 1 62<br />
Total 62 19 38 6 54<br />
incurred in undertaking the respective drilling.<br />
Notwithstanding the 1998 result the five-year average<br />
finding cost is $1.75/boe.<br />
Exploration Strategy<br />
<strong>Santos</strong> has maintained a consistent exploration<br />
strategy over the last few years. Key aspects of the<br />
strategy include:<br />
■ Active exploration in established core areas.<br />
■ Focused exploration in new areas, concentrating<br />
in areas of known hydrocarbons.<br />
■ Aggressive and cost effective application of<br />
modern technology by skilled and motivated<br />
professional staff working to a defined process.<br />
■ Disciplined technical assessment of chance of<br />
success, potential resource size and economic<br />
outcome with a strong emphasis on review<br />
and audit.<br />
■ Active and rigorous management of the<br />
Company’s exploration portfolio.<br />
Testing John Brookes-1 in the Carnarvon Basin<br />
14
1998 Exploration Highlights<br />
■ A successful appraisal of the Legendre oil field<br />
in the Carnarvon Basin through the drilling of<br />
Legendre South-1.<br />
■ An encouraging oil discovery in the Mutineer -1<br />
well in the Carnarvon Basin. The well, drilled as a<br />
follow-up to Pitcairn-1, has further confirmed the<br />
potential of <strong>Santos</strong>-operated permit WA-191-P.<br />
■ A substantial gas discovery in good quality<br />
reservoirs in the WA-214-P well, John Brookes-1,<br />
in the Carnarvon Basin.<br />
■ A significant extension of the Reindeer gas field<br />
proven by the Caribou-1 well in Carnarvon Basin<br />
permit WA-209-P.<br />
■ The discovery of 11 new gas fields from the<br />
Accelerated Exploration Program in South<br />
Australia.<br />
■ The south-west Queensland gas program in<br />
ATP 259 which discovered three new gas fields.<br />
■ An encouraging discovery in the Warim PSC<br />
in Irian Jaya where Kau-2 encountered a<br />
non-commercial oil accumulation.<br />
■ Continued participation in the Gulf of Mexico lease<br />
sales with the award of six more permits as well as<br />
other acreage gained through farm-ins. A farm-in<br />
well, Ewing Bank 994#1, encountered 185 feet of net<br />
oil pay and was suspended as a new field discovery.<br />
1999 Exploration Program<br />
Following on from the strong reserve position built<br />
up over the last few years, the 1999 exploration<br />
program is reduced in scope and expenditure. Again,<br />
the risk reward characteristics of the portfolio of<br />
opportunities will be monitored, prioritised and<br />
activities adjusted. The focus is on a balance between<br />
those projects that, if successful, can lead to early<br />
cash flows, with some investment in higher risk,<br />
more long-term opportunities.<br />
Features of the 1999 program include:<br />
1999 Indicative Exploration Program<br />
Wells<br />
$million<br />
Onshore Australia<br />
Cooper/Eromanga 16 33.8<br />
Other 12 7.2<br />
Offshore Australia 4 20.0<br />
South East Asia 5 15.0<br />
US 9 24.0<br />
Total 46 100.0<br />
Technology<br />
<strong>Santos</strong> continues to implement appropriate<br />
technologies with a view to enhancing exploration<br />
performance.<br />
3D Seismic<br />
3D seismic, a higher effort acquisition and<br />
processing technique, provides enhanced definition<br />
of the subsurface. Using state-of-the-art software on<br />
modern geoscience work stations, geophysicists are<br />
better able to locate hydrocarbon bearing structures,<br />
to see more detail in the reservoir distribution and<br />
often differentiate between water and hydrocarbon<br />
bearing reservoirs.<br />
High Resolution Stratigraphy<br />
Since 1987 <strong>Santos</strong> has maintained an in-house<br />
palynology laboratory. This has allowed the detailed<br />
evaluation of the age and environmental deposition of<br />
the rocks in the Cooper Basin and in specific areas of<br />
offshore Australia. With this information, more specific<br />
interpretations as to the whereabouts of further<br />
reserves can be made.<br />
Review of Performance<br />
Exploration<br />
■<br />
■<br />
■<br />
■<br />
28 wells to be drilled onshore Australia.<br />
The program in Offshore Australia, which will<br />
concentrate on the Carnarvon Basin.<br />
Further drilling in Papua New Guinea.<br />
Drilling activity in the Gulf of Mexico in acreage<br />
acquired through lease sales and farm-ins.<br />
15
Review of Performance<br />
Development<br />
Total development expenditure in 1998 was $324 million, reflecting major<br />
projects, development studies and the work program undertaken in<br />
existing producing fields. With the completion of major projects, overall<br />
1999 development expenditure is expected to decrease to slightly above<br />
$200 million.<br />
Development Activity<br />
During 1998 three major oil development projects<br />
were completed – SE Gobe (Papua New Guinea), Stag<br />
(Carnarvon Basin) and Elang/Kakatua/Kakatua North<br />
(Timor Gap).<br />
1998 Development Expenditure<br />
$ million<br />
South Australia 99.5<br />
Queensland/Northern Territory 110.5<br />
Offshore Australia 73.9<br />
South East Asia 9.4<br />
US 13.6<br />
Other 16.9<br />
Total 323.8<br />
Production from SE Gobe commenced in April 1998.<br />
At the end of 1998 production had reached 18,855<br />
barrels of oil per day and was expected to increase.<br />
The Stag oil field – operated by Apache Corporation –<br />
commenced production in May 1998. The field did not<br />
achieve full production capacity over the year. This<br />
was due to excess gas production from the larger<br />
than anticipated overlying gascap associated with the<br />
field and less than anticipated reservoir pressure<br />
support from the water injection wells. The operator,<br />
Apache Corporation, is proposing a number of<br />
initiatives to improve production.<br />
Elang/Kakatua/Kakatua North commenced production<br />
in July 1998. The fields performed strongly, with<br />
production at times exceeding expected rates.<br />
In addition to these major oil projects other<br />
development projects were undertaken.<br />
Phase 3 of the Ballera Gas Plant development in<br />
south-west Queensland was completed to enable the<br />
supply of gas to MIM Holdings Ltd at Mt Isa.<br />
Following this, the Phase 4 expansion commenced<br />
which will increase Ballera’s capacity to<br />
approximately 155 terajoules per day. This expansion<br />
was completed in early 1999. It is planned to provide<br />
gas to WMC (formerly Western Mining Corporation) at<br />
Mt Isa.<br />
In the US, the Eugene Island 335 oil and gas<br />
development in the Gulf of Mexico was substantially<br />
completed for the commencement of production in<br />
early 1999.<br />
Ballera Gas Plant<br />
16
Further longer-term growth opportunities were<br />
pursued by way of initiation of a number of<br />
development studies. For Offshore Australia these<br />
included the Bayu-Undan gas/condensate field in the<br />
Timor Gap, the Reindeer and John Brookes gas fields<br />
and the Legendre oil field in the Carnarvon Basin and<br />
the Minerva gas field in the Victorian sector of the<br />
Otway Basin. In Indonesia, studies continued on the<br />
Bentu gas field. In the Gulf of Mexico, a detailed<br />
reserve and feasibility study was undertaken on the<br />
Ewing Bank 994 #1 oil field which was discovered<br />
during the year.<br />
The 1998 work program also included development<br />
to optimise production from existing producing fields.<br />
Onshore Australia, an active gas program was<br />
undertaken which involved the drilling of 25 new<br />
development wells and the implementation of<br />
41 development projects. The onshore oil program<br />
involved the drilling of 17 development wells and the<br />
completion of four other projects.<br />
Work continued during the year on an appraisal and<br />
development plan for the Barrolka Complex. It is<br />
planned to connect five wells into the production<br />
system in 1999 to build on short-term production<br />
tests so far implemented. The longer-term production<br />
performance of these wells will be monitored and<br />
the results used to assess the effectiveness of well<br />
productivity improvement initiatives.<br />
Low Deliverability Gas Commercialisation<br />
The Cooper Basin has a large resource of gas, in<br />
excess of 10 trillion cubic feet, which will typically not<br />
flow to surface without assistance from advanced<br />
drilling and completion technologies. Much of this<br />
is located in the Nappamerri Trough Petroleum<br />
Production Licences in South Australia, granted to the<br />
South Australian Cooper Basin Joint Venture in 1997,<br />
conditional upon expenditure of $100 million over<br />
15 years.<br />
During 1998, tight sands were tested in several wells<br />
both within and outside the Nappamerri Trough.<br />
Fracture stimulations specifically designed for tight<br />
sands were carried out in six wells. Laboratory and<br />
field-testing was also carried out on technologies<br />
with potential for helping in the commercialisation<br />
of tight gas.<br />
Results to date indicate that, in appropriate geological<br />
situations, application of enhanced drilling and<br />
stimulation technology can help in unlocking a<br />
substantial proportion of this resource to commercial<br />
production. Work is continuing to further improve<br />
these technologies and to identify the best areas for<br />
their application within the Nappamerri Trough and<br />
elsewhere in the Cooper Basin.<br />
Technology<br />
<strong>Santos</strong> strives to improve the performance of its<br />
producing interests through the use of cost effective<br />
technology.<br />
Monobore Drilling<br />
Monobores are now the preferred design for wells<br />
drilled in the Cooper Basin for certain reservoir<br />
situations. The design achieves a cost saving over<br />
a conventional well because a separate, internal<br />
production tubing is not required. Forty-six<br />
monobores were drilled in 1998 (some for<br />
exploration) and the majority of 1999 wells will<br />
comprise monobore configuration.<br />
Fracture Stimulation<br />
Fracture stimulation continues to be a prime tool for<br />
well productivity improvement. Twenty-four projects<br />
were undertaken in 1998 and results continue to be<br />
encouraging. Flow rates on productive wells can be<br />
increased up to four-fold using this technique, and it<br />
is also a prime tool for obtaining or improving flow<br />
from low permeability reservoirs.<br />
Horizontal Wells<br />
The most significant new development technology is<br />
the use of horizontal wells. Such wells are drilled to<br />
deviate from the vertical, so they can run almost<br />
horizontally across the reservoir sand. This allows<br />
more contact of the reservoir with the wellbore,<br />
significantly enhancing productivity. Four horizontal<br />
wells were drilled in mature Cooper Basin fields in<br />
1998, and have proved highly effective.<br />
Review of Performance<br />
Development<br />
17
Review of Performance<br />
Reserves<br />
<strong>Santos</strong> has an average reserve life of 24 years for gas and 15 years for oil<br />
and liquids.<br />
Reserves<br />
Proved and probable reserves at the end of 1998<br />
were 966 million boe, a decrease of 43 million boe<br />
from the record reserves in 1997. This figure does not<br />
include a number of exploration discoveries referred<br />
to on page 14. Further appraisal and development<br />
studies are required on these resources.<br />
The reduction in reserves derives from production<br />
of 45.6 million boe, a net divestment of six million<br />
boe and re-evaluation of reserves of 19 million boe.<br />
This was partially offset by a gain of 28 million boe<br />
from booked exploration discoveries, mainly in the<br />
Cooper Basin.<br />
The net divestment results from the sale of <strong>Santos</strong><br />
Europe Limited (13 million boe reserves), partially<br />
offset by the acquisition of Gulf Australian<br />
Hydrocarbon’s south-west Queensland interests.<br />
1998 Business Unit Reserves<br />
MMboe<br />
United States 10<br />
Offshore<br />
Australia 206<br />
South East Asia 22<br />
South Australia 346<br />
Total Cooper/Eromanga Basins Gas Reserves (Gross)<br />
PJ<br />
5600<br />
4900<br />
4200<br />
3500<br />
2800<br />
2100<br />
1400<br />
700<br />
0<br />
1988 1989 1990 1991 1992 1993 1994 1995 1996 1997 1998<br />
Reserves added through exploration and revision<br />
Reserves in the absence of exploration<br />
Resources<br />
The year-end reserves figures exclude discovered oil<br />
and gas accumulations which currently fall outside<br />
the definition of proved and probable reserves. This<br />
may result from uncertainty about their extent or the<br />
ability to be economically recovered. <strong>Santos</strong> holds<br />
interests in a number of oil and gas accumulations<br />
which, pending further appraisal of the resource, fall<br />
into the “Resources” category.<br />
Queensland<br />
and NT 382<br />
Proved and Probable Hydrocarbon Reserves*<br />
Sales Gas Crude Oil Condensate LPG Total<br />
(incl ethane) million million ‘000 million<br />
PJ barrels barrels tonnes boe<br />
18<br />
Estimated reserves at 31 December 1997 4545 96 88 5789 1009<br />
1998 Production (185) (9) (3) (286) (46)<br />
Additions from 1998 Exploration 125 2 2 244 28<br />
Acquisitions/Divestments (13) (5) 1 22 (6)<br />
Field revisions (73) (4) 1 (249) (19)<br />
Estimated reserves at 31 December 1998 4399 80 89 5520 966<br />
* A definition of proved and probable reserves is provided in the Glossary on page 32.
<strong>Santos</strong>’ Australian Gas Business<br />
<strong>Santos</strong> and its joint venturers produce most of the<br />
gas consumed in New South Wales, Queensland,<br />
South Australia, the Australian Capital Territory and<br />
the Northern Territory. The Company also supplies<br />
gas to Victoria and Western Australia.<br />
0 2000<br />
kilometres<br />
East<br />
Spar<br />
Carnarvon<br />
Carnarvon<br />
Basin<br />
Perth<br />
Pt Hedland<br />
Dampier<br />
Mt Newman<br />
Kalgoorlie<br />
Australia<br />
Darwin<br />
Tennant<br />
Creek<br />
McArthur<br />
River<br />
Alice<br />
Springs<br />
Moomba<br />
Adelaide<br />
Otway Basin<br />
Mt. Isa<br />
Ballera<br />
Papua New<br />
Guinea<br />
Hides<br />
Gas<br />
Field<br />
Melbourne<br />
Townsville<br />
Hobart<br />
Gladstone<br />
Sydney<br />
Canberra<br />
Oil pipeline Gas pipeline Ethane pipeline<br />
Gas pipeline under Contracted gas 2P gas reserve<br />
construction<br />
locations<br />
Brisbane<br />
Gas is generally sold under long-term take-or-pay<br />
contracts, with prices indexed to consumer prices.<br />
The graph below shows <strong>Santos</strong>’ Australian gas sales.<br />
Sales volumes in 1998 reached a record 175.6 PJ.<br />
Gas sales are increasing in each of the States in<br />
which the Company operates.<br />
In Western Australia the first gas sales from East<br />
Spar started in late 1996 and sales continue to grow<br />
as further contracts commence.<br />
In Queensland, gas sales to Brisbane from the<br />
Cooper Basin commenced in 1997 and in 1998 first<br />
sales to Mt Isa began.<br />
In early 1999 the Company announced its intention<br />
to acquire a 25% interest in the Hides Gas Field in<br />
Papua New Guinea, subject to Papua New Guinea<br />
Government approval. This potential acquisition is of<br />
strategic importance to the Group as the field is a<br />
world-class gas resource which is estimated to contain<br />
proven and probable reserves in excess of five trillion<br />
cubic feet of gas. Reserves from this field are planned<br />
to be incorporated into the proposed Papua New<br />
Guinea to Queensland gas project, should this<br />
project proceed.<br />
<strong>Santos</strong> recently began supplying small quantities of<br />
gas to Victoria. Gas from the South Australian<br />
Cooper Basin is being supplied by AGL through the<br />
interconnection recently completed between New<br />
South Wales and Victoria.<br />
Gas produced by <strong>Santos</strong> is now consumed in all<br />
mainland States.<br />
<strong>Santos</strong> also has large reserves which are all well<br />
placed for future contracts.<br />
Review of Performance<br />
Reserves/<strong>Santos</strong>’ Australian Gas Business<br />
<strong>Santos</strong>’ Australian Gas Sales<br />
PJ<br />
180<br />
170<br />
160<br />
150<br />
140<br />
130<br />
120<br />
110<br />
100<br />
1993 1994 1995 1996 1997 1998<br />
<strong>Santos</strong>’ Interest in Uncontracted Gas Reserves (a) PJ as at Dec 1998 (b)<br />
Total Gas <strong>Santos</strong>’ Uncontracted <strong>Santos</strong>’<br />
Reserves in Share Gas in Share of<br />
<strong>Santos</strong>’ of Gas <strong>Santos</strong>’ Uncontracted<br />
Acreage Reserves Acreage Gas<br />
South Australia 2770 1650 1160 700<br />
SW Queensland 2390 1400 1400 840<br />
Surat/Bowen 225 125 150 90<br />
Amadeus 600 365 315 200<br />
East Spar 495 220 120 55<br />
Total 6480 3760 3145 1885<br />
(a) Includes ethane.<br />
(b) Australian producing areas.<br />
19
Review of Performance<br />
Production<br />
<strong>Santos</strong>’ production grew by 11.0% in 1998 reflecting the commencement of<br />
production from new areas of interest, in the Carnarvon Basin, Timor Gap,<br />
Papua New Guinea and the supply of gas to Mt Isa.<br />
Production increased by 4.5 million boe to a record<br />
45.6 million boe in 1998.<br />
This reflected completion of a number of major<br />
projects during the year, which are described on page<br />
16 of this report. A full year’s production from each of<br />
these projects will contribute to a further increase in<br />
production in 1999.<br />
Group Production<br />
1998 1997<br />
Sales Gas and Ethane (PJ) 184.9 172.2<br />
Crude Oil (million barrels) 8.5 6.9<br />
Condensate (million barrels) 3.1 2.5<br />
LPG (‘000 tonnes) 285.7 263.6<br />
Total (million boe) 45.6 41.1<br />
Just over half of this increase was associated with oil<br />
and liquids production (2.3 million boe increase). The<br />
remainder (2.2 million boe) reflected increased sales<br />
gas and ethane production. Production increased in<br />
all Business Units except for <strong>Santos</strong> USA. (A table<br />
detailing Group production is located on page 29).<br />
<strong>Santos</strong>’ production has increased from 36.3 million<br />
boe per annum in 1993 to 45.6 million boe during<br />
1998.<br />
<strong>Santos</strong>’ Production Growth<br />
MMboe<br />
46<br />
44<br />
42<br />
40<br />
38<br />
36<br />
34<br />
32<br />
30<br />
1993 1994 1995 1996 1997 1998<br />
Major Oil Projects Profile<br />
Stag Development Project<br />
Elang/Kakatua/Kakatua North<br />
Development Project<br />
SE Gobe Development Project<br />
Project: Oil field development.<br />
Floating storage and offloading<br />
facility.<br />
Project: Oil field development.<br />
Floating production, storage<br />
and offloading facility.<br />
Project: Oil field development.<br />
Location: Papua New Guinea<br />
20<br />
Location: Carnarvon Basin<br />
<strong>Santos</strong> interest: 54.17%<br />
Production: Commenced May 1998<br />
Location: Timor Gap<br />
<strong>Santos</strong> interest: 21.43%<br />
Production: Commenced July 1998<br />
<strong>Santos</strong> interest: 6.975%<br />
Production: Commenced April 1998
Review of Performance<br />
Environment<br />
The <strong>Santos</strong> Australian Environmental Management System provides a<br />
comprehensive system of environmental management. This section of the<br />
report describes the <strong>Santos</strong> Australian Environmental Management System,<br />
which has been progressively developed over the past decade and a half.<br />
Review of Performance<br />
Environmental management at <strong>Santos</strong> is conducted in<br />
accordance with a formal environmental management<br />
system, based originally on the British Standard for<br />
Environmental Management (BS 7750), and then on the<br />
International Standards ISO 14000 series. The System has<br />
been progressively refined since its inception in 1991 and<br />
is currently being utilised by the Company’s Business<br />
Units to not only meet the specific legislative and<br />
regulatory requirements in which operations occur, but<br />
also to go beyond mere compliance wherever appropriate.<br />
The foundation of the <strong>Santos</strong> Australian Environmental<br />
Management System (SAEMS) is the Company’s<br />
environmental policy. The key element of the policy is<br />
that <strong>Santos</strong> is committed to conducting all its onshore<br />
and offshore exploration and production activities in an<br />
environmentally responsible manner. The policy also<br />
states that <strong>Santos</strong> has established and will maintain<br />
environmental standards consistent with developments<br />
in technology, industry codes of practice and all relevant<br />
statutory requirements.<br />
To test the Company’s compliance with its stated<br />
environmental objectives, <strong>Santos</strong> conducts regular<br />
environmental audits which are undertaken by its own<br />
environmental staff, as well as by specialist external<br />
environmental advisers. State and Territory regulatory<br />
authorities also conduct environmental audits and<br />
undertake field visits to the Company’s operational sites.<br />
Further details are provided on pages 35 and 39.<br />
The Company’s Environmental Management System has<br />
been refined and tailored to suit the specific nature of<br />
the Company and the environments in which operations<br />
occur. Individual responsibility for the environment has<br />
been promoted by the <strong>Santos</strong> Board and the Company’s<br />
senior management, with line management clearly<br />
charged with being the primary “champions” of<br />
responsible environmental behaviour.<br />
In order to achieve the Company’s environmental<br />
objectives in the field, particular emphasis has been<br />
placed on the process of environmental training and<br />
induction for both the <strong>Santos</strong> and contractor workforce.<br />
The total process of environmental management within<br />
the Company is overseen by the Environmental<br />
Committee of the <strong>Santos</strong> Board (chaired by the Chairman<br />
of the Board) which was formed in 1994. The Company’s<br />
Business Units present a detailed overview of their<br />
environmental management practices and procedures,<br />
together with performance, to the Committee.<br />
<strong>Santos</strong> strives to attain a balance between achieving<br />
standards of environmental excellence and maintaining a<br />
cost efficient and integrated approach to safe, technically<br />
proficient exploration and production activities in the<br />
many areas of the Company’s operations.<br />
Production/Environment<br />
Coongie Lakes<br />
Before seismic survey<br />
3 months after seismic survey<br />
12 months after seismic survey<br />
These photographs provide visual documentation of the environmental management process as applied to the 1997 Western Prospects<br />
Seismic Survey at Coongie Lakes.<br />
21
Board of Directors<br />
John Allan Uhrig AO<br />
DUniv, Hon. Decon, BSc, FAIM<br />
Age 70. Director since<br />
3 December 1991 and Chairman<br />
since 15 February 1994. Chairman<br />
of the Environmental Committee<br />
of the Board and also Chairman<br />
of <strong>Santos</strong> Finance Ltd. Chairman<br />
of Westpac Banking Corporation<br />
and The Australian Minerals and<br />
Energy Environment Foundation.<br />
Former Chairman of Rio Tinto Ltd<br />
and former Deputy Chairman of<br />
Rio Tinto PLC. Until 1985 was<br />
Managing Director of Simpson<br />
Holdings Ltd.<br />
Stephen Gerlach<br />
LLB<br />
Age 53. Director since<br />
5 September 1989. Chairman of<br />
the Audit Committee and<br />
member of the Environmental<br />
Committee of the Board.<br />
Chairman of Amdel Ltd,<br />
Equitorial Mining N.L. and<br />
Elders Australia Ltd. Director of<br />
Southcorp Holdings Ltd, Futuris<br />
Corporation Ltd, Beston Pacific<br />
Corporation Limited and Elders<br />
Rural Services Ltd. Former<br />
Managing Partner of the Adelaide<br />
legal firm, Finlaysons.<br />
John Walter McArdle<br />
FCPA<br />
Age 52. Executive Director since<br />
5 September 1995 and Executive<br />
General Manager – Commercial<br />
of <strong>Santos</strong> Ltd. Chairman of<br />
Australian National Railways<br />
Commission. Director of QCT<br />
Resources Ltd Group and <strong>Santos</strong><br />
Ltd subsidiary companies. Former<br />
Managing Director of Delhi<br />
Petroleum Pty Ltd.<br />
Norman Ross Adler AO<br />
BCom, MBA<br />
Age 54. Managing Director since<br />
7 November 1984, member of<br />
the Audit and Environmental<br />
Committees of the Board and<br />
also Chairman of other <strong>Santos</strong><br />
Ltd subsidiary companies.<br />
Director of the Commonwealth<br />
Bank of Australia, QCT Resources<br />
Ltd Group and Telstra<br />
Corporation Ltd. Member of the<br />
Corporations and Securities Panel<br />
and Business Council of<br />
Australia.<br />
Peter Charles Barnett<br />
FCPA<br />
Age 58. Director since 31 October<br />
1995 and member of the Audit<br />
Committee of the Board.<br />
Chairman of Norwich Union<br />
Financial Services Group. Deputy<br />
Chairman of Smorgon Steel<br />
Group Limited. Director of Mayne<br />
Nickless Ltd, Australian Media &<br />
Communications Investments<br />
Limited, Ericsson Australia Pty<br />
Ltd and the Institute of Public<br />
Affairs. Former Managing<br />
Director and Chief Executive<br />
Officer of Pasminco Ltd and<br />
Chief Executive Officer of EZ<br />
Industries Ltd.<br />
22<br />
Ian Webber<br />
John McArdle<br />
Peter Barnett
Michael Anthony O’Leary<br />
DipMinE, BSc, FAusIMM, FAIM<br />
Age 63. Director since 15 October<br />
1996 and member of the<br />
Environmental Committee of the<br />
Board. Deputy Chairman of Bank<br />
of Western Australia Ltd. Former<br />
Chairman of Hamersley Iron,<br />
Argyle Diamonds, Dampier Salt<br />
and former Director of Rio Tinto<br />
Ltd and Rio Tinto PLC.<br />
Professor Judith Sloan<br />
BA (Hons), MA, MSc<br />
Age 44. Director since<br />
5 September 1994. Professor of<br />
Labour Studies at the Flinders<br />
University of South Australia.<br />
Chairman of SGIC Holdings Ltd<br />
and Director of Mayne Nickless<br />
Ltd and SGIO Insurance Limited.<br />
Part-time Commissioner,<br />
Productivity Commission.<br />
Ian Ernest Webber AO<br />
BE, ATS, FCIT, FAIM<br />
Age 63. Director since<br />
16 February 1993 and member<br />
of the Audit Committee of the<br />
Board. Chairman of ASEA Brown<br />
Boveri Advisory Board and<br />
Director of Pacific Dunlop Ltd<br />
and WMC Ltd. Former Managing<br />
Director and Deputy Chairman<br />
of Chrysler Australia Ltd and<br />
Managing Director of Mitsubishi<br />
Motors Australia Ltd. Former<br />
Chairman of Mayne Nickless<br />
Ltd Group.<br />
Board of Directors<br />
Ross Adler<br />
John Uhrig<br />
Michael O’Leary<br />
Stephen Gerlach<br />
Judith Sloan<br />
23
Business Units<br />
Operations<br />
South Australia<br />
Queensland and Northern Territory<br />
Operational Profile<br />
Cooper/Eromanga Basins<br />
(South Australia)<br />
■ Exploration and Production<br />
■ Average interest 59%<br />
Port Bonython Liquids Processing<br />
Plant<br />
■ LPG extraction and liquids<br />
processing<br />
Otway Basin<br />
■ Exploration acreage<br />
Cooper/Eromanga Basins<br />
(South-west Queensland)<br />
■ Exploration and Production<br />
■ Average interest 61%<br />
Surat/Bowen Basins<br />
■ Exploration and Production<br />
Amadeus Basin<br />
■ Exploration and Production<br />
Strategy<br />
The South Australia Business Unit’s<br />
strategy is focused on increasing<br />
the Business Unit’s contribution<br />
to Group earnings through gas<br />
marketing and control of<br />
development and operating costs.<br />
The strategy of the Queensland<br />
and Northern Territory Business<br />
Unit is to increase its contribution<br />
to Group earnings through<br />
commercialisation and costeffective<br />
development of its<br />
substantial gas reserves, together<br />
with continuing exploration to<br />
increase reserves.<br />
Operations 1998<br />
Production 24.4 mmboe<br />
Reserves 346 mmboe<br />
Production 14.1 mmboe<br />
Reserves 382 mmboe<br />
24
OABU USABU SEABU<br />
Offshore Australia South East Asia United States<br />
Business Units<br />
Exploration Acreage<br />
■ Timor Sea, Timor Gap, Bonaparte<br />
Gulf, Browse Basin, Carnarvon<br />
Basin, Otway Basin, Bass Basin<br />
and Gippsland Basin<br />
Production<br />
■ Crude oil: Stag and Chervil fields<br />
(Carnarvon Basin); Elang/Kakatua/<br />
Kakatua North field (Timor Gap);<br />
Jabiru and Challis fields<br />
(Timor Sea)<br />
■ Sales gas and condensate: East<br />
Papua New Guinea<br />
■ Exploration Acreage<br />
■ Oil production from SE Gobe field<br />
Indonesia<br />
■ Exploration Acreage: Warim,<br />
Bentu, Bangko, Korinci-Baru,<br />
Seram and Sampang PSCs<br />
■ Operator of Bentu, Korinci-Baru<br />
and Sampang PSCs<br />
New Zealand<br />
■ Exploration Acreage<br />
Offshore exploration and<br />
production in the Gulf of Mexico.<br />
Onshore exploration and<br />
production focused on the<br />
Texas/Louisiana Gulf Coast and the<br />
Arkoma Basin in Oklahoma.<br />
Operations<br />
Spar field (Carnarvon Basin)<br />
The Offshore Australia Business<br />
Unit’s strategy is to increase its<br />
contribution to Group earnings<br />
through exploration and<br />
development. Development is<br />
focused on existing undeveloped<br />
reserves and the opportunities<br />
which arise through exploration,<br />
emphasising opportunities near<br />
infrastructure.<br />
The South East Asia Business<br />
Unit’s strategy is focused on<br />
the successful commercial<br />
development of existing oil and<br />
gas resources and exploration<br />
targeting high value oil and gas<br />
prospects. The development and<br />
use of innovative technology is a<br />
core component of this strategy.<br />
The USA Business Unit’s strategy<br />
is focused on the optimisation<br />
of existing exploration and<br />
production interests through active<br />
exploitation initiatives and<br />
divestiture of non-core assets,<br />
expansion of its exploration<br />
portfolio and the pursuit of<br />
opportunistic acquisitions.<br />
Production 5.1 mmboe<br />
Reserves 206 mmboe<br />
Production 0.5 mmboe<br />
Reserves 22 mmboe<br />
Production 1.5 mmboe*<br />
Reserves 10 mmboe<br />
* includes 0.5 mmboe attributed<br />
to <strong>Santos</strong> Europe Limited<br />
25
Business Units<br />
Operations<br />
South Australia Business Unit<br />
1998 Highlights<br />
<strong>Santos</strong> acreage<br />
Oil field<br />
Gas field<br />
Oil pipeline<br />
Gas pipeline<br />
Ethane pipeline<br />
1998 gas field<br />
discovery<br />
South Australia<br />
Welcome<br />
Lake East<br />
Moonanga<br />
Raven<br />
Moolion North<br />
Cardam<br />
Ficus<br />
Mica<br />
Shiraz<br />
Verona<br />
Moomba<br />
Scrubby Creek<br />
0 50<br />
kilometres<br />
Queensland<br />
■ Record total sales of natural gas<br />
and ethane.<br />
■ First delivery of Cooper Basin gas into<br />
Victoria through the new interconnection<br />
between New South Wales and Victoria.<br />
■ 20 gas discoveries (59% success rate)<br />
including several stratigraphic trap<br />
discoveries.<br />
■ 11 new gas field discoveries.<br />
■ Planning and technical studies<br />
commenced for the Nappamerri Trough.<br />
■ Record number of fracture stimulation<br />
projects and other development activity<br />
undertaken to optimise gas production.<br />
Cabernet<br />
Queensland and Northern Territory Business Unit<br />
1998 Highlights<br />
<strong>Santos</strong> acreage<br />
Oil field<br />
Gas field<br />
Oil pipeline<br />
Gas pipeline<br />
1998 gas field<br />
discovery<br />
Challum West<br />
Barrolka Complex<br />
Curri<br />
0 50<br />
kilometres<br />
Ballera<br />
South-west Queensland<br />
Hera<br />
Jackson<br />
■ First gas sales to MIM Holdings Ltd<br />
at Mt Isa.<br />
■ Completion of the Chookoo underground<br />
gas storage facility.<br />
■ Nine gas discoveries and one oil discovery<br />
(59% success rate).<br />
■ Three new gas field discoveries in<br />
South-west Queensland.<br />
■ Discovery of Yandina-2 gas field in the<br />
Denison Trough.<br />
■ Completion of Ballera Gas Plant Phase 3<br />
development. Phase 4 expansion<br />
commenced and was completed in<br />
early 1999.<br />
■ Significant development activity<br />
undertaken, including the connection of<br />
two major gas fields – Karmona and<br />
Challum.<br />
■ Acquisition of Gulf Australian<br />
Hydrocarbons Limited from Gulf Australia<br />
Resources Limited.<br />
■ Expansion of Mereenie Gas Plant nearing<br />
completion.<br />
26
Offshore Australia Business Unit<br />
1998 Highlights<br />
<strong>Santos</strong> acreage<br />
Gas pipeline<br />
Production<br />
Potential<br />
development<br />
project<br />
<strong>Santos</strong> acreage<br />
Oil field<br />
Gas field<br />
Prospect<br />
Oil pipeline<br />
Fold Belt<br />
0 500<br />
kilometres<br />
Browse Basin<br />
Timor Sea<br />
Timor Gap<br />
Jabiru<br />
Kakatua North<br />
Elang/Kakatua<br />
Bayu/Undan<br />
Challis Petrel<br />
Tern<br />
Bonaparte<br />
Gulf<br />
Carnarvon Basin<br />
Reindeer<br />
Caribou<br />
Legendre<br />
John Brookes Stag<br />
East Spar<br />
Western Australia<br />
South East Asia Business Unit<br />
1998 Highlights<br />
Kau 2<br />
Warim<br />
PSC<br />
USA Business Unit<br />
1998 Highlights<br />
<strong>Santos</strong> USA Corp<br />
interests<br />
OCS Sale 169<br />
Lease sale area<br />
Houston<br />
Irian Jaya<br />
Papua New Guinea<br />
Texas<br />
PPL 202<br />
Stanley<br />
200m W.D.<br />
P’nang<br />
PPL 213<br />
Elevala<br />
Gulf of Mexico<br />
PPL 157<br />
Louisiana<br />
Tumuli<br />
Subject to PNG Govt approvals<br />
Juhu<br />
Hides<br />
EI 335<br />
Kumul<br />
Offshore<br />
Facility<br />
Darwin<br />
0 100<br />
kilometres<br />
PDL 1<br />
Kutubu<br />
PPL 190<br />
PPL 191<br />
Bosavi PDL 3 Wasuma<br />
Irou<br />
SE Gobe W Anesi<br />
SE Kanau<br />
PPL 206<br />
Mississippi<br />
Barikewa<br />
PPL 189<br />
EW-994<br />
0 200<br />
kilometres<br />
■ The Stag (Carnarvon Basin) and<br />
Elang/Kakatua/Kakatua North (Timor Gap)<br />
oil fields brought onto production.<br />
■ Contract signed for the supply of East Spar<br />
gas to Wesfarmers CSBP Limited. Gas to<br />
be transported via a second Varanus Island<br />
pipeline.<br />
■ Two gas and two oil discoveries (31%<br />
success rate): Legendre South (oil),<br />
Mutineer (oil) and John Brookes (gas).<br />
Extension of the Reindeer gas field<br />
confirmed by the Caribou-1 well.<br />
■ Studies undertaken for the possible<br />
development of the Bayu-Undan (liquids),<br />
Petrel/Tern (gas), Legendre (oil), Reindeer<br />
(gas), John Brookes (gas) and Minerva<br />
(gas) fields.<br />
■ Commencement of oil production from<br />
SE Gobe (Papua New Guinea).<br />
■ Kau-2 appraisal well (Warim PSC) made a<br />
non-commercial oil discovery which<br />
demonstrated the potential of this region<br />
and resulted in several large prospects<br />
being upgraded.<br />
■ More cost effective methods for acquiring<br />
improved quality seismic data in the<br />
Papuan foldbelt developed. Acquired five<br />
surveys using these techniques over<br />
difficult terrain.<br />
■ Marine seismic survey conducted in the<br />
Sampang PSC.<br />
■ Agreement for divestment of interests in<br />
Seram PSC and Bula oil field. (Subsequent<br />
to 31 December 1998.)<br />
■ Seven gas and one oil discovery<br />
(62% success rate) including the Ewing<br />
Bank 994#1 oil discovery.<br />
■ Successful participation in the Gulf of<br />
Mexico lease sale No. 169 (acquired<br />
interests in six leases). Farmed-in to two<br />
other prospects (EW994 and HIA500).<br />
■ Development commenced on the Eugene<br />
Island 335 oil and gas field. Production<br />
commenced in early 1999.<br />
■ Entered into arrangements for the<br />
acquisition of additional onshore and<br />
offshore leases with two new local<br />
operators.<br />
■ Sold a number of non-core properties.<br />
■ Successful divestment of <strong>Santos</strong> Europe<br />
Limited.<br />
Business Units<br />
Operations<br />
27
10 Year Summary<br />
1989-1998<br />
As at 31 December 1989 1990 1991 1992 1993 1994 1995 1996 1997 1998<br />
Crude oil price (A$/bbl) 23.44 30.72 28.00 28.65 27.64 23.64 24.96 27.43 27.42 20.95<br />
Profit and Loss ($million)<br />
Sales revenue 560.6 709.5 655.9 689.8 680.2 640.0 671.6 729.2 778.5 769.4<br />
Total operating revenue 603.0 812.9 702.0 741.5 931.6 716.6 740.1 804.0 859.5 1000.8<br />
Foreign currency gains/(losses) 22.5 (1.3) (11.4) (36.8) (7.3) 66.3 (16.0) 25.0 3.6 2.0<br />
Operating profit before abnormal items 123.0 254.8 223.5 245.1 289.2 295.9 241.0 331.9 322.3 267.3<br />
Income tax on operating profit 52.6 112.0 106.8 104.9 104.8 116.2 101.1 136.0 116.1 91.0<br />
Operating profit after tax<br />
before abnormal items 70.4 142.8 116.7 140.2 184.4 179.7 139.9 195.9 206.2 176.3<br />
Abnormal items after tax 48.4 18.5 (224.9) (27.5) 34.9 10.7 (29.3) – – –<br />
Operating profit/(loss) after tax and<br />
abnormal items 118.8 161.3 (108.2) 112.7 219.3 190.4 110.6 195.9 206.2 176.3<br />
Outside equity interest in<br />
operating profit 1.7 5.3 2.7 – – – – – – –<br />
Profit/(loss) attributable to shareholders 117.1 156.0 (110.9) 112.7 219.3 190.4 110.6 195.9 206.2 176.3<br />
Balance Sheet ($million)<br />
Total assets 2,931.6 2,962.5 2,797.6 2,821.8 2,831.2 2,897.2 2,915.5 3,443.4 4,036.2 4236.1<br />
Net debt 1,116.1 772.4 755.0 797.4 711.2 619.9 642.0 938.6 1,114.2 1280.0<br />
Total shareholders' equity 1,123.8 1,380.2 1,215.1 1,231.7 1,380.6 1,532.2 1,519.3 1,586.3 1,919.0 1939.2<br />
Exploration<br />
Wells drilled (number) 133 119 80 41 66 63 66 91 112 81<br />
Expenditure ($million) 109.2 97.5 79.8 76.7 79.6 91.9 87.9 121.1 190.1 180.7<br />
Reserves (MMboe) 671 646 623 670 675 663 703 860 1,009 966<br />
Production (MMboe) 35.6 36.0 34.2 34.6 36.3 37.2 36.8 39.2 41.1 45.6<br />
Capital Expenditure ($million)<br />
Field developments 54.9 88.9 51.9 33.2 40.0 52.2 53.9 105.8 179.7 158.1<br />
Buildings, plant and equipment 59.7 60.9 69.1 75.6 80.6 30.5 40.1 150.3 205.4 165.7<br />
Share Information<br />
Share issues Executive 1 for 10 Dividend Dividend Dividend Dividend – – 1 for 8 Employee<br />
Share Plan rights/ Reinvestment Reinvestment Reinvestment Reinvestment rights Share<br />
Dividend Plan/ Plan Plan Plan/ issue/ Plan<br />
Reinvestment Executive Executive Employee<br />
Plan/ Share Plan Share Plan Share<br />
Executive<br />
Plan<br />
Share Plan<br />
Number of issued shares at year end (million) 404.3 450.4 473.0 498.6 517.9 539.6 539.6 539.6 607.3 607.8<br />
Weighted average number of shares (million)* 427.5 438.0 477.5 495.7 518.8 539.2 553.3 553.4 583.7 605.6<br />
Dividends per share<br />
– ordinary (¢) 19.0 19.0 19.0 21.0 22.0 22.0 23.0 24.0 25.0 25.0<br />
– special (¢) – – – – 5.0 – – – – –<br />
Dividends<br />
– ordinary ($million) 76.0 85.5 88.5 102.7 112.3 117.2 123.6 129.0 151.3 151.4<br />
– special ($million) – – – – 25.8 – – – – –<br />
Ratios and Statistics<br />
Earnings per share *<br />
– before abnormal items (¢) 16.1 31.4 23.9 28.3 35.5 33.3 25.3 35.4 35.3 29.1<br />
– after abnormal items (¢) 27.4 35.6 (23.2) 22.7 42.3 35.3 20.0 35.4 35.3 29.1<br />
Return on total operating revenue (%) 11.7 17.6 16.6 18.9 24.3 25.1 18.9 24.4 24.0 17.6<br />
Return on shareholders' equity (%) 6.6 10.6 9.7 11.4 13.4 11.7 9.2 12.3 10.7 9.1<br />
Net debt/equity (%) 99.3 56.0 62.1 64.7 51.5 40.5 42.3 59.2 58.1 66.0<br />
Net interest cover (times) 1.9 3.2 4.1 5.9 7.0 8.3 5.8 6.2 5.4 4.4<br />
General<br />
Number of employees 1,655 1,683 1,570 1,468 1,526 1,492 1,471 1,461 1,615 1,650<br />
Number of shareholders 26,499 26,251 29,706 35,492 42,068 50,595 55,684 55,482 65,459 81,286<br />
Market capitalisation ($million) 1,639.3 1,779.8 1,399.2 1,288.5 1,988.1 1,868.2 2,111.2 2,741.1 3,826.1 2653.9<br />
* adjusted for bonus element of rights issues.<br />
Prior year amounts have, where applicable, been adjusted to place them on a comparable basis with current year amounts.<br />
28
Production Statistics<br />
Field Units<br />
Sales Gas & Ethane Crude Oil Condensate LPG<br />
PJ ‘000 bbls ‘000 bbls ‘000 tonnes<br />
1998 1997 1998 1997 1998 1997 1998 1997<br />
South Australia<br />
Cooper/Eromanga 107.9 105.0 2422.9 2505.8 1664.1 1374.3 217.5 196.9<br />
Queensland & Northern Territory<br />
SW Queensland 37.5 27.7 1886.6 2317.6 771.9 603.4 63.8 57.5<br />
Surat/Denison 11.2 11.6 170.4 191.8 46.6 69.0 4.4 9.2<br />
Amadeus 10.6 10.8 496.4 569.7 - - - -<br />
Total 59.3 50.1 2553.4 3079.1 818.5 672.4 68.2 66.7<br />
Offshore Australia<br />
Timor Sea - - 432.7 648.5 - - - -<br />
Timor Gap - - 968.6 - - - - -<br />
Carnarvon 9.7 6.7 1469.7 170.7 575.7 423.8 - -<br />
Total 9.7 6.7 2871.0 819.2 575.7 423.8 - -<br />
South East Asia<br />
Seram - - 261.2 272.3 - - - -<br />
PNG - - 248.1 - - - - -<br />
Total - - 509.3 272.3 - - - -<br />
US 4.8 5.9 141.1 187.1 59.0 62.0 - -<br />
UK 3.2 4.5 - 37.6 3.7 5.1 - -<br />
Total 184.9 172.2 8497.7 6901.1 3121.0 2537.6 285.7 263.6<br />
10 Year Summary/Production Statistics<br />
Million Barrels of Oil Equivalent<br />
Sales Gas & Ethane Crude Oil Condensate LPG Total<br />
1998 1997 1998 1997 1998 1997 1998 1997 1998 1997<br />
South Australia<br />
Cooper/Eromanga 18.55 18.05 2.42 2.51 1.56 1.28 1.84 1.67 24.37 23.51<br />
Queensland & Northern Territory<br />
SW Queensland 6.45 4.76 1.89 2.32 0.72 0.56 0.54 0.49 9.60 8.13<br />
Surat/Denison 1.93 1.99 0.17 0.19 0.04 0.07 0.04 0.08 2.18 2.33<br />
Amadeus 1.82 1.86 0.50 0.57 - - - - 2.32 2.43<br />
Total 10.20 8.61 2.56 3.08 0.76 0.63 0.58 0.57 14.10 12.89<br />
Offshore Australia<br />
Timor Sea - - 0.43 0.65 - - - - 0.43 0.65<br />
Timor Gap - - 0.97 - - - - - 0.97 -<br />
Carnarvon 1.67 1.15 1.47 0.17 0.54 0.40 - - 3.68 1.72<br />
Total 1.67 1.15 2.87 0.82 0.54 0.40 - - 5.08 2.37<br />
South East Asia<br />
Seram - - 0.26 0.27 - - - - 0.26 0.27<br />
PNG - - 0.25 - - - - - 0.25 -<br />
Total - - 0.51 0.27 - - - - 0.51 0.27<br />
US 0.82 1.01 0.14 0.19 0.06 0.06 - - 1.02 1.26<br />
UK 0.55 0.77 - 0.04 0.00 0.00 - - 0.55 0.81<br />
Total 31.79 29.59 8.50 6.91 2.92 2.37 2.42 2.24 45.63 41.11<br />
29
<strong>Santos</strong> Group Interests as at 5 March 1999<br />
Licence Area % Interest Licence Area % Interest<br />
South Australia<br />
Cooper Basin Production Area<br />
(PPLs 6-20, 22-25, 27-61, 63-75, 78-117,<br />
119, 120, 124, 126-128, 132-134) 59.7500<br />
Patchawarra East (PPLs 26, 76, 77,<br />
118, 121-123 & 125) 69.3522<br />
SA Unit and Downstream 59.7500<br />
Queensland<br />
South-West Queensland<br />
ATP 259P<br />
Naccowlah (PLs 23-26, 35, 36, 62,<br />
76-79, 82, 87, 105, 107 & 109) 55.5000<br />
Total 66 (PLs 34, 37, 63, 68, 75, 84, 88 & 110) 70.0000<br />
Wareena 61.2000<br />
Innamincka (PLs 58 & 80) 70.0000<br />
Aquitaine A (PL 86) 52.5000<br />
Aquitaine B (PLs 59-61, 81, 83, 85,<br />
106, 108, 111, 113 & 114) 55.0000<br />
Alkina 72.0000<br />
Aquitaine C 47.8000<br />
50/40/10 (PL 55) 60.0000<br />
SWQ Unit 60.0625<br />
ATP 267P (Nockatunga) (PLs 33, 50 & 51) 59.0640<br />
ATP 269P (Bodalla) 5.8060<br />
PLs 31, 32 and 47 (Bodalla) 5.2500<br />
ATP 577P 7.0000<br />
ATP 299P (Tintaburra) (PLs 29, 38,<br />
39, 52 and 57) 89.0000<br />
Southern Surat<br />
PL 1 (Moonie) 100.0000<br />
PL 1 (2) (C) (Cabawin) 100.0000<br />
PL 1 (2) (Cabawin Farm-out) 50.0000<br />
PL 2C (Alton) 100.0000<br />
PL 2 (Kooroon) 52.5000<br />
PL 2C (Alton Farm-out) 63.5000<br />
ATP 512P 66.6700<br />
ATP 244P (Block D) 20.0000<br />
PL 17 70.0000<br />
PL 17 (Bennett Exclusion) 100.0000<br />
PL 17 (Leichardt Exclusion) 70.0000<br />
ATP 552P-GN 35.5264<br />
ATP 552P-RM 21.9697<br />
Roma Area<br />
ATP 336P (Roma) (PLs 3-13 & 93) 85.0000<br />
PL 5 (Mascotte) 42.5000<br />
PL 5 (Drillsearch) 21.2500<br />
PL 5 (Barcoo) 85.0000<br />
ATP 336P (Waldegrave) (PLs 10-12, 28,<br />
69 & 89) 46.2500<br />
PL 11 (Snake Creek East) 25.0000<br />
ATP 336P (Kalima) 76.5000<br />
PL 12 (Trinidad) 92.5000<br />
ATP 378P (Burunga) 100.0000<br />
Bowen Basin<br />
ATP 337P (Denison Trough) 50.0000<br />
ATP 553P (Denison Trough) 50.0000<br />
PLs 41-45, 54 and 67 (Denison Trough) 50.0000<br />
Surat Basin<br />
PLs 21, 22, 27 and 64 (Balonne) 12.5000<br />
ATP 470P (Redcap) (PL 71) 10.0000<br />
ATP 212P (Major) (PLs 30, 56 & 74) 15.0000<br />
ATP 471P (Weribone) 5.9100<br />
ATP 471P (Wunger) (PL 15) 66.6700<br />
ATP 471P (Noona) (PLs 16, 48 & 66) 50.0000<br />
ATP-471P (Rocky Creek East – Expl) 41.6700<br />
ATP 471P (Myall) 69.4500<br />
ATP 471P (Onerry) 72.5000<br />
ATP 471P (Dalkeith) 66.6700<br />
ATP 471P (Bainbilla) (PL 119) 16.6700<br />
PL 49 (Rocky Creek East Production) 50.0000<br />
Facilities<br />
Wungoona Processing Facilities 50.0000<br />
Moonie to Brisbane Pipeline 100.0000<br />
Jackson Moonie Pipeline 82.7500<br />
Ballera to Mt Isa Pipeline 18.0188<br />
Victoria<br />
PEP 108 100.0000<br />
PEP 132 100.0000<br />
PEP 119 60.0000<br />
VIC/RL1 33.3334<br />
VIC/RL2 7.5000*<br />
VIC/RL3 25.0000<br />
VIC/RL7 10.0000<br />
VIC/RL8 10.0000<br />
* approximate figure<br />
30<br />
Tasmania<br />
T/RL1 (Yolla) 5.0000<br />
Northern Territory<br />
OL 3 (Palm Valley) 47.9770<br />
OLs 4 and 5 (Mereenie) 65.0000<br />
RL2 (Dingo) 65.6635<br />
Mereenie-Brewer Estate Pipeline 65.0000
Licence Area % Interest Licence Area % Interest<br />
Offshore Northern Australia<br />
EP 325 25.0000<br />
EP 398 55.0000<br />
TL/2 15.0000<br />
TP/7 (1-3) 43.7110<br />
TP/7 (4) 18.7110<br />
TP/12 55.0000<br />
WA-149-P 18.7110<br />
WA-206-P 100.0000<br />
WA-13-L 45.0000<br />
WA-208-P 20.0000<br />
WA-214-P 20.0000<br />
WA-215-P 10.0000<br />
WA-239-P 20.0000<br />
WA-242-P 20.0000<br />
WA-281-P 27.5000<br />
WA-282-P 42.5000<br />
WA-283-P 27.5000<br />
AC/RL2 (Oliver) 38.0000<br />
AC/P15 33.3334<br />
AC/L1 (Jabiru) 10.3125<br />
AC/L2 (Challis) 10.3125<br />
AC/L3 (Cassini) 10.3125<br />
AC/L4 30.5887<br />
WA-261-P 29.5833<br />
WA-264-P 66.6667<br />
WA-258-P 45.4545<br />
NT/RL1 (Petrel) 50.4900<br />
NT/P52 37.5000<br />
WA-1-P 22.5600<br />
WA-8-L (Talisman) 27.3684<br />
WA-15-L (Stag) 54.1666<br />
WA-18-P (Tern) 70.0000<br />
WA-191-P 33.3977<br />
WA-209-P 36.0000<br />
WA-6-R (West Petrel) 50.4900<br />
ZOCA 91-01 20.0000<br />
ZOCA 91-12 (Elang) 21.4260<br />
Bayu-Undan Gas Field 11.8276<br />
<strong>Santos</strong> Group Interests<br />
United States of America<br />
Average<br />
working<br />
Gulf of Mexico<br />
interest<br />
- EB 994 (Boomslang) 20.0000<br />
- EC 155 20.0000<br />
- EI 59 20.0000<br />
- EI 143 20.0000<br />
- EI 335 20.0000<br />
- HI A500 20.0000<br />
- MB 997 20.0000<br />
- MB 998 20.0000<br />
- MB 999 20.0000<br />
- MC 357 (Deep) 12.5000<br />
- MC 357 (Shallow) 13.0000<br />
- MC 358 13.0000<br />
- MP 273 20.0000<br />
- SS 319 20.0000<br />
- SS 320 20.0000<br />
- VR 247 20.0000<br />
- WC 272 20.0000<br />
Average<br />
working<br />
interest<br />
- WC 276 20.0000<br />
- WC 520 25.0000<br />
- WC 574 25.0000<br />
- WC 575 25.0000<br />
- WC 582 20.0000<br />
- WC 632 20.0000<br />
- WD 119 14.8148<br />
- WD 152 13.0000<br />
South Texas<br />
- Remmers 45.0000<br />
- Birdie Porter Green 50.0000<br />
- Fuhrken 25.0000<br />
- Thomson-Barrow/O’Brien Ranch 18.0000<br />
- Queen City 50.0000<br />
- West Rosita 25.0000<br />
Arkoma Basin 26.4000<br />
New Zealand<br />
PEP 38712 30.0000<br />
Papua New Guinea<br />
PPL 157 35.2500<br />
PPL 189 40.4040<br />
PPL 190 30.1010<br />
PPL 191 71.7750<br />
PPL 202 55.0000<br />
PPL 206 46.0000<br />
PPL 213 35.0000<br />
PDL 3 15.5000<br />
SE Gobe Field Unit 6.9750<br />
PL 3 3.4875<br />
Indonesia<br />
Seram 2.5000<br />
Bula 100.0000<br />
Korinci-Baru 61.1111<br />
Warim 20.0000<br />
Bangko 15.0000<br />
Bentu 61.1111<br />
Sampang 45.0000<br />
31
Glossary<br />
appraisal well<br />
An exploration well drilled for the purpose of identifying extensions to known fields or discoveries.<br />
barrel/bbl The standard unit of measurement for all production and sales. One barrel equals 159 litres or 35<br />
imperial gallons.<br />
boe<br />
bopd<br />
the Company<br />
D,D&A<br />
development well<br />
exploration well<br />
farm-out (farm-in)<br />
fracture stimulation<br />
hydrocarbons<br />
LPG<br />
Mbbls<br />
MIM<br />
MMbbls<br />
MMboe<br />
monobore well<br />
petroleum liquids<br />
PJ<br />
PSC<br />
reserves<br />
reservoir<br />
<strong>Santos</strong><br />
seismic survey<br />
Barrels of oil equivalent. The factors used by <strong>Santos</strong> to convert volume of different hydrocarbon<br />
production to barrels of oil equivalent are printed below.<br />
Barrels of oil per day.<br />
<strong>Santos</strong> Ltd and its subsidiaries.<br />
Depreciation, depletion and amortisation of building, plant and equipment, exploration and<br />
development expenditure.<br />
A well drilled to enable production from a known oil or gas reservoir.<br />
A wildcat or appraisal well drilled to find new reserves of oil or gas.<br />
An agreement which provides for a party to acquire an interest in a permit by either fully or<br />
partially funding an agreed program of work to be conducted in the permit.<br />
A technique used to improve hydrocarbon recovery from reserves with poor permeability or<br />
porosity. Fracture stimulation involves the fracturing of the reservoir rock to encourage the flow<br />
of hydrocarbons.<br />
Solid, liquid or gas compounds of the elements hydrogen and carbon.<br />
Liquefied petroleum gas.<br />
Thousand barrels.<br />
MIM Holdings Ltd (formerly Mt Isa Mines).<br />
Million barrels.<br />
Million barrels of oil equivalent.<br />
A well which has a single casing and no internal tubing.<br />
Crude oil, condensate, or its derivative naphtha, and the liquefied petroleum gases propane<br />
and butane.<br />
Petajoules. Joules are the metric measurement unit for energy. A petajoule is equal to<br />
1 kilojoulex 10 12 . The equivalent imperial measure to joules is British Thermal Units (BTU).<br />
One kilojoule = .9478 BTU.<br />
Production sharing contract.<br />
Proved and probable reserves as defined by the Australian Stock Exchange Ltd (ASX). Proved<br />
reserves are those reserves that, to a high degree of certainty, are recoverable, at commercial<br />
rates, under presently anticipated production methods, operating conditions, prices and costs.<br />
Probable reserves are those reserves that may be reasonably assumed to exist because of<br />
geophysical or geological indications and drilling done in regions which contain proven reserves.<br />
Reserves reported are based on, and accurately reflect, information compiled by full-time<br />
employees of the company who have the requisite qualifications and experience prescribed by<br />
the ASX Listing Rules.<br />
A rock formation in which hydrocarbons are present.<br />
<strong>Santos</strong> Ltd and its subsidiaries.<br />
A survey used to gain an understanding of rock formations beneath the earth’s surface.<br />
TJ Terajoules. Joules are the metric measurement unit for energy. A terajoule is equal to 1 joule x 10 12 .<br />
wildcat well<br />
An exploration well drilled to identify new accumulations of oil or gas.<br />
32<br />
WMC<br />
WMC (formerly Western Mining Corporation).<br />
boe conversion factors Crude Oil 1 barrel = 1 boe Sales Gas 1 petajoule = 171.937 boe x 10 3<br />
Condensate/Naphtha 1 barrel = 0.935 boe LPG 1 tonne = 8.458 boe
Corporate Governance<br />
The purpose of this statement is to provide<br />
details of the main corporate governance<br />
practices the Company had in place during<br />
the past financial year.<br />
The Board of <strong>Santos</strong> Limited is committed to good<br />
corporate governance and to this end has had in<br />
place for a number of years formal guidelines<br />
recording the Board’s policy on: Board composition<br />
and appointment of chairman; Board membership<br />
and attendance; the appointment and retirement of<br />
Directors; independent professional advice;<br />
compensation arrangements; external auditors; risk<br />
management; and ethical standards. References in<br />
this statement to the “Board guidelines” are to the<br />
formal guidelines in force during the past financial<br />
year. The Board guidelines are reviewed by the<br />
Board on an annual basis and as required.<br />
Board of Directors and its Committees<br />
The Board is responsible for the overall corporate<br />
governance of the Company including its strategic<br />
direction and financial objectives, establishing goals<br />
for management and monitoring the attainment of<br />
these goals.<br />
To assist in the effective execution of its<br />
responsibilities, the Board has established a number<br />
of Board Committees including a Nomination and<br />
Remuneration Committee, an Audit Committee and an<br />
Environmental Committee. The Nomination and<br />
Remuneration Committee comprises all non-executive<br />
Directors and each of the Audit and Environmental<br />
Committees comprises a majority of non-executive<br />
Directors and is chaired by a non-executive Director.<br />
The Board guidelines prescribe that the Board is to<br />
meet at least 10 times a year.<br />
All current non-executive Directors, including the<br />
Chairman, are considered to be ‘independent’<br />
Directors, as defined in the 1997 guidelines of the<br />
then Australian Investment Managers Association.<br />
Composition of the Board<br />
The names and details of the experience,<br />
qualifications, age, special responsibilities and<br />
shareholdings of each Director of the Company are<br />
set out on pages 22 and 23 of this Annual Report.<br />
The composition of the Board is determined in<br />
accordance with the Company’s Constitution and the<br />
Board guidelines including: the Board is to comprise<br />
a minimum of five and a maximum of ten Directors<br />
(exclusive of the Managing Director); the Board<br />
should comprise a substantial majority of<br />
non-executive Directors (currently the Board<br />
comprises six non-executive and two executive<br />
Directors); there should be a separation of the roles<br />
of Chairman and Chief Executive Officer of the<br />
Company; and the Chairman of the Board should be<br />
a non-executive Director.<br />
Under the Board guidelines, it is the responsibility of<br />
the Nomination and Remuneration Committee to<br />
devise the criteria for, and review membership of,<br />
and nominations to, the Board. The primary criteria<br />
adopted in selection of suitable Board candidates is<br />
their capacity to contribute to the ongoing<br />
development of the Company having regard to the<br />
location and nature of the Company’s significant<br />
business interests and to the candidates’ age and<br />
experience by reference to the age and diversity of<br />
experience of existing Board members.<br />
When a Board vacancy exists or where it is<br />
considered that the Board would benefit from the<br />
services of a new Director with particular skills, the<br />
Nomination and Remuneration Committee has<br />
responsibility for proposing candidates for<br />
consideration by the Board and, where appropriate,<br />
engages the services of external consultants.<br />
Prior to appointment, each Director is provided with<br />
a letter of appointment which, inter alia, encloses a<br />
copy of the Board guidelines governing board<br />
operation, membership and corporate governance,<br />
including detailed regulations relating to disclosure<br />
of interests and guidelines for dealing in securities,<br />
together with the requisite form for completion in<br />
compliance with those regulations. The expectations<br />
of the Board in respect to a proposed appointee to<br />
the Board and the workings of the Board and its<br />
committees are conveyed in interviews with the<br />
Chairman and access provided to appropriate<br />
executives in relation to details of the business of<br />
the Company.<br />
Corporate Governance <strong>Santos</strong> Ltd and Controlled Entities<br />
33
Corporate Governance continued<br />
34<br />
Under the Company’s Constitution approximately<br />
one-third of Directors retire by rotation each year<br />
and Directors appointed during the year are required<br />
to submit themselves for election by shareholders at<br />
the Company’s next Annual General Meeting.<br />
The Board guidelines prescribe that, under normal<br />
circumstances, Directors should retire at the first<br />
Annual General Meeting after reaching the age of<br />
72 years and not seek re-appointment.<br />
Independent Professional Advice<br />
The Board guidelines set out the circumstances and<br />
procedures pursuant to which a Director, in<br />
furtherance of his or her duties, may seek<br />
independent professional advice at the Company’s<br />
expense. Those procedures require prior<br />
consultation with, and approval by, the Chairman<br />
and assurances as to the qualifications and<br />
reasonableness of the fees of the relevant expert<br />
and, under normal circumstances, the provision of<br />
the expert’s advice to the Board.<br />
Remuneration<br />
Under the Board guidelines, the Nomination and<br />
Remuneration Committee is responsible for<br />
reviewing the remuneration policies and practices of<br />
the Company including: the compensation<br />
arrangements for executive Directors and senior<br />
management; the Company’s superannuation<br />
arrangements; employee share and option plans;<br />
and, within the aggregate amount approved by<br />
shareholders, the fees for non-executive members<br />
of the Board. Further information on these matters<br />
is included at pages 40 and 41 of this Annual Report<br />
and details of the Company’s employee share and<br />
option plans are provided in Note 18 of the Financial<br />
Report. No non-executive Director may participate in<br />
any of the Company’s share or option plans.<br />
Information in respect to indemnity and insurance<br />
arrangements for Directors and senior executives<br />
appears at page 41 of this Annual Report.<br />
The current members of the Nomination and<br />
Remuneration Committee, all of whom are<br />
non-executive Directors, are: Mr J A Uhrig (Chairman),<br />
Mr P C Barnett, Mr S Gerlach, Mr M A O’Leary,<br />
Professor J Sloan and Mr I E Webber.<br />
Audit Committee<br />
The Board guidelines require the Board to continue<br />
in existence an Audit Committee of the Board.<br />
The role of the Audit Committee is documented in a<br />
Charter, approved by the Board. In accordance with<br />
this Charter, the Committee comprises three<br />
non-executive Directors plus the Managing Director<br />
and is chaired by a non-executive Director. The<br />
internal and external auditors, and relevant senior<br />
management, attend Audit Committee meetings at<br />
the invitation of the Committee.<br />
The current members of the Audit Committee are:<br />
Mr S Gerlach (Chairman), Mr P C Barnett,<br />
Mr I E Webber and Mr N R Adler.<br />
The Committee is required to meet at least three<br />
times per year: at the planning stage of the audit, at<br />
which time the planned scope of the audit and the<br />
auditors recommendations on controls are<br />
considered, and before the issue of the half-yearly<br />
and annual financial statements and the Board<br />
meetings approving the same, at which time any<br />
significant matters arising during the audit are<br />
considered. The Committee also meets, as<br />
determined by the Chairman of the Committee and<br />
members may raise any matters considered<br />
desirable.<br />
The role of the Audit Committee includes:<br />
examining the accounting policies of the Company<br />
to determine whether they are appropriate and in<br />
accordance with all applicable reporting<br />
requirements; ensuring that truth and fairness is<br />
reflected in the preparation and publication of the<br />
Company’s financial reports; meeting regularly with<br />
the auditors to reinforce the independence of the<br />
auditors, to determine the appropriateness of<br />
internal and external audit procedures, to review the<br />
performance of the auditors and to provide the<br />
auditors with confidential access to the Board; and<br />
referring matters of concern to the Board, as<br />
appropriate, and considering risk management<br />
matters.<br />
Minutes and recommendations of the Audit<br />
Committee are distributed at the next Board Meeting.
Risk Management<br />
The Board has in place a number of arrangements<br />
and internal controls intended to identify and<br />
manage areas of significant business risk. These<br />
include the maintenance of: Board Committees<br />
(including Audit and Environmental Committees of<br />
the Board); detailed and regular budgetary, financial<br />
and management reporting; established<br />
organisational structures, procedures, manuals and<br />
policies; audits (including internal and external<br />
financial, environmental and safety audits);<br />
comprehensive insurance programmes; and the<br />
retention of specialised staff and external advisers.<br />
■ Management of environmental risk -<br />
environmental risk is managed through:<br />
comprehensive environmental management<br />
systems; environmental committees at Board<br />
and management levels; the retention of<br />
specialist environmental staff and advisers;<br />
regular internal and external environmental<br />
audits; and imposing environmental care as a<br />
line management responsibility. Further<br />
information on these matters appears at pages<br />
21 and 39 of this Annual Report. Membership of<br />
the Environmental Committee of the Board<br />
comprises three non-executive Directors and the<br />
Managing Director. The current members of the<br />
Committee are: Mr J A Uhrig (Chairman), Mr S<br />
Gerlach, Mr M A O’Leary and Mr N R Adler.<br />
■ Management of exploration risk - exploration<br />
risk is managed through internal control systems<br />
which include: formalised risk assessment<br />
procedures at the business unit level; Corporate<br />
review in both prospect and hindsight; Board<br />
approval of exploration budgets; and regular<br />
reporting on progress to the Board. External<br />
reviews are also undertaken as necessary.<br />
■ Management of Year 2000 issue - the Year 2000<br />
issue has been managed through: the<br />
establishment in 1997 of a Year 2000 Project<br />
Team to co-ordinate Company-wide Year 2000<br />
activities; engagement since 1997 of external<br />
experts to assist and advise the Year 2000 Project<br />
Team; preparation by the Year 2000 Project Team<br />
of an Integrated Project Plan adopted by all<br />
business units; review of the Year 2000 Project<br />
Team’s progress by an Executive Committee of<br />
senior management; quality assurance<br />
assessment by independent consultants; and<br />
regular reporting to the Board. Further<br />
information on the Company’s response to the<br />
Year 2000 issue appears at page 13 of this<br />
Annual Report and in the releases to the<br />
Australian Stock Exchange Ltd made in June<br />
1998 and March 1999.<br />
■ Investment appraisal - the Company has clearly<br />
defined procedures for capital expenditure.<br />
These include annual budgets, detailed appraisal<br />
and review procedures, levels of authority and<br />
due diligence requirements where assets are<br />
being acquired.<br />
■ Financial reporting - a comprehensive budgeting<br />
system exists with a five year financial plan and<br />
an annual budget approved by the Board.<br />
Monthly actual results are reported against<br />
budget and, where applicable, revised forecasts<br />
for the year are prepared and reported to the<br />
Board. Speculative transactions are prohibited.<br />
Further details relating to financial instruments<br />
and commodity price risk management are<br />
included in Note 33 of the Financial Report.<br />
■ Functional speciality and business unit reporting<br />
- all significant areas of Company operations are<br />
subject to regular reporting to the Board. The<br />
Board receives regular reports on the<br />
performance of each business unit and on<br />
exploration, development, finance, liquids<br />
marketing, safety, government, investor relations<br />
and environmental matters.<br />
Senior management attend Board and Committee<br />
meetings, at which they report to Directors within<br />
their respective areas of responsibility. This assists<br />
the Board in maintaining its understanding of the<br />
Company’s business and assessing the senior<br />
management team. Where appropriate, advisers to<br />
the Company attend meetings of the Board and of<br />
its Committees.<br />
Under the Company’s Delegation of Authority, the<br />
Board is responsible, inter alia, for the approval of<br />
the annual corporate budget and for significant:<br />
acquisitions and disposals of assets; expenditure<br />
Corporate Governance<br />
<strong>Santos</strong> Ltd and Controlled Entities<br />
35
Corporate Governance continued<br />
decisions outside of the corporate budget; hedging<br />
of product sales; sales contracts; and financing<br />
arrangements.<br />
The Audit Committee is responsible for approving<br />
the programme of internal audit to be conducted<br />
each financial year in ensuring compliance with<br />
these internal controls.<br />
Ethical Standards<br />
In pursuance of the promotion of high standards of<br />
corporate governance, the Board has, without<br />
adopting a formal code of ethics, established and<br />
maintained various internal standards which<br />
extend beyond requirements prescribed by law<br />
and include additional disclosure of interests by<br />
Directors and guidelines relating to the dealing in<br />
securities by Directors and managers.<br />
36