Seasonal Diagnostic and Predictability of Rainfall in Subtropical ...
Seasonal Diagnostic and Predictability of Rainfall in Subtropical ...
Seasonal Diagnostic and Predictability of Rainfall in Subtropical ...

You also want an ePaper? Increase the reach of your titles
YUMPU automatically turns print PDFs into web optimized ePapers that Google loves.
15 FEBRUARY 2000 MONTECINOS ET AL.<br />
749<br />
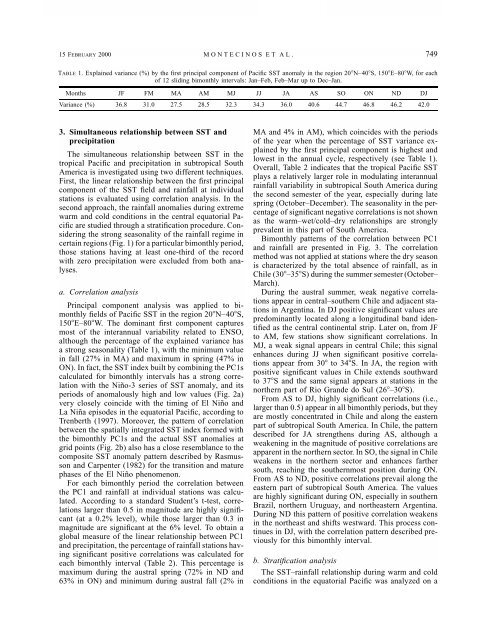
TABLE 1. Expla<strong>in</strong>ed variance (%) by the first pr<strong>in</strong>cipal component <strong>of</strong> Pacific SST anomaly <strong>in</strong> the region 20N–40S, 150E–80W, for each<br />
<strong>of</strong> 12 slid<strong>in</strong>g bimonthly <strong>in</strong>tervals: Jan–Feb, Feb–Mar up to Dec–Jan.<br />
Months JF FM MA AM MJ JJ JA AS SO ON ND DJ<br />
Variance (%) 36.8 31.0 27.5 28.5 32.3 34.3 36.0 40.6 44.7 46.8 46.2 42.0<br />
3. Simultaneous relationship between SST <strong>and</strong><br />
precipitation<br />
The simultaneous relationship between SST <strong>in</strong> the<br />
tropical Pacific <strong>and</strong> precipitation <strong>in</strong> subtropical South<br />
America is <strong>in</strong>vestigated us<strong>in</strong>g two different techniques.<br />
First, the l<strong>in</strong>ear relationship between the first pr<strong>in</strong>cipal<br />
component <strong>of</strong> the SST field <strong>and</strong> ra<strong>in</strong>fall at <strong>in</strong>dividual<br />
stations is evaluated us<strong>in</strong>g correlation analysis. In the<br />
second approach, the ra<strong>in</strong>fall anomalies dur<strong>in</strong>g extreme<br />
warm <strong>and</strong> cold conditions <strong>in</strong> the central equatorial Pacific<br />
are studied through a stratification procedure. Consider<strong>in</strong>g<br />
the strong seasonality <strong>of</strong> the ra<strong>in</strong>fall regime <strong>in</strong><br />
certa<strong>in</strong> regions (Fig. 1) for a particular bimonthly period,<br />
those stations hav<strong>in</strong>g at least one-third <strong>of</strong> the record<br />
with zero precipitation were excluded from both analyses.<br />
a. Correlation analysis<br />
Pr<strong>in</strong>cipal component analysis was applied to bimonthly<br />
fields <strong>of</strong> Pacific SST <strong>in</strong> the region 20N–40S,<br />
150E–80W. The dom<strong>in</strong>ant first component captures<br />
most <strong>of</strong> the <strong>in</strong>terannual variability related to ENSO,<br />
although the percentage <strong>of</strong> the expla<strong>in</strong>ed variance has<br />
a strong seasonality (Table 1), with the m<strong>in</strong>imum value<br />
<strong>in</strong> fall (27% <strong>in</strong> MA) <strong>and</strong> maximum <strong>in</strong> spr<strong>in</strong>g (47% <strong>in</strong><br />
ON). In fact, the SST <strong>in</strong>dex built by comb<strong>in</strong><strong>in</strong>g the PC1s<br />
calculated for bimonthly <strong>in</strong>tervals has a strong correlation<br />
with the Niño-3 series <strong>of</strong> SST anomaly, <strong>and</strong> its<br />
periods <strong>of</strong> anomalously high <strong>and</strong> low values (Fig. 2a)<br />
very closely co<strong>in</strong>cide with the tim<strong>in</strong>g <strong>of</strong> El Niño <strong>and</strong><br />
La Niña episodes <strong>in</strong> the equatorial Pacific, accord<strong>in</strong>g to<br />
Trenberth (1997). Moreover, the pattern <strong>of</strong> correlation<br />
between the spatially <strong>in</strong>tegrated SST <strong>in</strong>dex formed with<br />
the bimonthly PC1s <strong>and</strong> the actual SST anomalies at<br />
grid po<strong>in</strong>ts (Fig. 2b) also has a close resemblance to the<br />
composite SST anomaly pattern described by Rasmusson<br />
<strong>and</strong> Carpenter (1982) for the transition <strong>and</strong> mature<br />
phases <strong>of</strong> the El Niño phenomenon.<br />
For each bimonthly period the correlation between<br />
the PC1 <strong>and</strong> ra<strong>in</strong>fall at <strong>in</strong>dividual stations was calculated.<br />
Accord<strong>in</strong>g to a st<strong>and</strong>ard Student’s t-test, correlations<br />
larger than 0.5 <strong>in</strong> magnitude are highly significant<br />
(at a 0.2% level), while those larger than 0.3 <strong>in</strong><br />
magnitude are significant at the 6% level. To obta<strong>in</strong> a<br />
global measure <strong>of</strong> the l<strong>in</strong>ear relationship between PC1<br />
<strong>and</strong> precipitation, the percentage <strong>of</strong> ra<strong>in</strong>fall stations hav<strong>in</strong>g<br />
significant positive correlations was calculated for<br />
each bimonthly <strong>in</strong>terval (Table 2). This percentage is<br />
maximum dur<strong>in</strong>g the austral spr<strong>in</strong>g (72% <strong>in</strong> ND <strong>and</strong><br />
63% <strong>in</strong> ON) <strong>and</strong> m<strong>in</strong>imum dur<strong>in</strong>g austral fall (2% <strong>in</strong><br />
MA <strong>and</strong> 4% <strong>in</strong> AM), which co<strong>in</strong>cides with the periods<br />
<strong>of</strong> the year when the percentage <strong>of</strong> SST variance expla<strong>in</strong>ed<br />
by the first pr<strong>in</strong>cipal component is highest <strong>and</strong><br />
lowest <strong>in</strong> the annual cycle, respectively (see Table 1).<br />
Overall, Table 2 <strong>in</strong>dicates that the tropical Pacific SST<br />
plays a relatively larger role <strong>in</strong> modulat<strong>in</strong>g <strong>in</strong>terannual<br />
ra<strong>in</strong>fall variability <strong>in</strong> subtropical South America dur<strong>in</strong>g<br />
the second semester <strong>of</strong> the year, especially dur<strong>in</strong>g late<br />
spr<strong>in</strong>g (October–December). The seasonality <strong>in</strong> the percentage<br />
<strong>of</strong> significant negative correlations is not shown<br />
as the warm–wet/cold–dry relationships are strongly<br />
prevalent <strong>in</strong> this part <strong>of</strong> South America.<br />
Bimonthly patterns <strong>of</strong> the correlation between PC1<br />
<strong>and</strong> ra<strong>in</strong>fall are presented <strong>in</strong> Fig. 3. The correlation<br />
method was not applied at stations where the dry season<br />
is characterized by the total absence <strong>of</strong> ra<strong>in</strong>fall, as <strong>in</strong><br />
Chile (30–35S) dur<strong>in</strong>g the summer semester (October–<br />
March).<br />
Dur<strong>in</strong>g the austral summer, weak negative correlations<br />
appear <strong>in</strong> central–southern Chile <strong>and</strong> adjacent stations<br />
<strong>in</strong> Argent<strong>in</strong>a. In DJ positive significant values are<br />
predom<strong>in</strong>antly located along a longitud<strong>in</strong>al b<strong>and</strong> identified<br />
as the central cont<strong>in</strong>ental strip. Later on, from JF<br />
to AM, few stations show significant correlations. In<br />
MJ, a weak signal appears <strong>in</strong> central Chile; this signal<br />
enhances dur<strong>in</strong>g JJ when significant positive correlations<br />
appear from 30 to 34S. In JA, the region with<br />
positive significant values <strong>in</strong> Chile extends southward<br />
to 37S <strong>and</strong> the same signal appears at stations <strong>in</strong> the<br />
northern part <strong>of</strong> Rio Gr<strong>and</strong>e do Sul (26–30S).<br />
From AS to DJ, highly significant correlations (i.e.,<br />
larger than 0.5) appear <strong>in</strong> all bimonthly periods, but they<br />
are mostly concentrated <strong>in</strong> Chile <strong>and</strong> along the eastern<br />
part <strong>of</strong> subtropical South America. In Chile, the pattern<br />
described for JA strengthens dur<strong>in</strong>g AS, although a<br />
weaken<strong>in</strong>g <strong>in</strong> the magnitude <strong>of</strong> positive correlations are<br />
apparent <strong>in</strong> the northern sector. In SO, the signal <strong>in</strong> Chile<br />
weakens <strong>in</strong> the northern sector <strong>and</strong> enhances farther<br />
south, reach<strong>in</strong>g the southernmost position dur<strong>in</strong>g ON.<br />
From AS to ND, positive correlations prevail along the<br />
eastern part <strong>of</strong> subtropical South America. The values<br />
are highly significant dur<strong>in</strong>g ON, especially <strong>in</strong> southern<br />
Brazil, northern Uruguay, <strong>and</strong> northeastern Argent<strong>in</strong>a.<br />
Dur<strong>in</strong>g ND this pattern <strong>of</strong> positive correlation weakens<br />
<strong>in</strong> the northeast <strong>and</strong> shifts westward. This process cont<strong>in</strong>ues<br />
<strong>in</strong> DJ, with the correlation pattern described previously<br />
for this bimonthly <strong>in</strong>terval.<br />
b. Stratification analysis<br />
The SST–ra<strong>in</strong>fall relationship dur<strong>in</strong>g warm <strong>and</strong> cold<br />
conditions <strong>in</strong> the equatorial Pacific was analyzed on a